
Following futures positions of non-commercials are as of September 5, 2023.
10-year note: Currently net short 791.5k, down 14k.
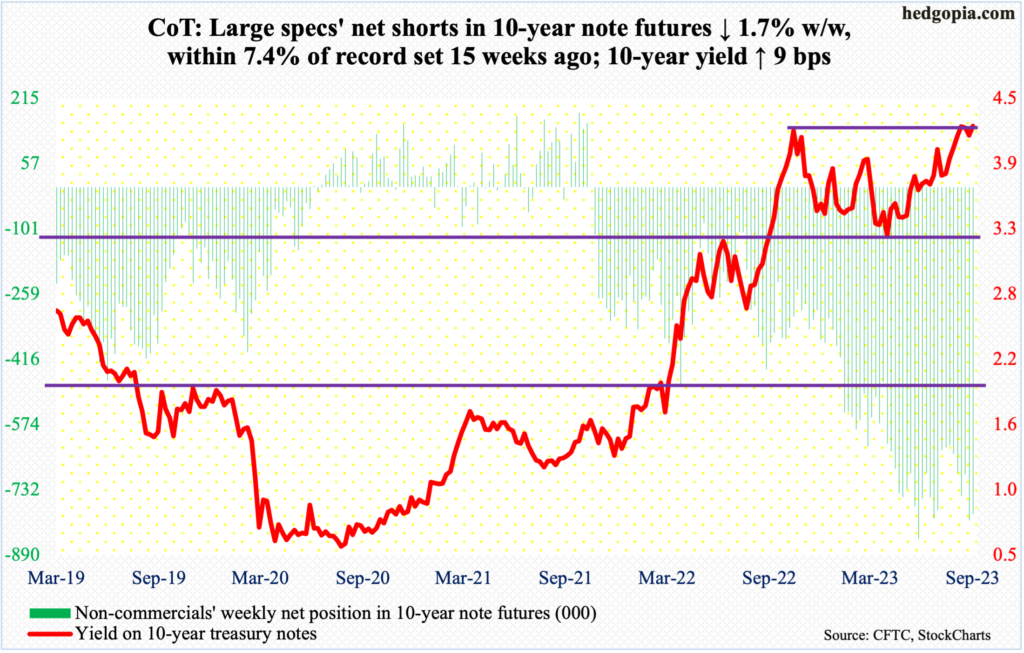
Non-commercials reduced their massive holdings of net shorts in 10-year note futures, but nothing major. At 791,535 contracts, positions remain within 7.4 percent of the record 850,421 recorded in the week to May 30 this year.
Seven weeks ago, in the week to July 25, these traders had reduced holdings to 623,771 before once again showing aggression in their bearish bias; the 10-year yield finished that session at 3.91 percent and proceeded to rally to tag 4.36 percent on August 22, which was an unsuccessful test of the prior high of 4.33 percent hit on October 13 last year.
The 10-year closed this week at 4.26 percent, lower than the high posted 13 sessions ago, but remain in the neighborhood. Non-commercials obviously are betting on a breakout and staying put (more on these dynamics here). Magnitude and timing notwithstanding, a breakout has the potential to take out stops and feed on itself.
In this respect, when the 10-year touched 4.33 percent last October, the weekly RSI was well into the 70s – high-70s, as a matter of fact. Three weeks ago, when 4.36 percent was ticked, the metric only managed a mid-60s reading. It is just one indicator, but yields’ momentum is slowing down, for whatever it is worth.
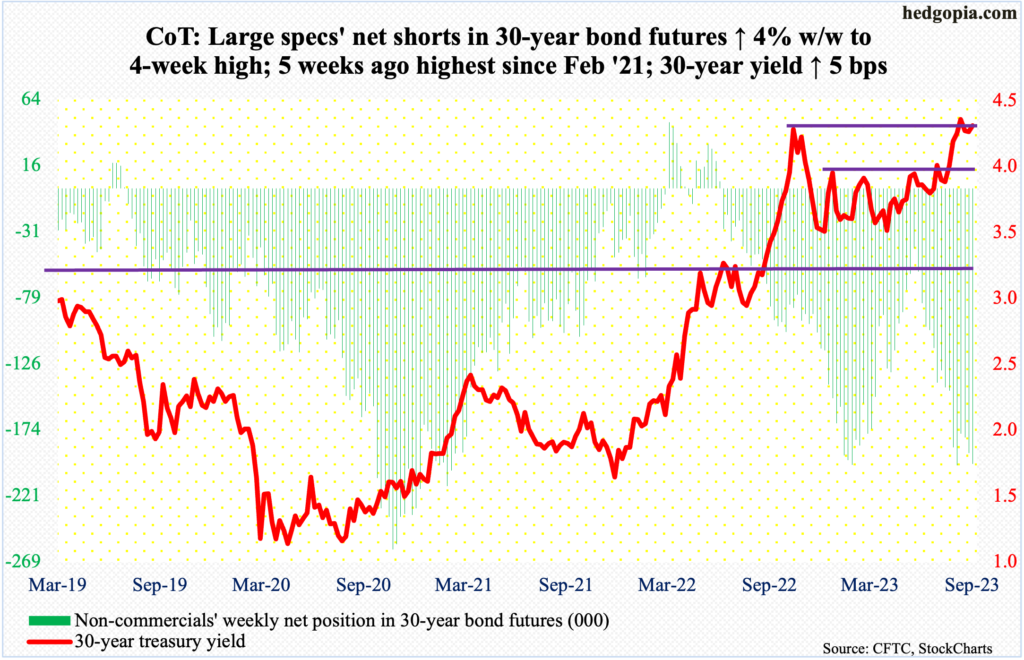
30-year bond: Currently net short 198.3k, up 7.7k.
Major US economic releases for next week are as follows.
The NFIB Optimism Index (August) is due out Tuesday. Small-business optimism increased nine-tenths of a point month-over-month in July to 91.9, which matched last November’s reading.
Wednesday brings the consumer price index (August). In the 12 months to July, headline and core CPI increased 3.2 percent and 4.7 percent respectively. They respectively peaked last year at 9.1 percent (June) and 6.6 percent (September).
The producer price index (August) and retail sales (August) are scheduled for Thursday.
On a year-over-year basis, headline and core wholesale prices rose 0.8 percent and 2.7 percent in July, in that order.
Retail sales rose 0.7 percent m/m in July to a seasonally adjusted annual rate of $696.4 billion – a new record.
Industrial production (August) and the University of Michigan’s consumer sentiment index (September, preliminary) are on tap for Friday.
In July, capacity utilization increased 0.9 percent m/m to 79.3 percent – a two-month high. Utilization has trended lower after last September’s cycle high 80.8 percent.
Consumer sentiment declined 2.1 points m/m in August to 69.5 – a two-month low. July’s 71.6 was a 21-month high, while sentiment hit a record low 50 in June last year.
WTI crude oil: Currently net long 328.9k, up 68.2k.
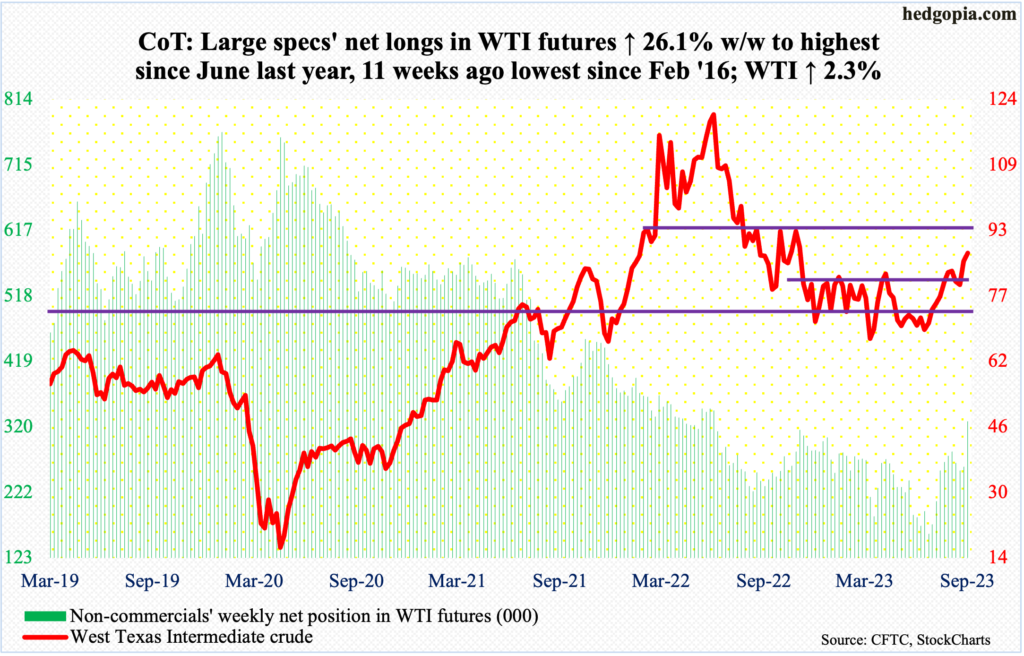
Saudi Arabia and Russia are extending their voluntary production cuts of one million barrels per day and 300,000 b/d respectively for another three months until the end of this year. Although not totally unexpected, markets treated the news as bullish, rallying West Texas Intermediate crude another 1.3 percent on Tuesday; nevertheless, oil bulls were unable to hang on to all of the session’s gains of 2.9 percent. Tuesday’s session high $88.07 drew sellers, as did Wednesday’s high of $88.08 and Friday’s $87.95. When it was all said and done, the crude finished up 2.3 percent for the week to $87.51/barrel.
This week’s performance follows a range breakout last week; in the prior nine months, WTI went back and forth between $71-$72 and $81-$82. It has now rallied for nine out of the last 11 weeks, having tagged $67.05 in late June.
Non-commercials rode the rally nicely, as by the week to June 27, they had reduced net longs to the lowest since February 2016. This Tuesday, holdings were the highest since June last year.
The daily is extended, but a decisive takeout of $88 can add to momentum, proceeding toward $93.
In the meantime, as per the EIA, for the third week in a row, US crude production in the week to September 1 was unchanged week-over-week at 12.8 mb/d, which is the highest since March 27, 2020. Crude imports increased 153,000 b/d to 6.8 mb/d. As did distillate stocks, which grew 679,000 million barrels to 118.6 million barrels. Stocks of crude and gasoline, however, decreased 6.3 million barrels and 2.7 million barrels respectively to 416.6 million barrels and 214.7 million barrels; crude inventory is at a 39-week low. Refinery utilization declined two-tenths of a percentage point to 93.1 percent.
E-mini S&P 500: Currently net short 144.2k, up 2.1k.
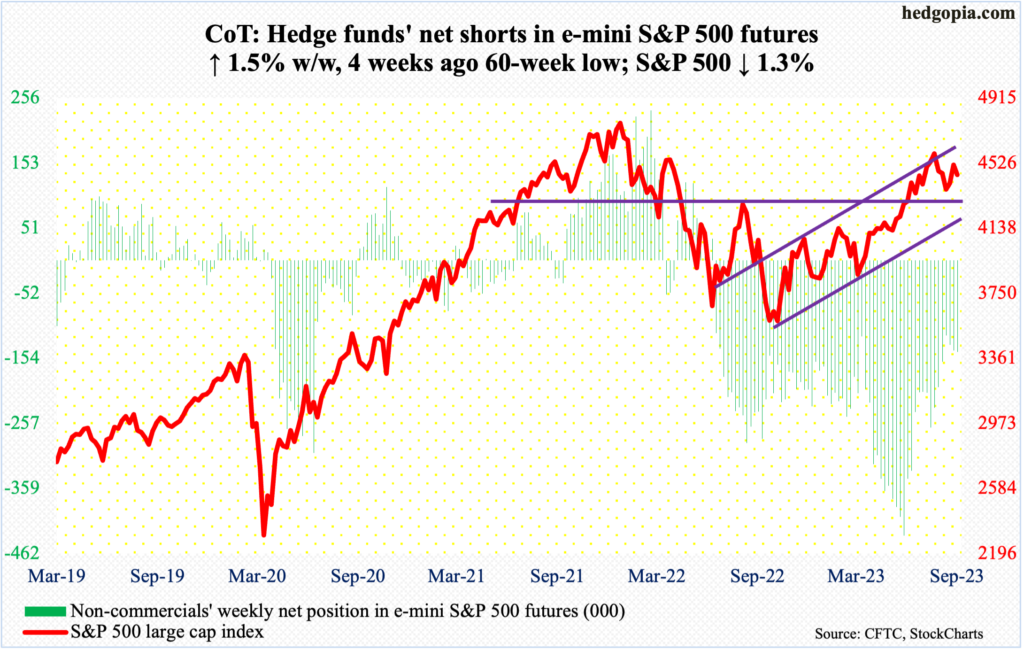
Equity bulls and bears are fighting for control of 4450s. Down 1.3 percent for the week – and down 1.9 percent at Thursday’s low 4430 – that is precisely where the S&P 500 (4457) ended. In fact, the large cap index was up as high as 4474 on Friday, but sellers showed up at the 50-day moving average (4478).
The daily has room to continue lower. A decisive breach of 4450s can open the door toward breakout retest at 4320s, which is a must-hold.
Euro: Currently net long 136.2k, down 10.4k.
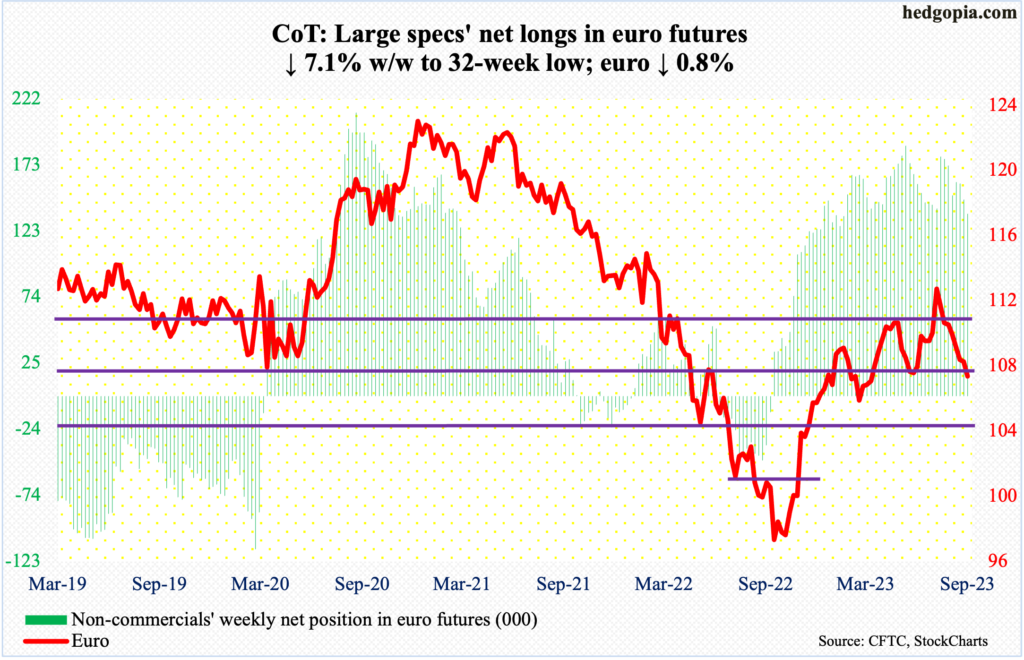
The euro shed another 0.8 percent this week – for eight consecutive down weeks.
The currency rallied from $0.9559 last September to $1.1270 on July 18 this year. Euro bulls were unable to sustainably take out stiff resistance at $1.09-$1.10.
This week began with Tuesday’s gap-down and ended with Friday’s gravestone doji. The May 31 low of $1.0635 has now garnered significance. There is long-term horizontal support at $1.0550-$1.0650.
Gold: Currently net long 138k, up 14.7k.
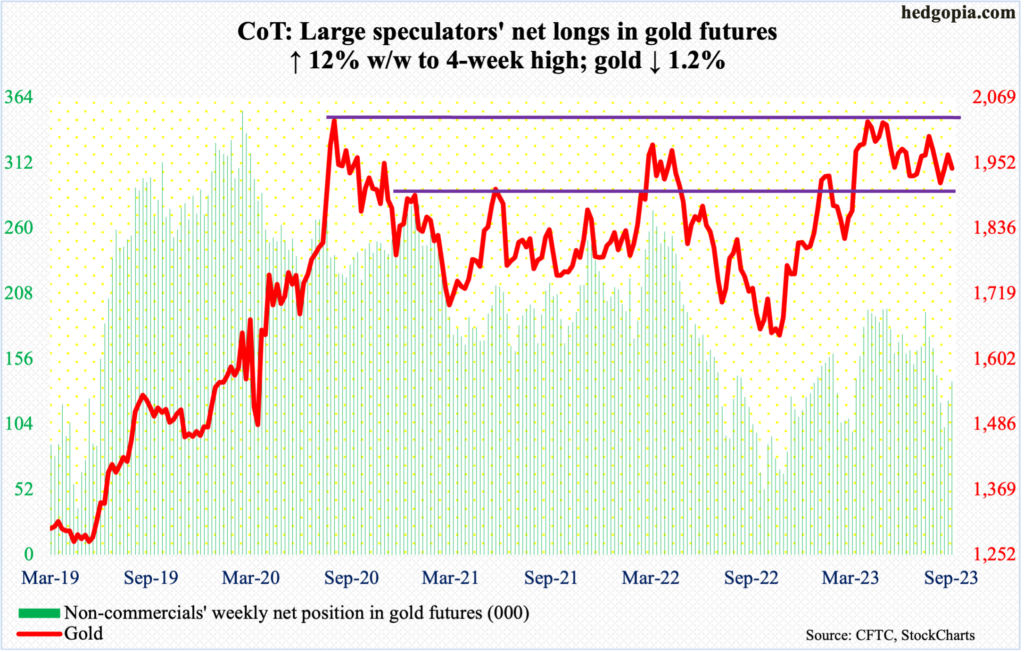
Gold remains rangebound.
Gold bugs had a tremendous opportunity in May this year to stage a major breakout, but the metal headed lower as soon as $2,085 was ticked on the 4th. In the past, $2,089 was tagged in August 2020 – an all-time high – and $2,079 in March 2022.
Concurrently, the bears have been unable to convincingly reclaim $1,920s.
This week, the 50-day ($1,952) was lost on Wednesday, and Friday’s attempts to recapture the average was denied. Odds favor a test of the 200-day at $1,925 in the sessions ahead. Gold closed out the week at $1,943/ounce.
Nasdaq 100 index (mini): Currently net long 13.6k, down 2.6k.
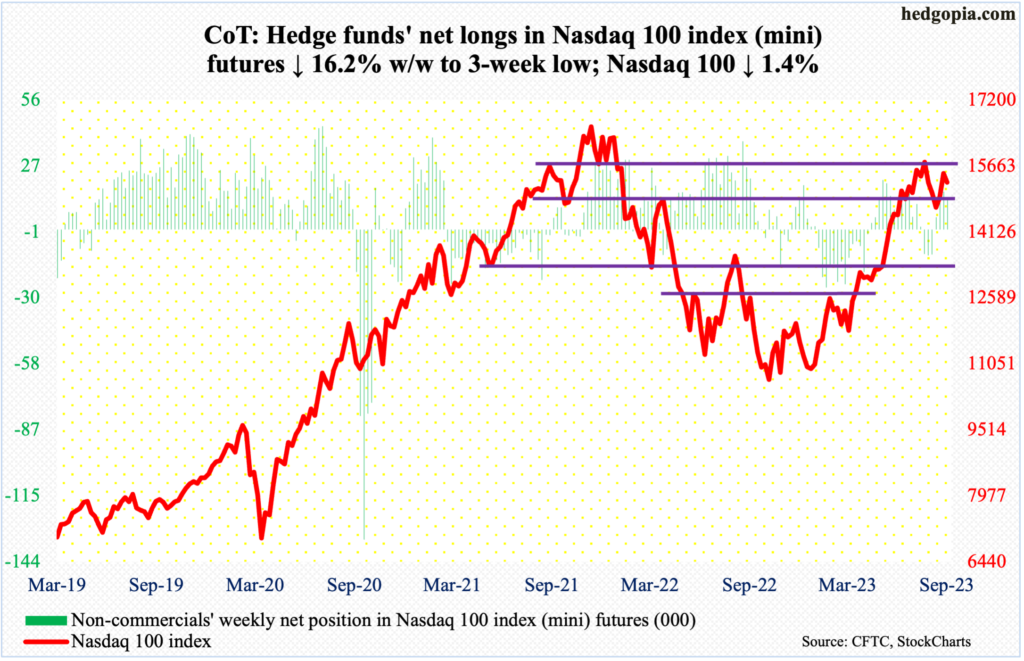
Apple (AAPL) has the largest weight of 11.4 percent in QQQ (Invesco QQQ Trust). This week, the stock fell six percent on the back of news that Chinese government workers could be banned from using iPhones.
Despite this, the Nasdaq 100 (15280) held up well, down only 1.4 percent, finishing the week right at the 50-day (15285). Horizontal support at 15200s was tested and held, with Thursday’s low 15139 attracting bids.
Mid- to long-term, the inability last week to take out the July 19 high of 15932 has established a pattern of lower highs. Last November, the Nasdaq 100 peaked at 16765, followed by a lower high of 16607 in December.
Russell 2000 mini-index: Currently net short 71.7k, up 4.8k.
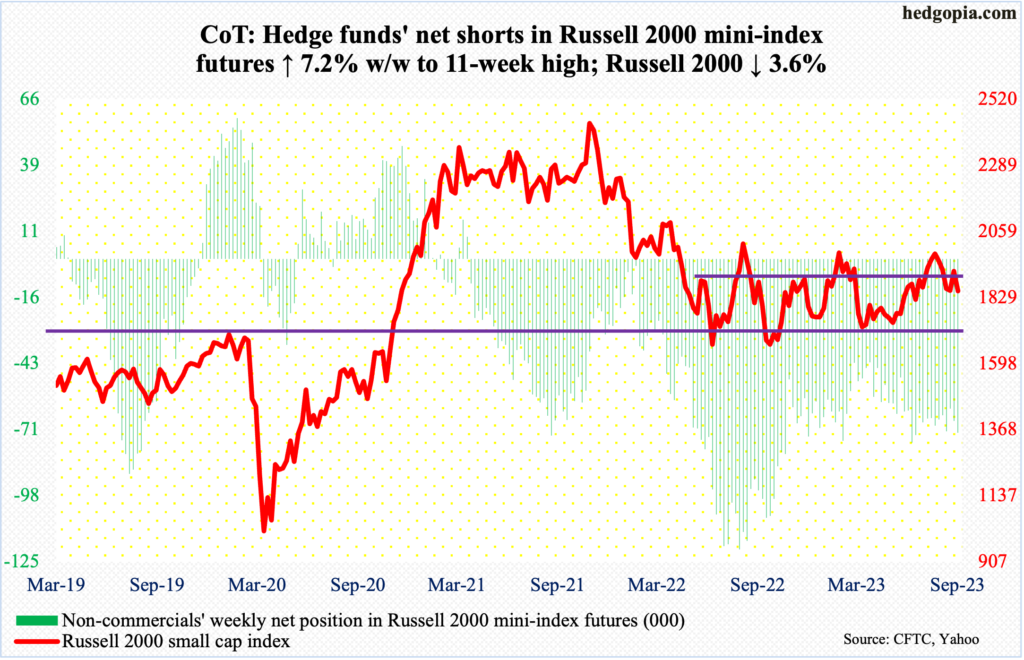
The Russell 2000 fell in all four sessions this week, down 3.6 percent for the week. Last week, it managed to close above 1900, and staying above proved difficult this week.
The small cap index had been rangebound between 1700 and 1900 since January last year. A breakout occurred on July 11 (this year). After that, it went on to rally to 2004, which was hit on July 31, but came up short of eclipsing the February (2023) high of 2007. The downward pressure since found support at 1830s twice last month – on the 18th and 25th.
At this juncture, a test of 1830s – and/or 1800 – is more likely than a run toward 1900.
US Dollar Index: Currently net long 3.4k, up 536.
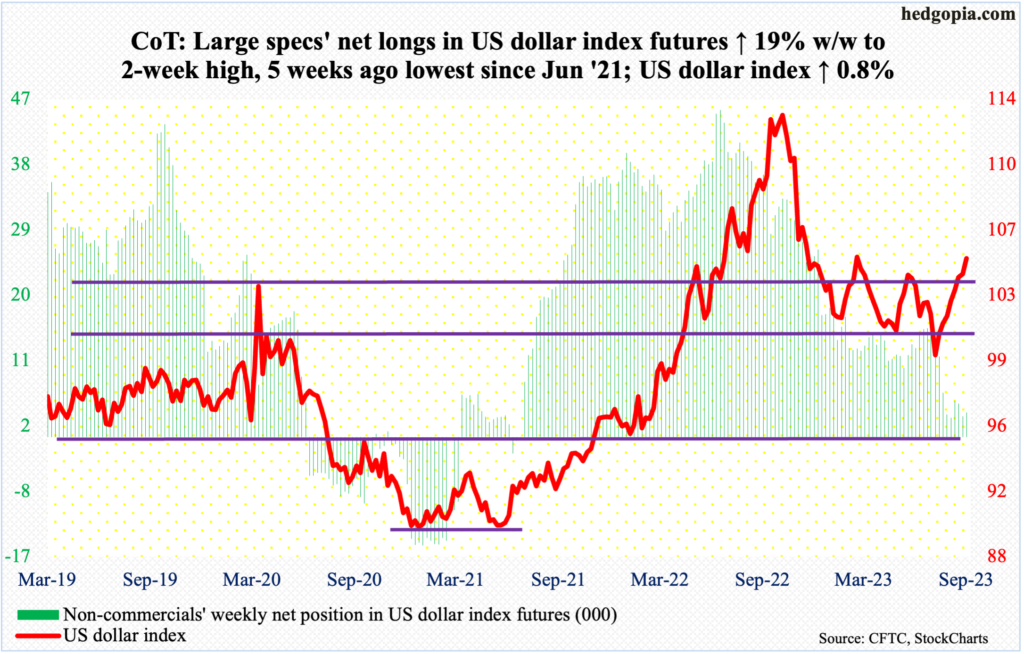
Up 0.8 percent this week, the US dollar index is now up eight weeks in a row. From the low of 99.22 reached on July 18, it ended this week at 105.07.
Resistance at 103-104 goes back to at least December 2016. On August 25, in a long-legged doji session, dollar bulls rallied the index to 104.39 before running out of steam. This week, the roadblock was taken care of as soon as the week got underway on Tuesday.
Longer-term, the monthly has just begun to turn up. Near term, 105 is an interesting area to watch.
VIX: Currently net short 42.7k, up 8.9k.
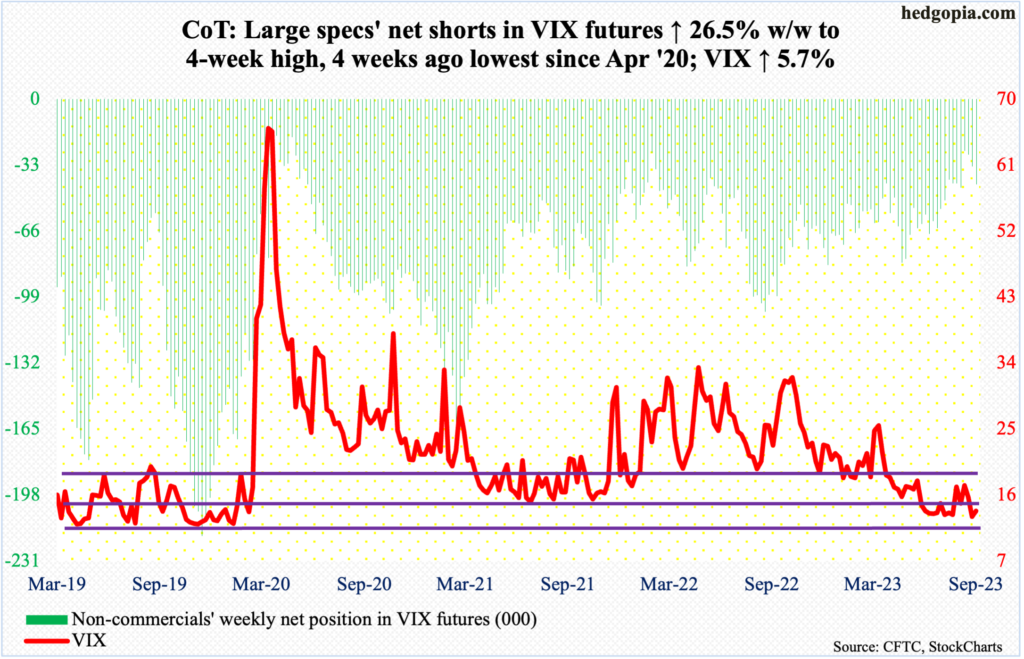
VIX’s close last week at 13.09 was at/near decent support at 13, with June and July finding support at 12.73 and 12.74 respectively. This week, the volatility index began to firm up right from the word go, but at the same time failed to hang on to the gains, having risen as high as 15.69 on Thursday and closing Friday at 13.84.
Right here and now, volatility could go either way, with the bulls absolutely needing to defend 13 on the downside and take out the 50-day (14.81) on the upside, with the average having come in the way on Friday.
Thanks for reading!
