
Following futures positions of non-commercials are as of November 28, 2023.
10-year note: Currently net short 685.4k, up 27.2k.
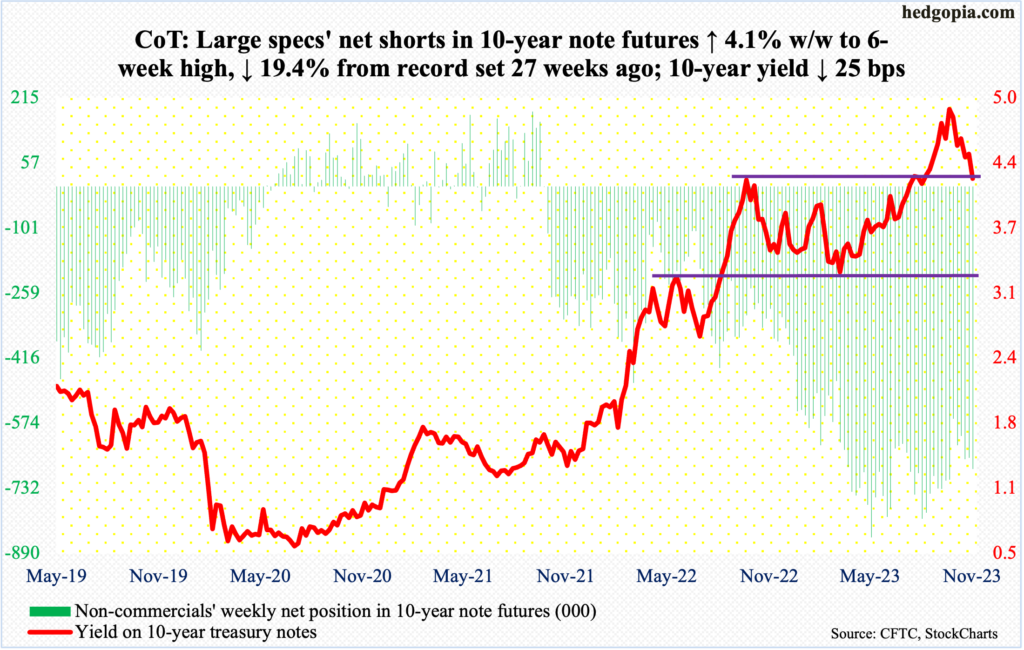
Non-commercials do not seem ready to let go of their bearish bias just yet. This week, their holdings of net shorts in 10-year note futures increased 4.1 percent week over week to 685,354 contracts. This is lower than the record high 850,421 posted in the week to May 30th this year but remains elevated.
These traders remain aggressively short even as the 10-year treasury yield peaked at five percent in October, when for three consecutive sessions it tried to unsuccessfully take out that level, with the high of 4.997 percent recorded on the 23rd. This week, it lost 25 basis points to 4.23 percent, breaching the crucial 4.3s.
In October last year, the 10-year retreated after ticking 4.33 percent. Only two months before that, these notes were yielding 2.53 percent in August and 1.13 percent one year before that. After the October 2022 peak, yields dropped to 3.25 percent in April (this year). After a few tries, the October high was taken out in July, followed by a rally to five percent, which was the highest print since July 2007. This week’s breakout retest failed.
On Tuesday, the 10-year closed at 4.34 percent. It is possible non-commercials covered their shorts in the subsequent sessions as this level got compromised. If not, they will have another opportunity as yields rise either from the current level or a little lower. The 200-day moving average lies at 4.02 percent, with the daily in oversold territory.
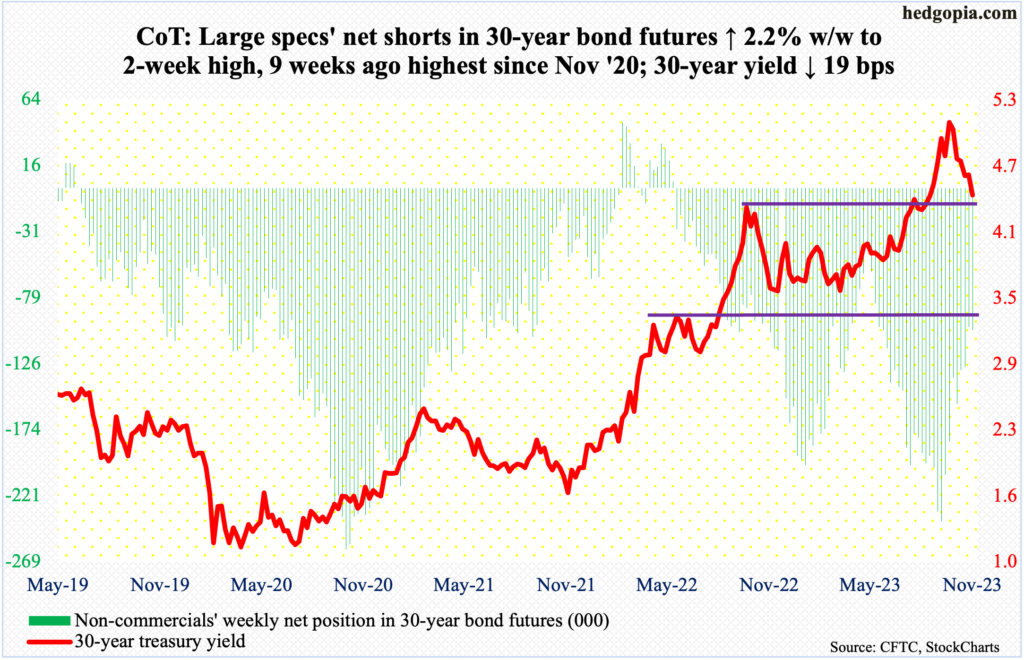
30-year bond: Currently net short 102.2k, up 2.2k.
Major US economic releases for next week are as follows.
Durable goods orders (October, revised) are due out Monday. Orders for non-defense capital goods ex-aircraft – proxy for business capex plans – edged lower 0.06 percent month over month to a seasonally adjusted annual rate of $73.8 billion. A record high $74 billion was set in August.
The ISM non-manufacturing index (November) and JOLTs job openings (October) are scheduled for Tuesday.
Services activity in October shrank 1.8 percentage points m/m to 51.8 percent. This was the 10th consecutive 50-plus reading since last December’s 49.2 percent.
In September, non-farm openings increased 56,000 m/m to 9.55 million. Openings rose for two successive months after dropping to a 28-month low of 8.92 million in July. Earlier, they peaked at 12.03 million in March last year.
Labor productivity (3Q23) is on dock for Wednesday. In the second quarter, after five quarters of year-over-year decline in non-farm output per hour, it grew 1.3 percent in the September quarter.
Friday brings payroll (November) and the University of Michigan’s consumer sentiment index (December, preliminary).
In each of three of the five months through October, the economy produced fewer than 200,000 non-farm jobs. In the first 10 months this year, a monthly average of 239,000 jobs was created, down from last year’s monthly average of 399,000 and 606,000 before that.
Consumer sentiment in November dropped 2.5 points m/m to 61.3 – a six-month low. In June last year, sentiment hit a record low 50.
WTI crude oil: Currently net long 173.8k, down 23.4k.
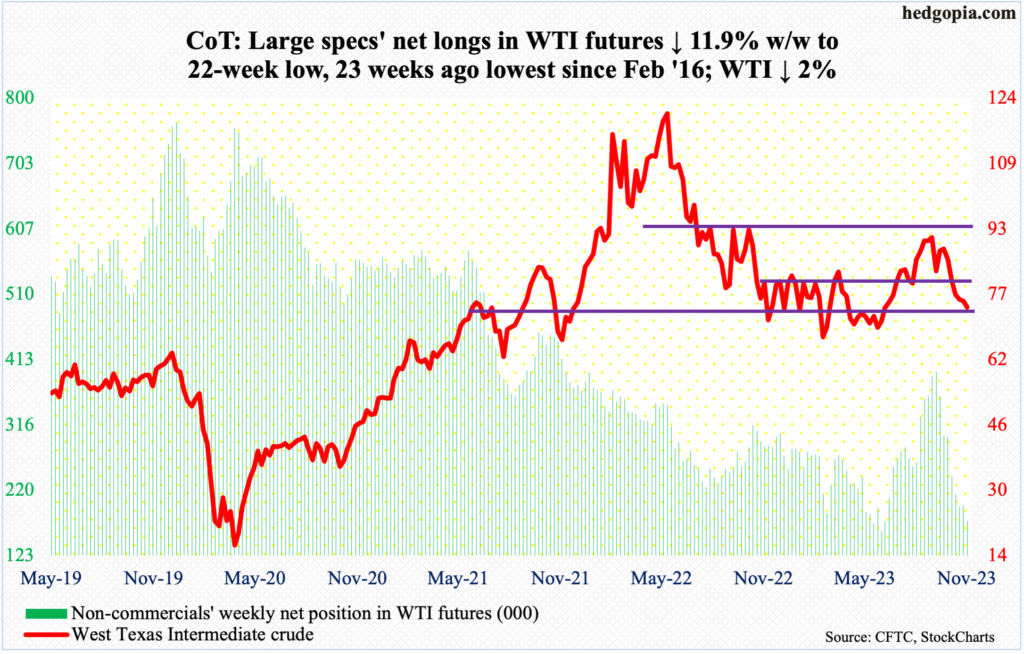
Several OPEC+ members, including Saudi Arabia and Russia, on Thursday agreed to voluntarily cut crude output by 2.2 million barrels per day in the first quarter next year. Oil traders pretty much yawned at this, as West Texas Intermediate crude dropped two percent this week to $74.07/barrel – its sixth down week in a row.
That said, the crude has just about gone sideways just above potentially crucial support. Since last December, WTI has essentially gone back and forth between $71-$72 and $81-$82. It peaked at $95.03 on September 28th and touched $72.37 on the 16th last month. Thursday, when the OPEC+ news was made public, sellers showed up at $79.60, closing the session at $75.96, with the 200-day at $78.05.
As things stand, oil bulls are risking a breach of the aforementioned range support.
In the meantime, as per the EIA, US crude production in the week to November 24th remained unchanged for eight weeks in a row at a record 13.2 million barrels per day; this preceded four weeks of flat output at 12.9 mb/d. Crude imports decreased 696,000 b/d w/w to 5.8 mb/d. Stocks of crude, gasoline, and distillates all grew – by 1.6 million barrels, 1.8 million barrels and 5.2 million barrels respectively to 448.7 million barrels, 218.2 million barrels and 110.8 million barrels. Refinery utilization was up 2.8 percentage points to 89.8 percent.
E-mini S&P 500: Currently net short 65k, down 15.1k.
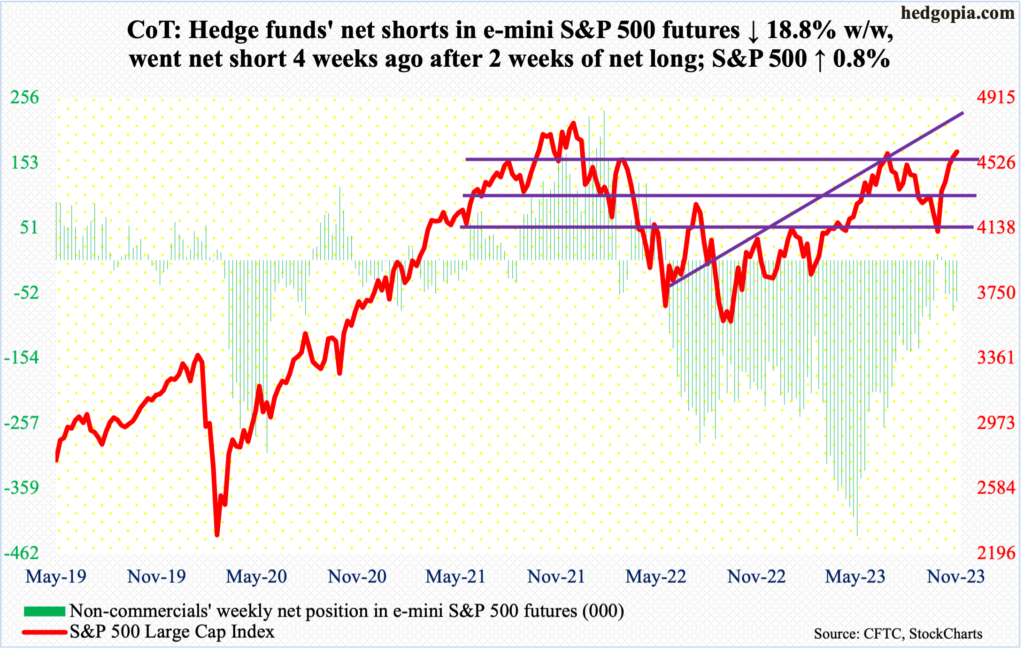
November brought heady gains for the bulls. The S&P 500 was up 8.9 percent! December is only one session old, but the large cap index picked up where it left off, up 0.6 percent. Non-commercials continue to remain skeptical, although they have had a bearish bias since June last year.
After two weeks of staying long, these traders switched to net short four weeks ago – as of November 7th. By then, the cash already has had two gap-ups, followed by another on the 14th. Momentum is very strong, with the daily RSI in the 70s since mid-November, ending Friday at 73.44.
This week’s 0.8-percent gain constitutes the fifth consecutive positive week, closing at 4595, which is less than 13 points from surpassing the July high of 4607. With the daily as overbought as it is but momentum strong, this is going to be an important test next week.
Euro: Currently net long 143.2k, up 13.5k.
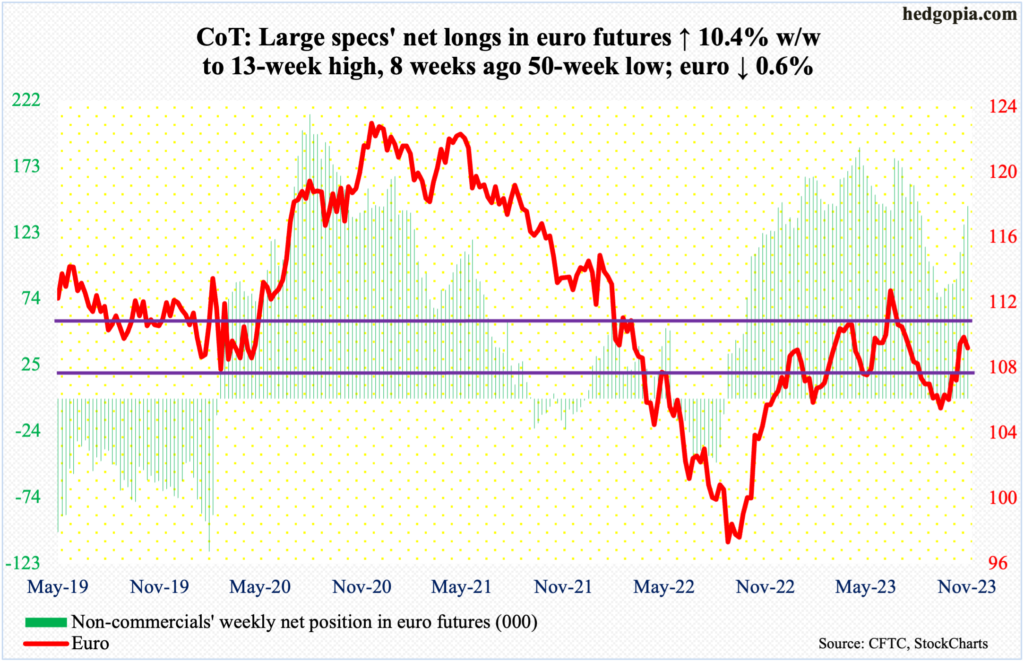
Tuesday’s intraday high of $1.1011 was the highest since August 10th, but euro bulls were unable to hang on to it, closing the week at $1.0883.
Earlier, the currency dropped from $1.1270 mid-July to $1.0448 early October.
Non-commercials continue to lean bullish, with net longs at a 13-week high. At the same time, the daily probably wants to go lower for now. The 200-day is at $1.0813 and the 50-day at $1.0677. A rising trendline from the October low draws to $1.06.
Gold: Currently net long 200.1k, up 28.4k.
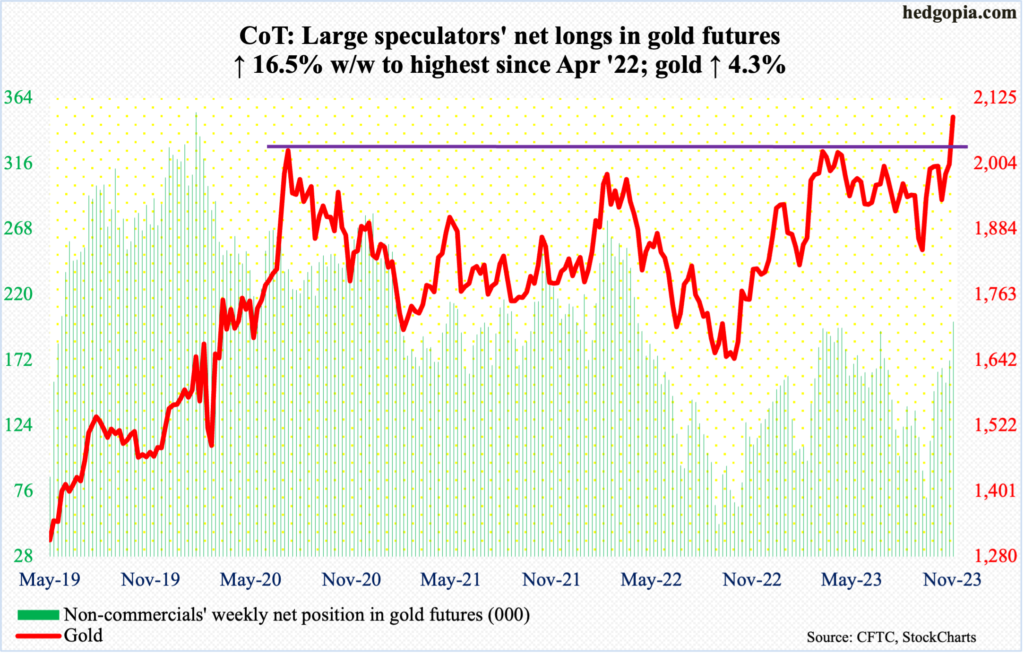
Gold rallied to both a closing and intraday high. The metal rallied 4.3 percent this week to close at $2,089.70, with an intraday high of $2,095.70. The yellow metal is on the verge of a massive breakout.
Although gold rose to a new record, it remains in the vicinity of a price point that has resisted prior advances. In August 2020, it posted a new all-time high of $2,089 and retreated. The same thing happened in March last year when it printed $2,079 and in May this year when $2,085 was tagged.
Non-commercials, whose holdings of net longs are the highest since April last year, act as if a breakout is just a matter of time, and they are probably right.
Nasdaq 100 index (mini): Currently net long 7.3k, up 2.2k.
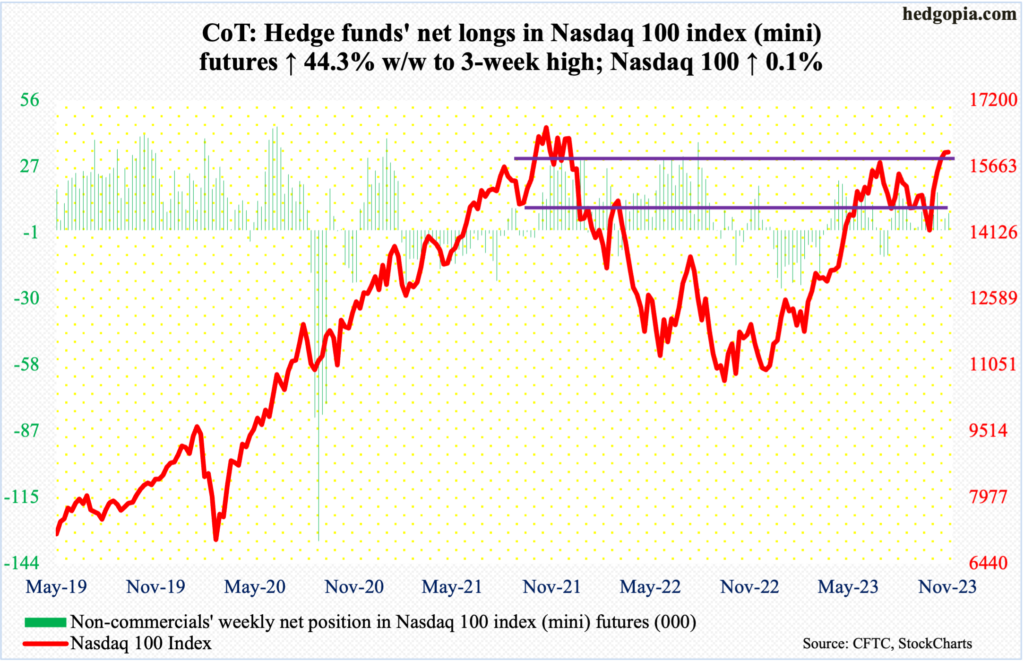
Rather curiously, the Nasdaq 100 only edged up 0.1 percent this week, closing at 15998 and ticking 16167 on Wednesday. In November 2021, the tech-heavy index reached 16765 before proceeding to subsequently enter a bear market.
Wednesday’s intraday reversal after posting a 23-month high cannot be ignored, particularly now when conditions are very overbought. A spinning top showed up on the weekly.
For now, a gap from November 14th gets filled at 15520s.
Russell 2000 mini-index: Currently net short 55.5k, down 1.8k.
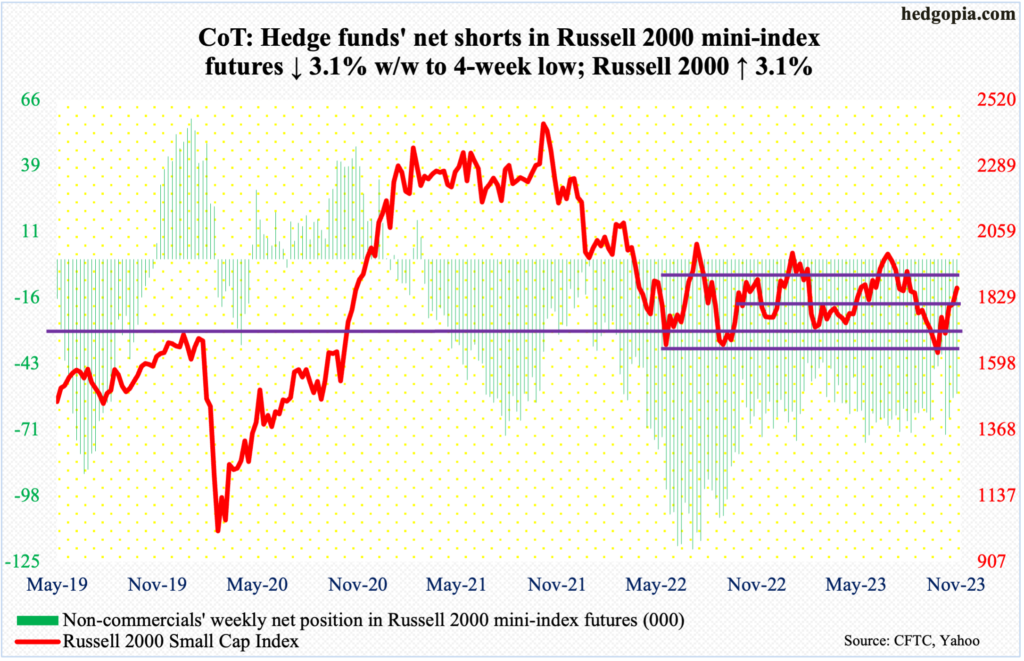
In contrast to tech, small-caps had a strong week. The Russell 2000 was up 3.1 percent to 1863. That said, just about all of the weekly gains came Friday when the index rallied three percent. Rate-cut rumors in the first quarter next year gained steam, and that fueled investor appetite for small-caps.
The small cap index has been stuck in a 200-point range between 1700 and 1900 since January last year. This remains the case. It is only if the top of the range decisively gives way can this be labeled a victory for the bulls. Else, it remains a show-me story.
US Dollar Index: Currently net long 19.1k, down 1.6k.
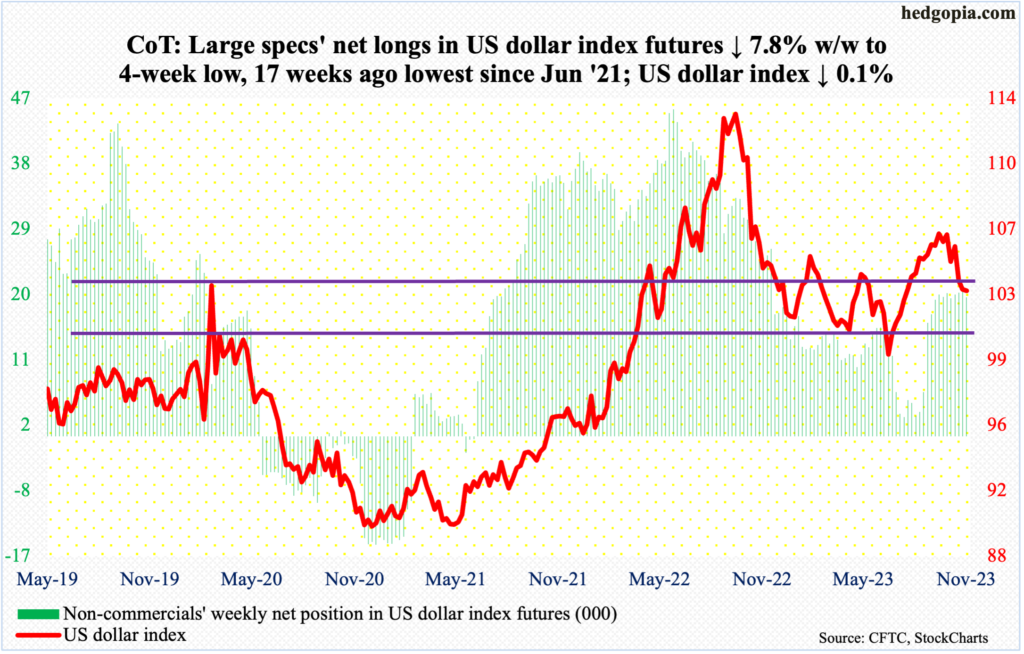
The US dollar index recovered from down 0.9 percent at Wednesday’s intraday low of 102.38 to end the week down 0.1 percent to 103.20. Before this, it unraveled after posting 106.98 on November 1st.
There is room for the daily to continue higher. For that, dollar bulls will have to take care of horizontal resistance at 103-104, which goes back to at least December 2016.
VIX: Currently net short 47.5k, up 105.
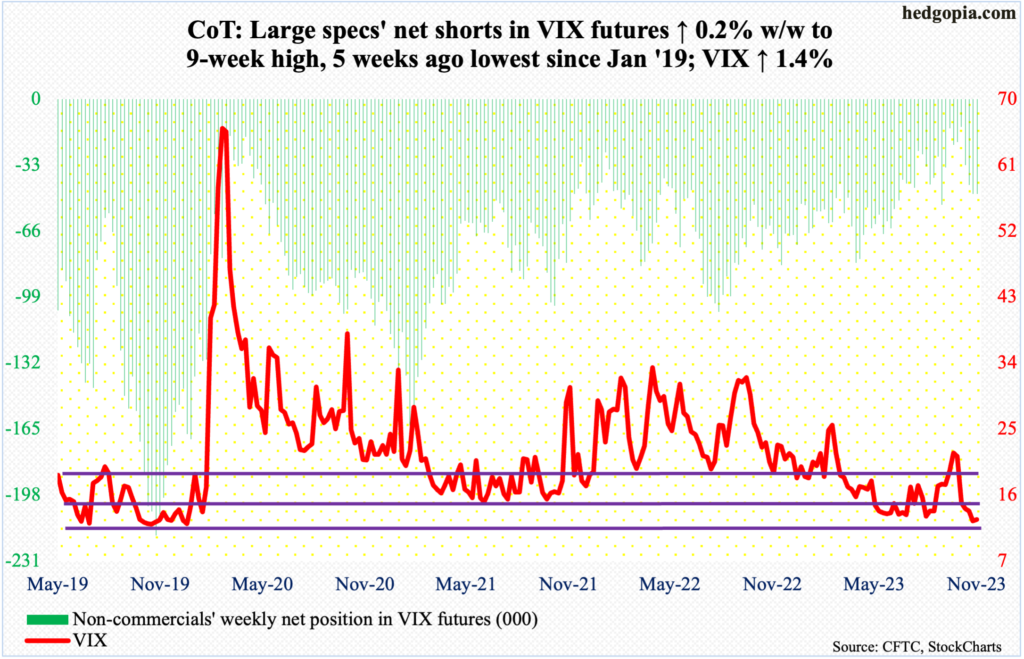
VIX closed sub-13 for seven sessions in a row, with Friday losing 0.29 point to 12.63. For the week, it added 0.17 point, moving in unison with the S&P 500. This is a rare occurrence and could prove to be important.
Prior to a rally in the volatility index in September and October, it routinely found support at 13, or just south of it, in June through September. That support is holding.
Thanks for reading!
