
Following futures positions of non-commercials are as of January 2, 2024.
10-year note: Currently net short 832.7k, up 27.7k.
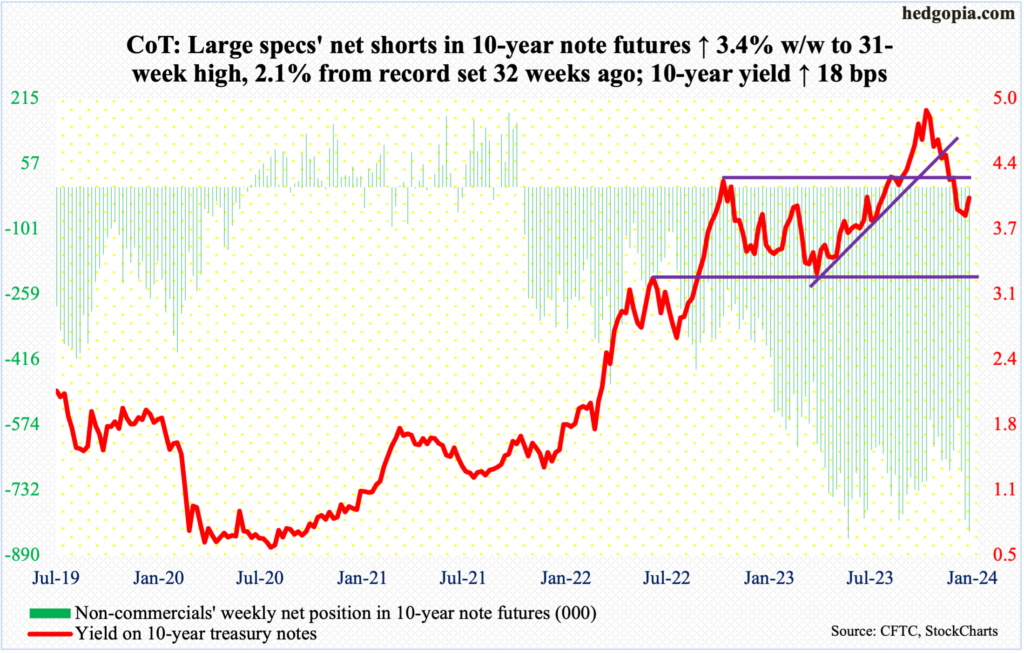
Amidst signs that the 10-year treasury yield is ready for a reflex rally, non-commercials’ net shorts in 10-year note futures went up another 3.4 percent this week to 832,663 contracts, which is merely 2.1 percent from the all-time high of 850,421 posted in the week to May 30th last year.
Yields did rally this week, up 18 basis points to 4.04 percent. There is horizontal resistance at 4.1 percent, with the 200-day at 4.04 percent. The 10-year closed Friday right at the average, having tagged 4.1 percent in a volatile, spinning top session with a low of 3.95 percent.
Earlier, the 10-year rate peaked at five percent (4.997 percent) on October 23rd. Only last April, these notes were yielding 3.25 percent (and 2.53 percent in August 2022 and 1.13 percent in August 2021).
What remains to be seen is if non-commercials are driven by this short-term trade or they are going to stay put for the long haul with their massive shorts. Of note, on December 12th, the day before the Fed made the now-famous dovish pivot, the 10-year closed at 4.21 percent. Unless inflation makes a strong comeback and non-commercials get vindicated, 4.2s are likely to be treated as a spot where bond bulls would be interested in putting capital to work.
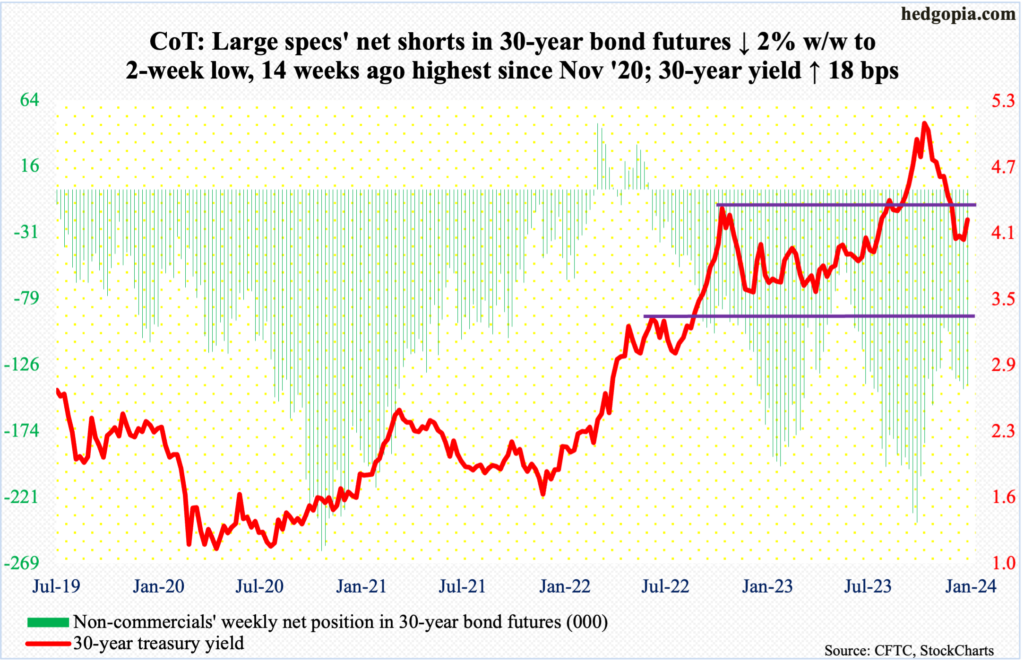
30-year bond: Currently net short 140.6k, down 2.9k.
Major US economic releases for next week are as follows.
Thursday brings the consumer price index (December). In the 12 months to November, headline and core CPI increased 3.1 percent and four percent, in that order. They respectively peaked in 2022 at 9.1 percent (June) and 6.6 percent (September).
The producer price index (December) is scheduled for Friday. From a year ago, November headline and core wholesale prices increased 0.9 percent and 2.5 percent respectively.
WTI crude oil: Currently net long 170.9k, down 37.5k.
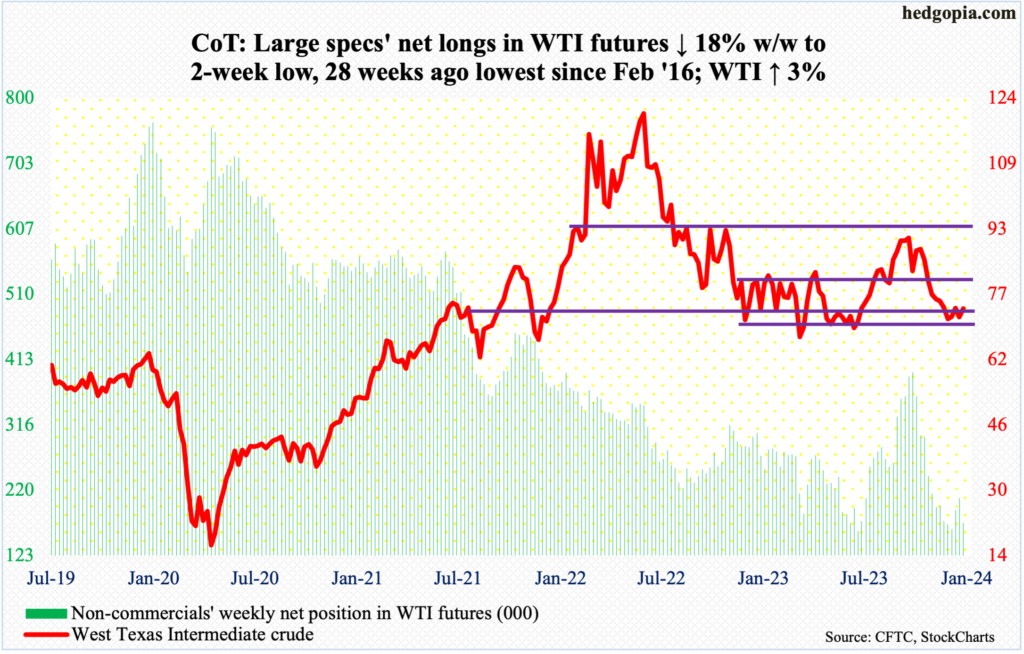
Wednesday’s intraday drop to $69.28 was aggressively bought. This was a higher low versus the December 13th trough of $67.71. For the week, West Texas Intermediate crude added three percent to $73.81/barrel.
Earlier, the crude peaked last September at $95.03, having rallied from last June’s low of $67.05. Hence the significance of $67-plus. Oil bulls deserve the benefit of the doubt insomuch as the price remains above this level.
This week, WTI firmly moved toward the middle of the one-year range between $71-$72 and $81-$82. A test of the 50- and 200-day ($75.51 and $77.75 respectively) is within reach.
In the meantime, as per the EIA, US crude production in the week to December 29th dropped 100,000 barrels per day week-over-week to 13.2 million b/d; prior week was a record. Crude imports increased 619,000 b/d to 6.9 mb/d. As did stocks of gasoline and distillates, which respectively jumped 10.9 million barrels and 10.1 million barrels to 237 million barrels and 125.9 million barrels. Crude inventory, however, declined 5.5 million barrels to 431.1 million barrels. Refinery utilization was up two-tenths of a percentage point to 93.5 percent.
E-mini S&P 500: Currently net short 214.1k, up 21.6k.
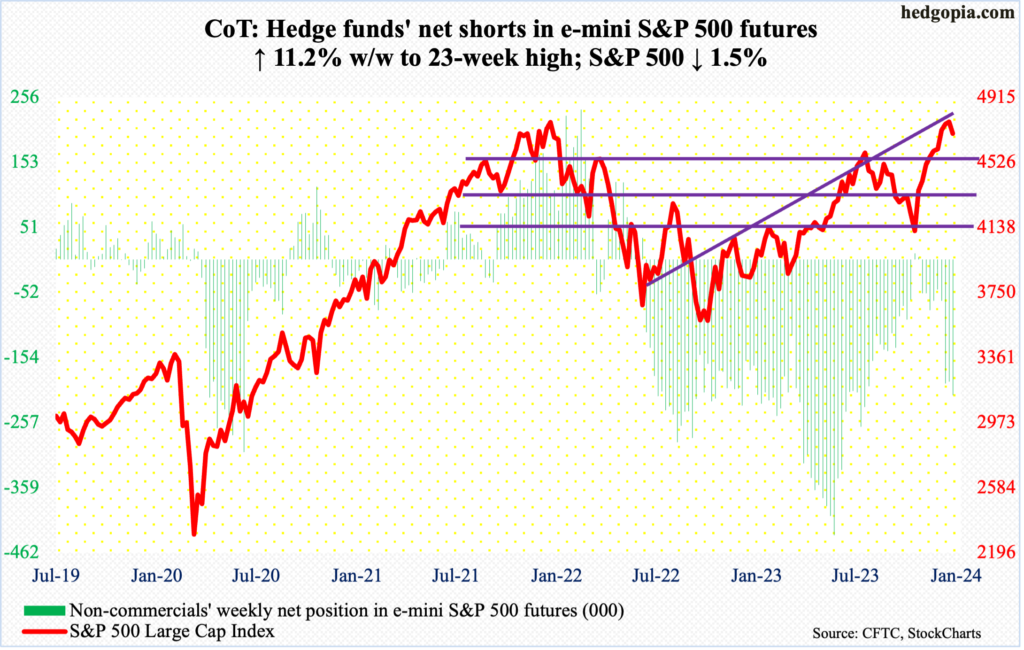
Non-commercials are not letting up, with net shorts this week rising to a 23-week high. They were rewarded as the holiday-shortened week picked up on Tuesday where it left off last Friday. Having tagged 4793 last Thursday, the S&P 500 suffered a down Friday last week. This continued in the first three trading sessions this week, losing 1.5 percent for the whole week to 4697. This was the first down week in 10.
The large cap index relentlessly rallied after bottoming late October. There is a lot of room for the weekly to continue lower to unwind the overbought condition it is in. The July high of 4607 was taken out just before the December 13th Fed-pivot rally. A retest looks imminent, and it is likely to generate a decent bull-bear tug-of-war.
Euro: Currently net long 119.5k, up 2.1k.
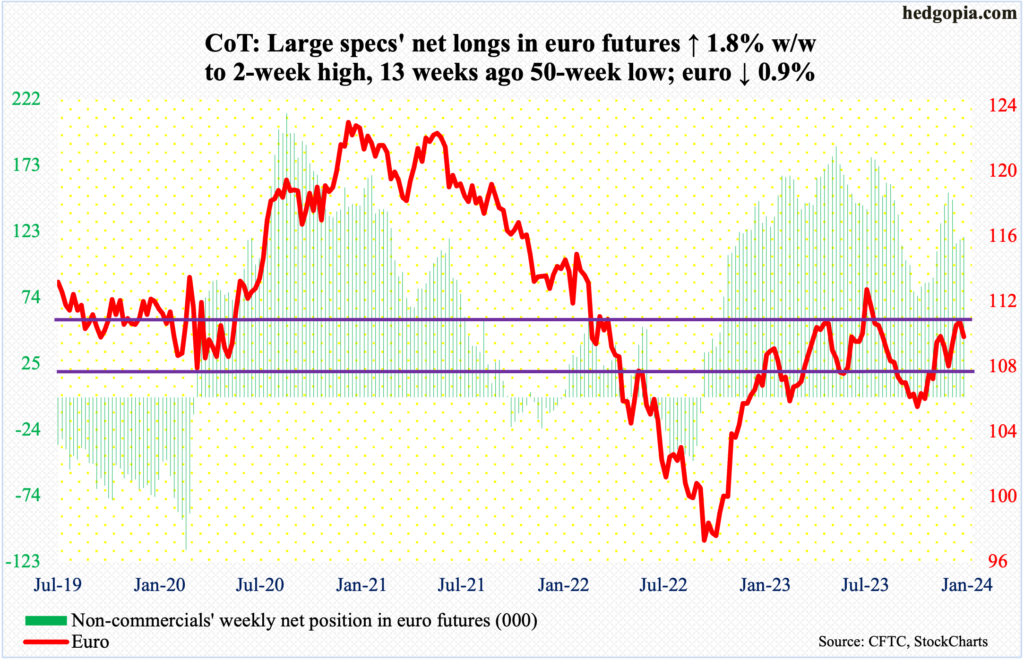
Last week, euro bulls failed to hang on to Wednesday’s intraday high of $1.125, leaving behind a weekly candle with a long upper wick. This week began with Tuesday’s 0.8-percent gap-down. After plenty of daily vacillations, with Friday’s high of $1.1 and low of $1.0877, the currency ended the week down 0.9 percent to $1.0942.
The daily RSI at 51.52 is just above the median, which needs to hold if the euro were to rally near-term. Mid-term, the weekly has room to go lower.
Gold: Currently net long 207.6k, down 69.
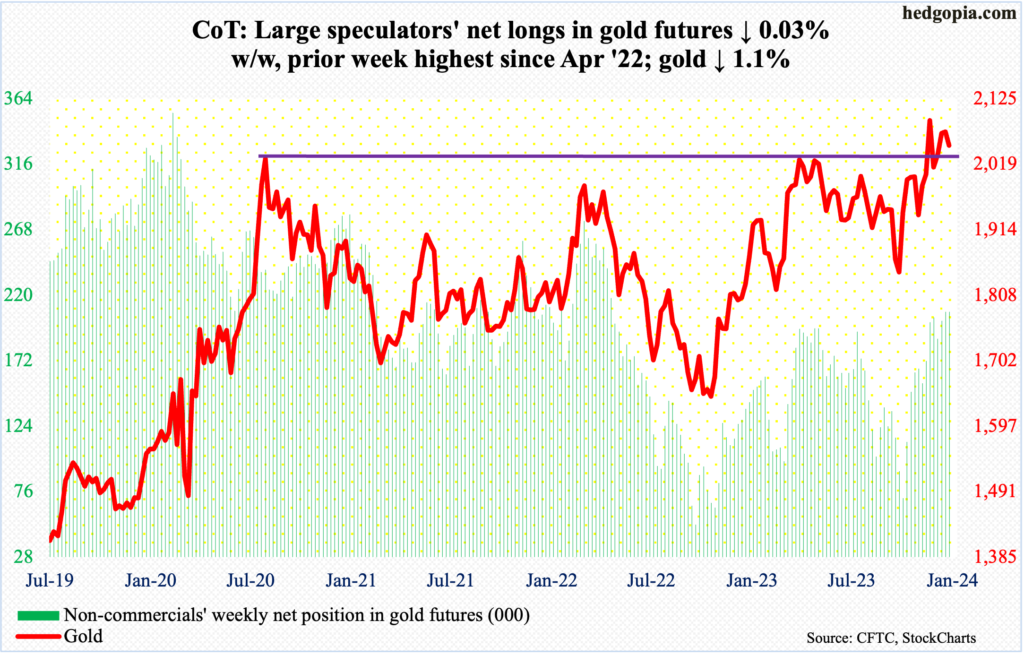
Yet another week in which gold bugs went after but were rejected at $2,080s. The metal opened the week with Tuesday’s tag of $2,088. Turns out that was the high of the week, with Friday ticking $2,031, finishing the week at $2,050/ounce.
On the 4th last month, no sooner did gold break out of $2,080s than it quickly met with a nasty reversal, rising as high as $2,152 but only to close at $2,042. This level is very important. In August 2020, the metal posted a new all-time high of $2,089 and retreated. This occurred again in March last year when it printed $2,079 and in May this year when $2,085 was tagged.
From the bulls’ perspective, the good thing is that despite these repeated failures to bust out of $2,080s, gold has not crumbled. This could begin to occur should non-commercials decide to reduce their long exposure. That is yet to happen. So far, so good.
Nasdaq 100 index (mini): Currently net long 39.1k, up 11.1k.
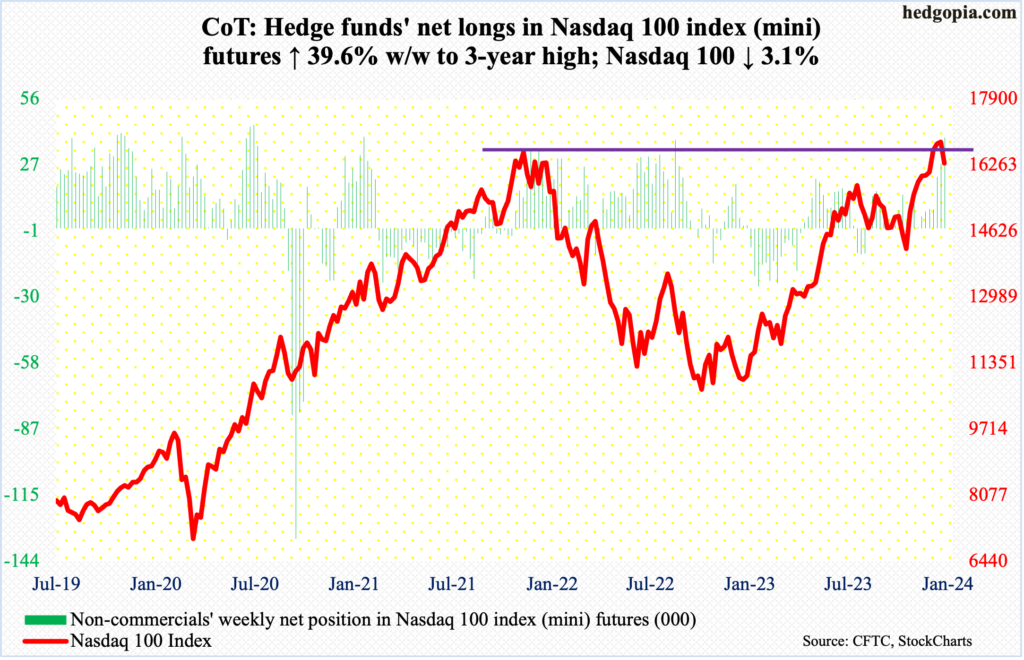
Last week, the Nasdaq 100 tried to decisively leave the November 2021 high of 16765 behind, touching 16969 on December 28th, but could not quite pull it off, ending the week up but with a weekly doji. This week, the tech-heavy index gave back 3.1 percent to 16306. Both Thursday and Friday, intraday rallies attracted sellers.
Nearest support lies at 16100s, with the 50-day – rising sharply – at 15875 and the July 2023 high of 15932. These levels are not just going to fall apart immediately ahead. That said, the weekly has tons of room for continued unwinding of the overbought territory it is in. This week’s drop came after nine consecutive up weeks.
Russell 2000 mini-index: Currently net short 921, down 11.5k.
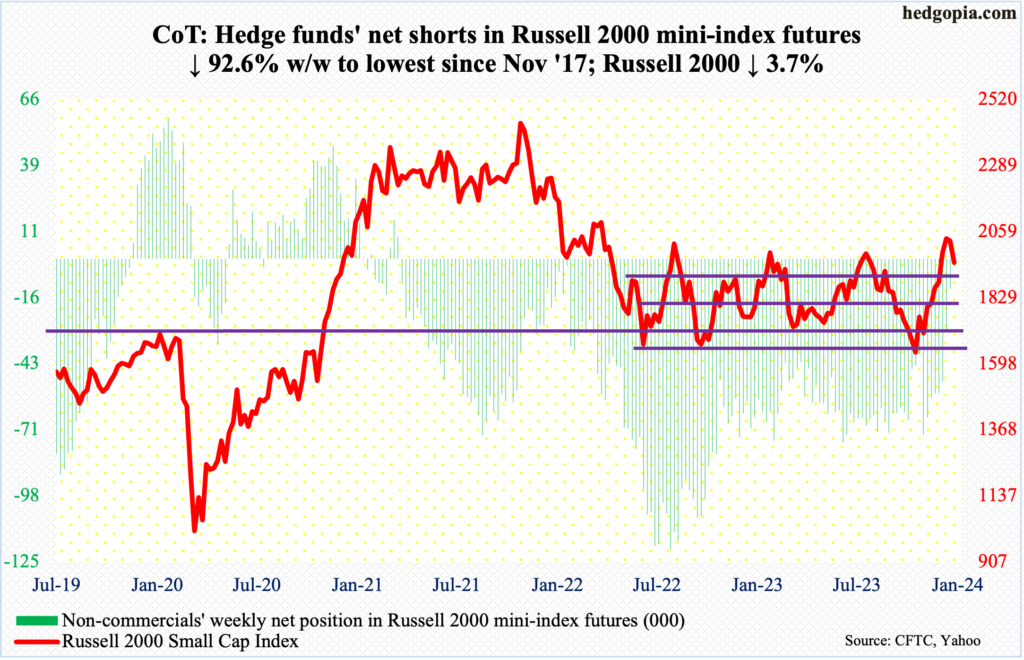
Down 3.7 percent, the Russell 2000 this week filled the December 14th gap-up. On its way here, the small cap index has been under pressure since tagging 2072 on the 27th. Its all-time high of 2459 was reached in November 2021.
Earlier, on the 13th (last month), the index broke out of a 200-point range between 1900 and 1700, which had been in place since January last year. Even before that in October, 1640s, which was hit in 2022 in June and October, was defended. Shortly after that low, the index gapped up on November 14th, which is yet to filled; this will occur at 1710.
For now, the Russell 2000 remains above 1900, closing the week at 1951. Of note, in the week to November 7th, non-commercials were net short 72,567 contracts in Russell 2000 mini-index futures. As the cash lifted off the late-October low, these traders began to cover, contributing to the rally. This week, they only held 921 net shorts. For the bulls, this tailwind is now gone.
In due course, breakout retest at 1900 is the path of least resistance.
US Dollar Index: Currently net long 2.4k, down 714.
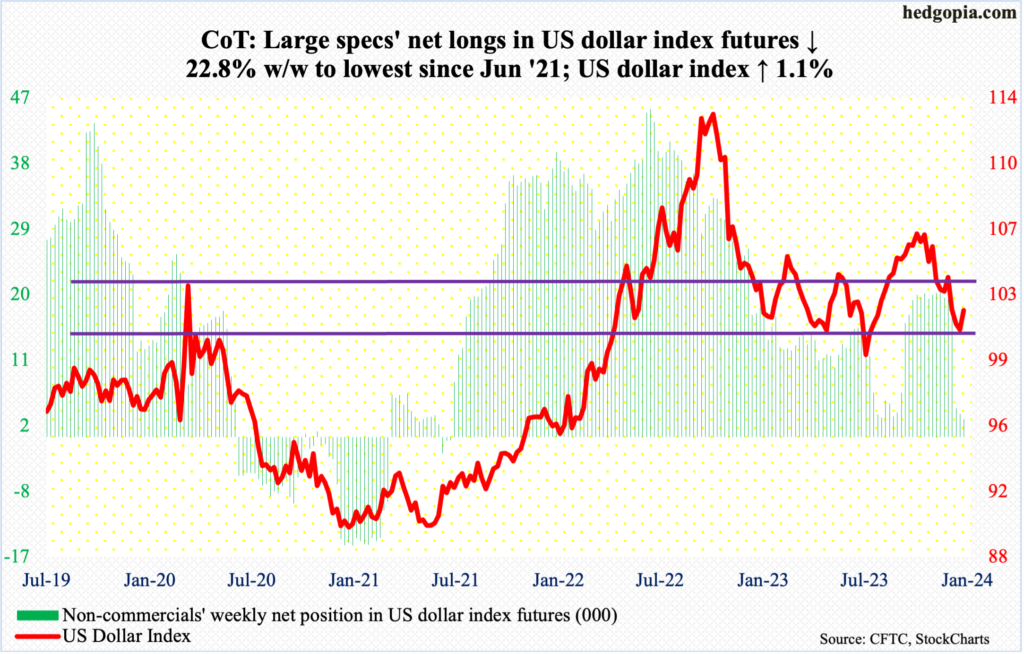
Friday’s spinning top session was wild, with a high of 102.83 and a low of 101.62, closing unchanged at 102.13; for the week, the US dollar index added 1.1 percent.
Dollar bulls built on last week’s defense of the 100-101 level, with a low of 100.32 on December 28th. Earlier, the index peaked on October 3rd at 107.05 and began to really come under pressure early November. Post-Fed pivot on December 13th, it sliced through horizontal support at 103-104 as well as the 200-day.
The daily notwithstanding, the weekly has room to rally. And for that, 100-101 is a must-hold.
VIX: Currently net short 45k, down 11.2k.
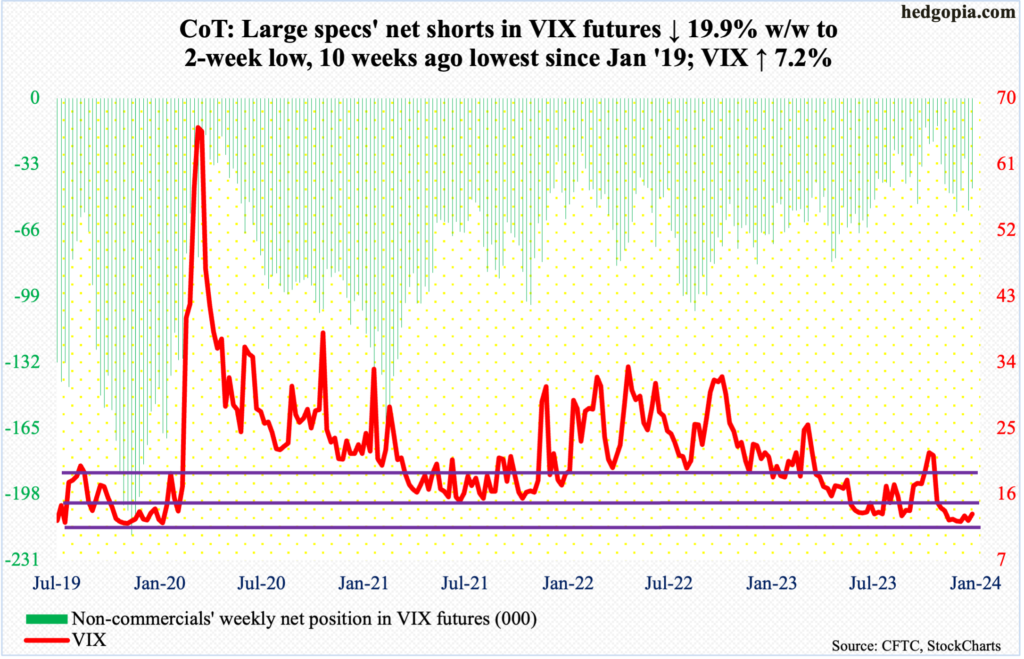
In two out of the last three weeks, volatility spiked but only to fizzle out, leaving behind long upper wicks on the weekly. This week, VIX touched 14.58 Friday but closed at 13.35. Similarly, on December 21st, the volatility index ticked 14.49 intraday but finished at 13.65.
If Friday’s rally stuck, VIX would have rallied above the 50-day, which it has been under since early November.
With all that said, on the weekly, it increasingly looks like VIX is forming a base – a la saucer bottom – before it explodes higher. The weekly has room to rally a ton. On the daily, however, the near-term outlook is hazy.
Thanks for reading!
