Following futures positions of non-commercials are as of May 14, 2024.
10-year note: Currently net short 347.8k, down 133.8k.
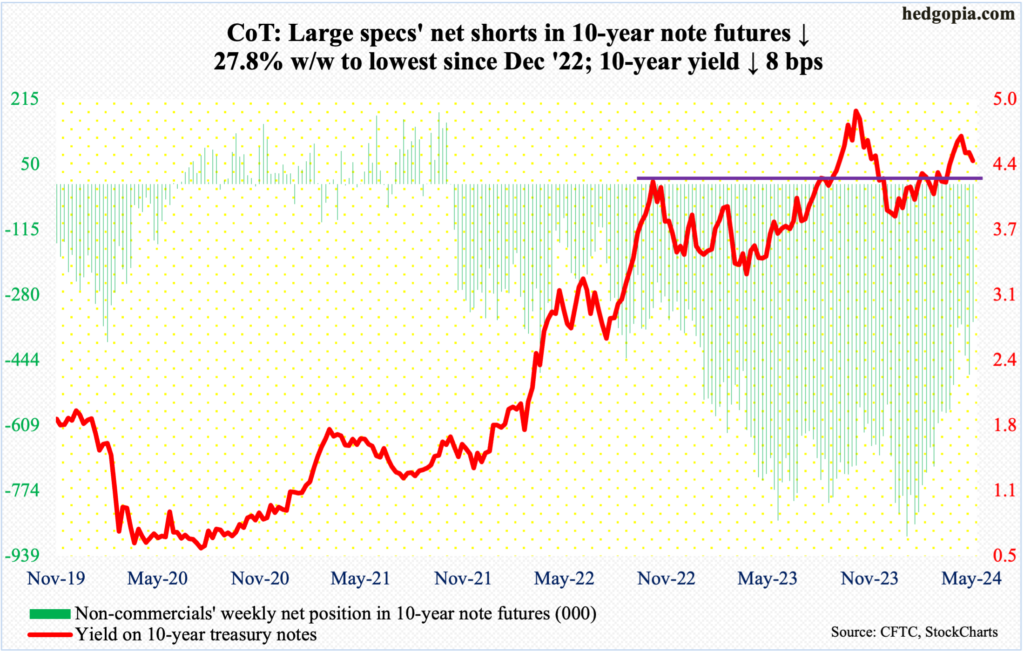
The 10-year had an important test this week. Thursday’s intraday low of 4.32 percent was a successful test of horizontal support at 4.3s, ending the week at 4.42 percent – just under the 50-day moving average at 4.43 percent. The 200-day at 4.34 percent lines up with the horizontal support. Thursday’s low also touched – just about – a rising trendline from last December when the rates bottomed at 3.79 percent.
This raises the odds of a rally in the near term – if nothing else just to unwind the oversold condition the 10-year is in on the daily. The weekly, however, has a ways to go before its overbought condition is unwound.
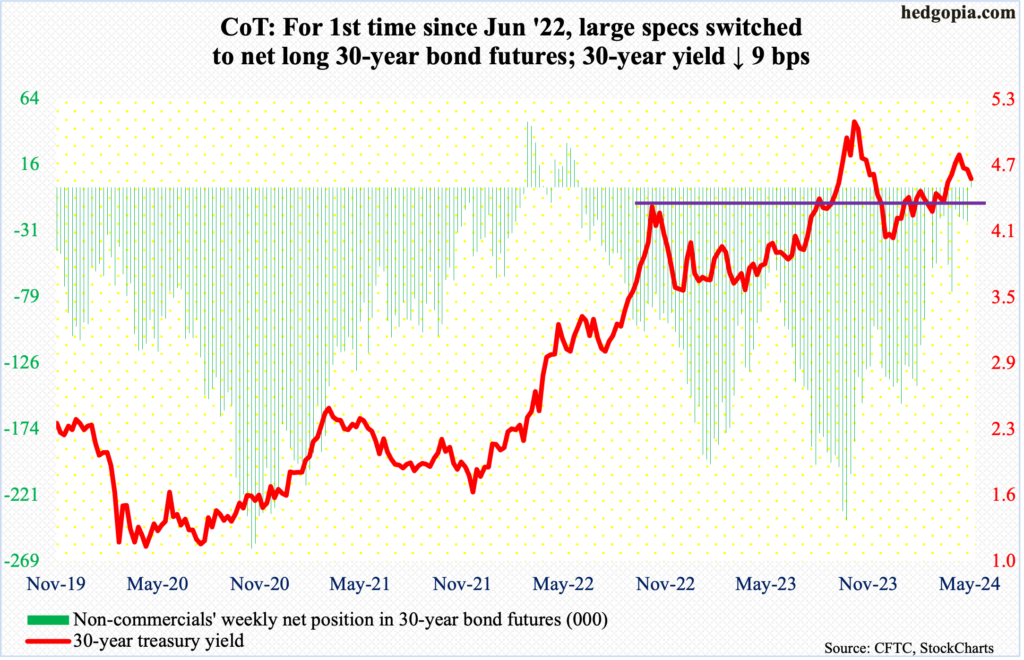
30-year bond: Currently net long 4.3k, up 29k.
Major US economic releases for next week are as follows.
Existing home sales (April) are due out Wednesday. March sales declined 4.3 percent month-over-month to a seasonally adjusted annual rate of 4.19 million units. Last October, sales hit as low as 3.85 million units.
Thursday brings new home sales (April). In March, sales jumped 8.8 percent m/m to 693,000 units (SAAR), which was a six-month high.
On Friday, durable goods orders (April) and the University of Michigan’s consumer sentiment index (May, final) are scheduled.
Orders for non-defense capital goods ex-aircraft – proxy for business capex proxy – dropped 0.2 percent m/m in March to $73.8 billion (SAAR). A record $74 billion was posted last December.
May’s preliminary estimate showed consumer sentiment tumbled 9.8 points m/m to 67.4 – a six-month low. This was the largest monthly decline since August 2021.
WTI crude oil: Currently net long 233.5k, up 19.5k.
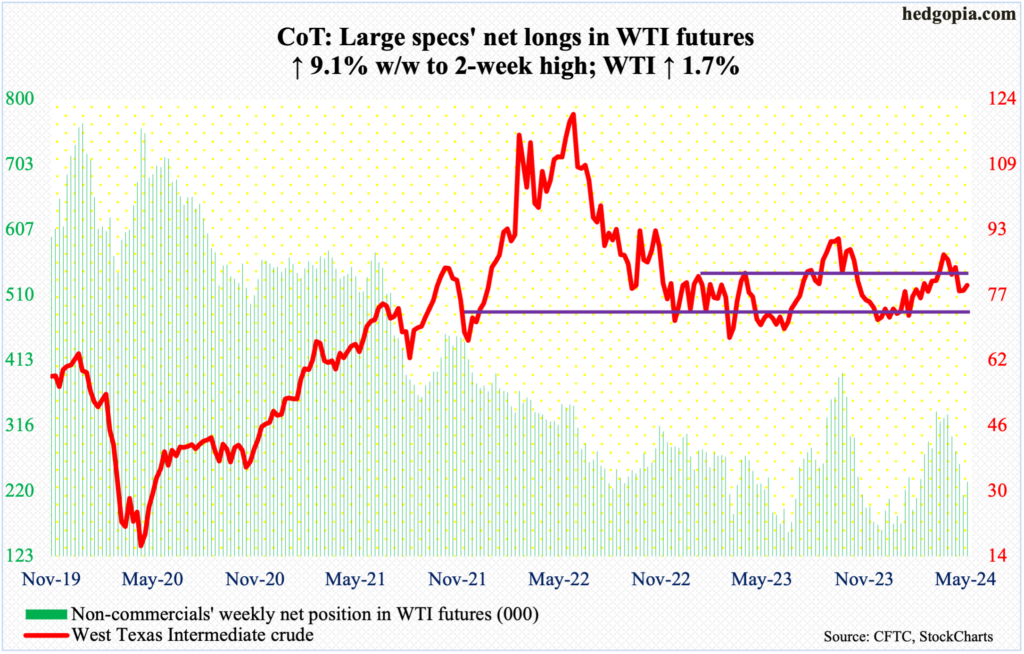
Yet again, a rising trendline from last December when West Texas Intermediate crude bottomed at $67.71 was breached intra-week but defended by the end of the week. This week’s low of $76.70 undercut last week’s $76.89 but only to attract bids and close the week up 1.7 percent to $79.58, for a weekly hammer. Last week produced a weekly doji. Earlier, the crude came under pressure after ticking $87.67 on April 12th.
Odds favor a move higher, on condition that this week’s low is not decisively breached. A couple of weeks ago, WTI fell back into a well-established range between $71-$72 and $81-$82 that persisted for 19 months before the upper end gave way seven weeks ago.
Immediately ahead, the upper end likely acts as a magnet. The 50- and 200-day lie at $81.76 and $80.01.
In the meantime, US crude production in the week to May 10th was unchanged for 10 consecutive weeks at 13.1 million barrels per day; 12 weeks ago, output was at a record 13.3 mb/d. Crude imports decreased 225,000 b/d to 6.7 mb/d. As did stocks of crude, gasoline, and distillates, which respectively dropped 2.5 million barrels, 235,000 barrels and 45,000 barrels to 457 million barrels, 227.8 million barrels and 116.4 million barrels. Refinery utilization increased 1.9 percentage points to 90.4 percent.
E-mini S&P 500: Currently net short 25.3k, up 15.6k.
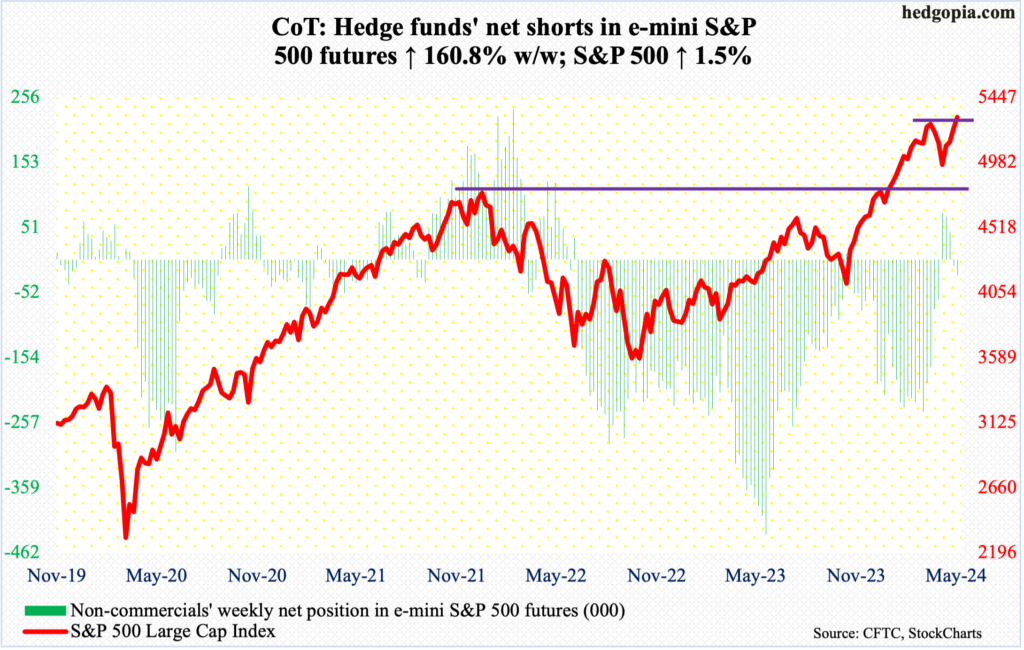
The S&P 500 continued to press higher, up 1.5 percent this week to 5303, having tagged 5325 intraday Thursday. This was the fourth consecutive weekly rise, with the large cap index having bottomed at 4954 on April 19th.
Importantly, equity bulls on Wednesday decisively broke out of 5260s. The S&P 500 peaked on March 28th at 5265. Bears’ small consolation is that how Thursday when the new high was made traded, with the index closing slightly lower with a shooting star. This was followed by Friday’s potentially bearish dragonfly doji/hanging man, but this needs confirmation early next week.
In the event the index comes under pressure, breakout retest at 5260s is key.
Euro: Currently net long 17.2k, up 12.6k.
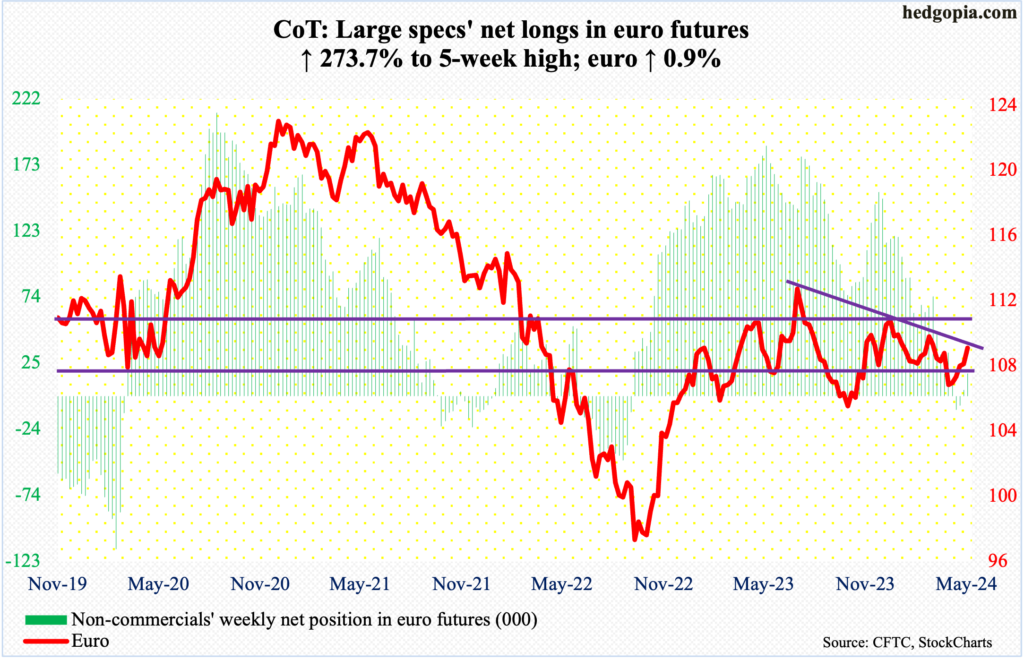
The euro rallied another 0.9 percent this week to $1.0869 to clear trendline resistance from last December when the currency reversed after tagging $1.1125. It has been rallying since bottoming at $1.0601 on April 16th.
With this, the euro has reached a crucial stage. Wednesday’s high of $1.0886 just about kissed trendline resistance from last July when the euro tagged $1.1270. Concurrently, a rising trend line from last October draws to just north of $1.06. The resulting pennant – whichever way it breaks – will decide the next major trend.
Gold: Currently net long 204.5k, up 4.9k.
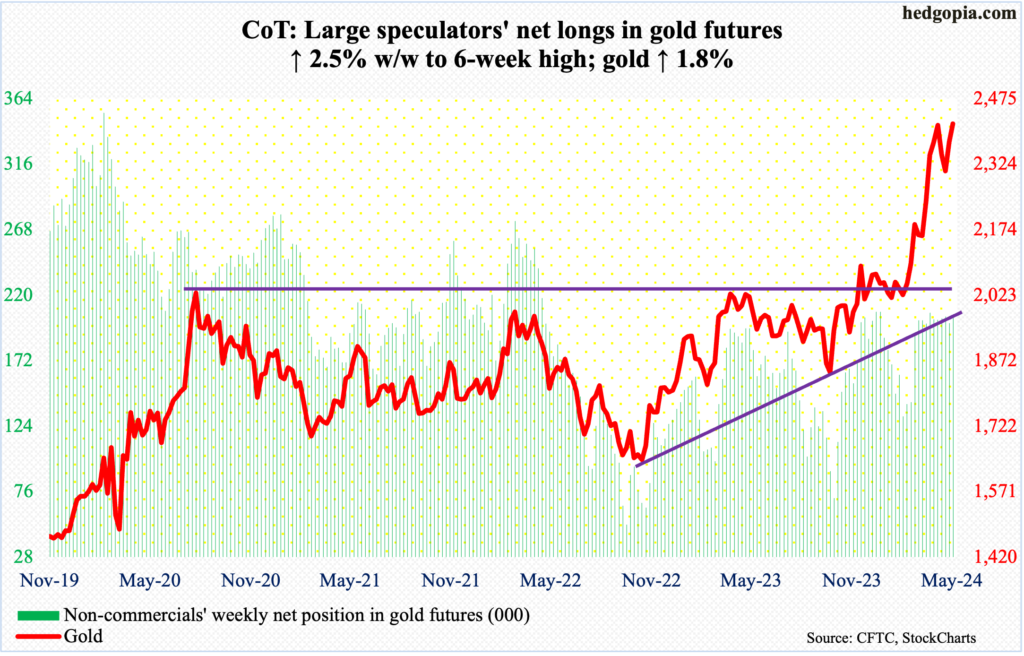
Gold rallied for a second week in a row, up 1.8 percent this week. The mettle has been rallying since May 3rd when it ticked $2,285 intraday. As a matter of fact, this week represents a new closing high of $2,417 – just ahead of $2,414 recorded four weeks prior. Back then, gold had just printed a new intraday high of $2,449, which occurred on April 12th, but the session reversed hard to close at $2,361.
Kudos to gold bugs for having rallied the metal back to those highs. The action after that high lasting five weeks now qualifies for sideways congestion, giving the bulls another opportunity to break out.
Nasdaq (mini): Currently net long 3.2k, down 1.2k.
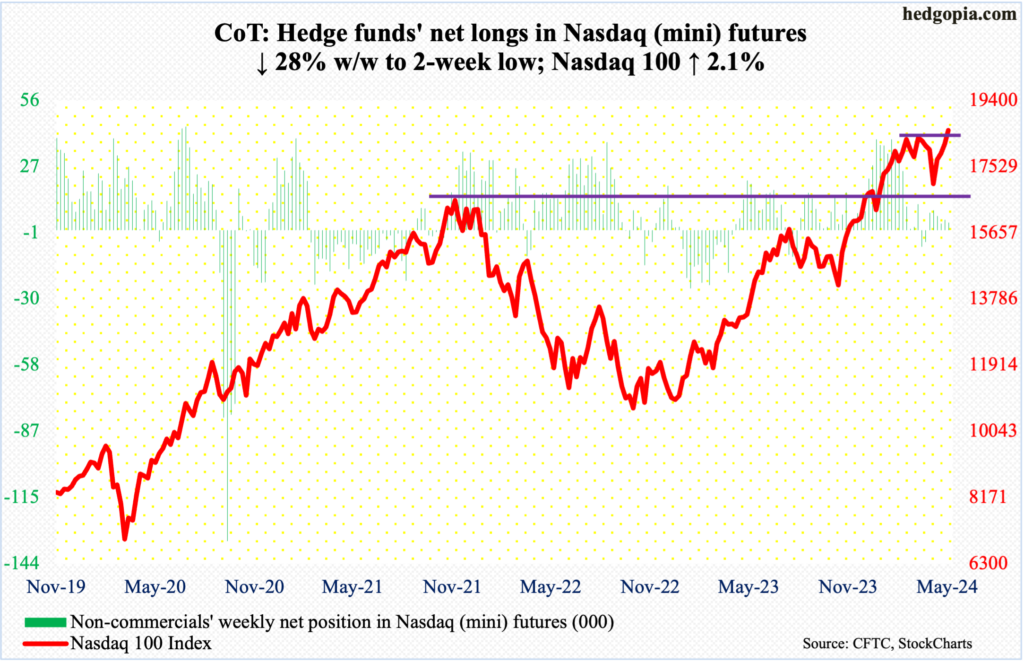
The Nasdaq 100 peaked at 18465 on March 21st, failing to sustainably break out of 18300s for seven weeks before rolling over; from that high through last month’s low, it swiftly gave back 8.1 percent. All of this loss has now been recovered – and then some.
This week, the tech-heavy index added 2.1 percent to 18546, with a new intraday high of 18670 on Thursday, when the index reversed slightly lower ending with a shooting star. This was followed by Friday’s potentially bearish hanging man. These candles need confirmation early next week.
In the event downward pressure develops in the sessions ahead, 18300s is the one to watch. On Wednesday, when the index rallied strongly post-CPI report for April, intra-session weakness was bought at that level – 18359, to be exact.
Russell 2000 mini-index: Currently net short 32.1k, down 5.9k.
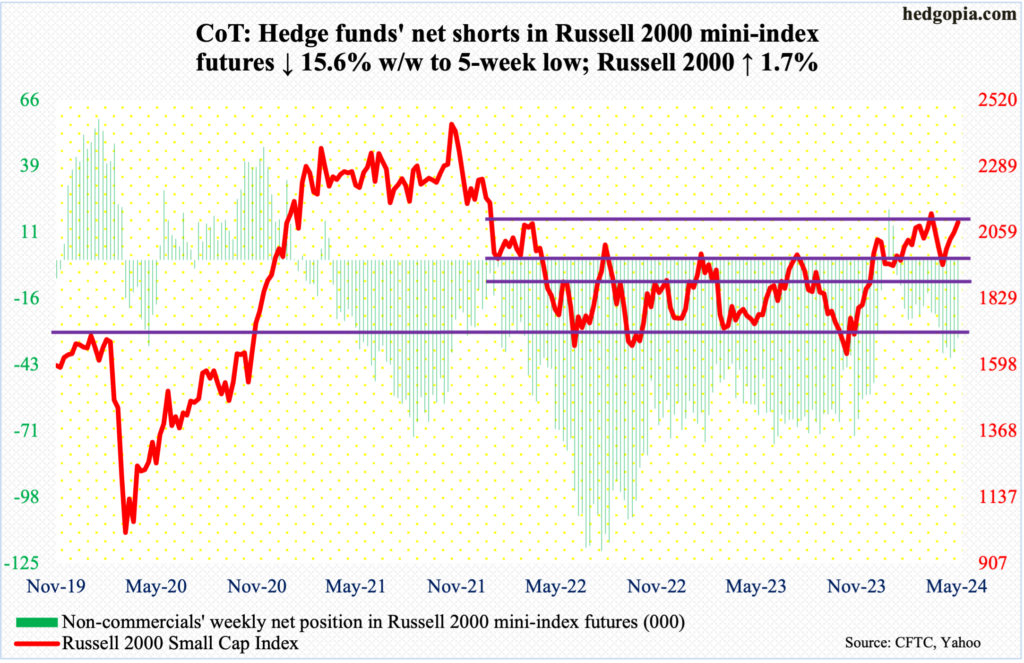
On Wednesday through Friday, the Russell 2000 (2096) rallied north of 2100 in each session intraday but closed the week just shy of that level. For over two months now, the small cap index has failed to decisively clear 2100, which is important.
The index peaked in November 2021 at 2459, subsequently reaching 1641 in June 2022, which was successfully tested in October of both 2022 and 2023. A 61.8-percent Fibonacci retracement of that drop lies at 2144. The index lost 2100 in January 2022 and has since struggled at that price point; 2100 also represents a measured-move price target post-breakout at 1900 last December. Before that, the index went back and forth between 1700 and 1900 going back to January 2022.
Inability to reclaim 2100 opens the door toward 2000 at best and 1900 at worse.
US Dollar Index: Currently net long 2.4k, up 582.
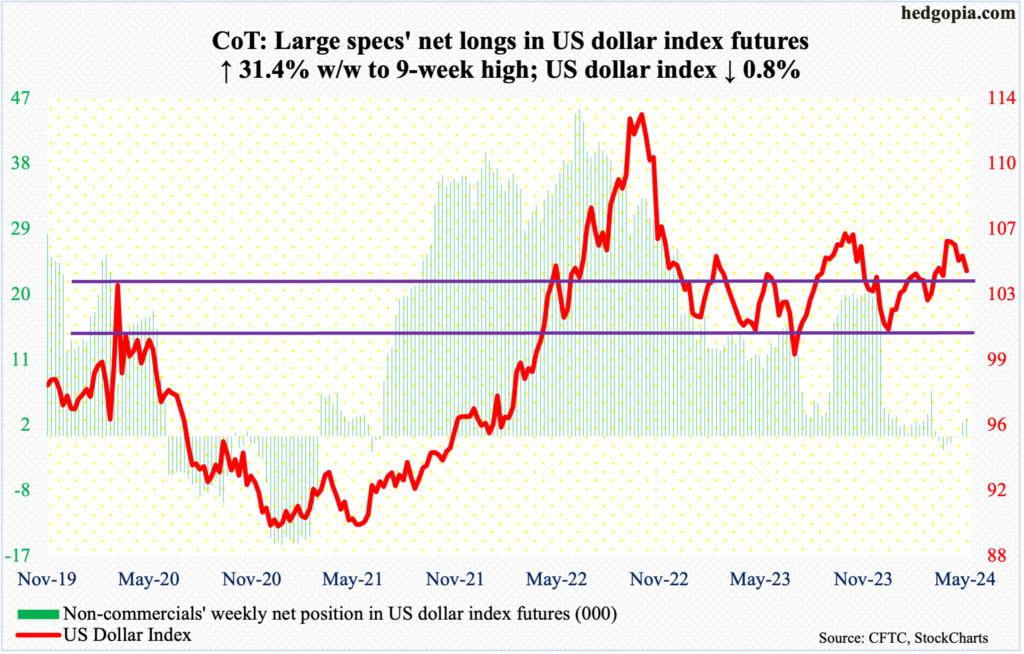
The US dollar index dropped to 103.97 on Thursday, successfully testing a rising trendline from last December when it bottomed at 100.32. It closed the week down 0.8 percent to 104.33. Horizontal support at 103-104 also goes back to December 2016.
A breach of this support is probably just a matter of time. The daily is oversold, and a rally can ensue should dollar bulls succeed in rallying past the 200- and 50-day (104.19 and 104.65 respectively).
VIX: Currently net short 48.1k, up 9.2k.
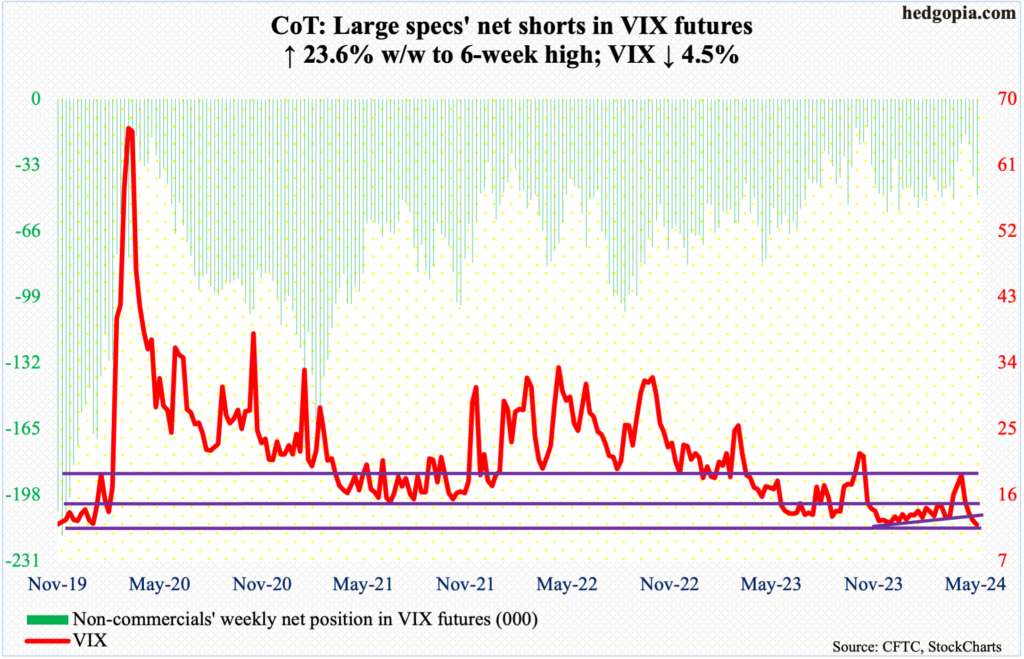
With a weekly close of 11.99, VIX is dangerously close to a further breakdown. The volatility index has come under pressure since tagging 21.36 on April 19th. This week’s sub-12 close is the first since September 2018.
For the most part, volatility bulls have defended 12 the past six years. As low as the odds are right here and now, it will be yet another victory for equity bulls should 12 gets meaningfully breached.
Thanks for reading!

