Following futures positions of non-commercials are as of August 13, 2024.
10-year note: Currently net short 860.2k, up 84k.
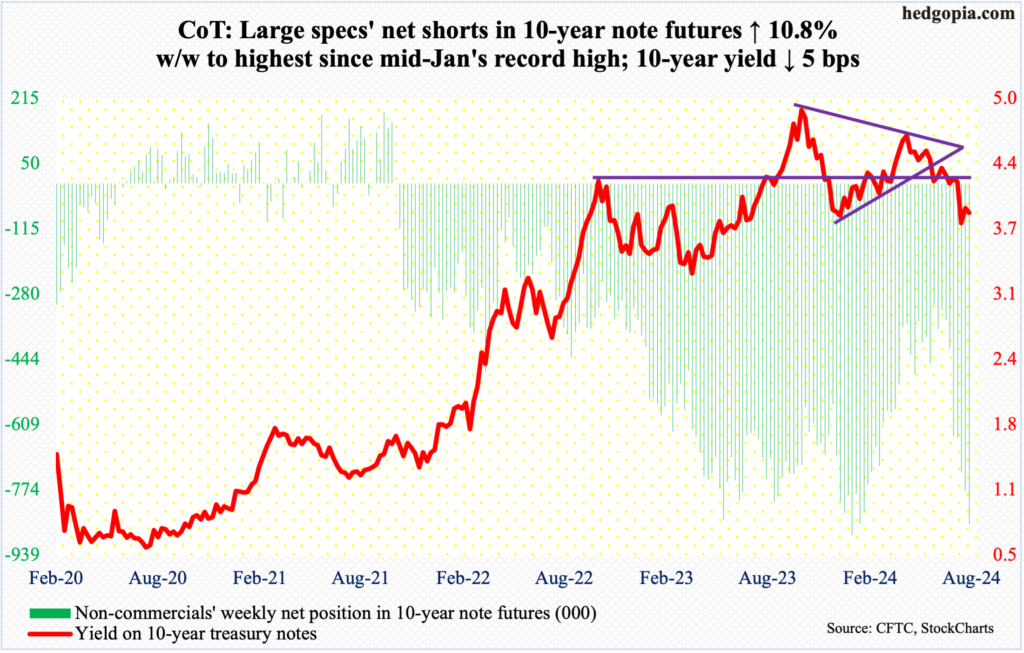
FOMC minutes for the July (30-31) meeting will come out Wednesday. The Federal Reserve held the fed funds rate steady at a range of 525 basis points to 550 basis points in that meeting. The benchmark rates have been left there since July last year. Earlier, the central bank began to tighten from zero to 25 basis points in March 2022.
Nothing earth-shattering is expected to come out of these minutes. There were enough hints in last month’s meeting that the Fed was comfortable lowering rates in the September (17-18) meeting. At first, markets expected a 25-basis-point cut, which then went to 50 post-July jobs report; expectations are now back to 25.
That said, futures traders have their money on 100 basis points of cuts for 2024. There are two meetings left after September – November (6-7) and December (17-18) – suggesting a 50 in one of those two meetings and a 25 in another. On this, these traders may be a little too optimistic (for reference, late last year-early this year, they had priced in up to seven 25-basis-point cuts for this year). These expectations are likely to be reined in after Jerome Powell delivers his speech (17-18) on Friday at the annual Jackson Hole Symposium.
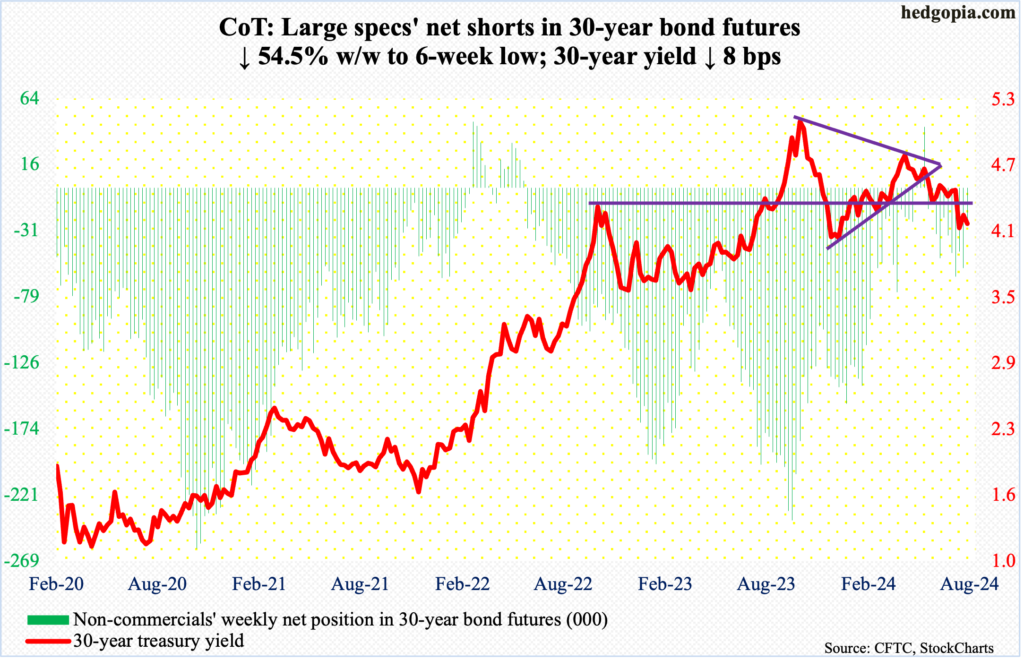
30-year bond: Currently net short 26.3k, down 31.5k.
Major US economic releases for next week are as follows.
Existing home sales (July) are scheduled for release on Tuesday. June sales declined 5.4 percent month-over-month to a seasonally adjusted annual rate of 3.89 million units – a six-month low.
New home sales (July) will be released Thursday. In June, sales fell 0.6 percent m/m to 617,000 units (SAAR). This was a seven-month low.
WTI crude oil: Currently net long 239.6k, up 31k.
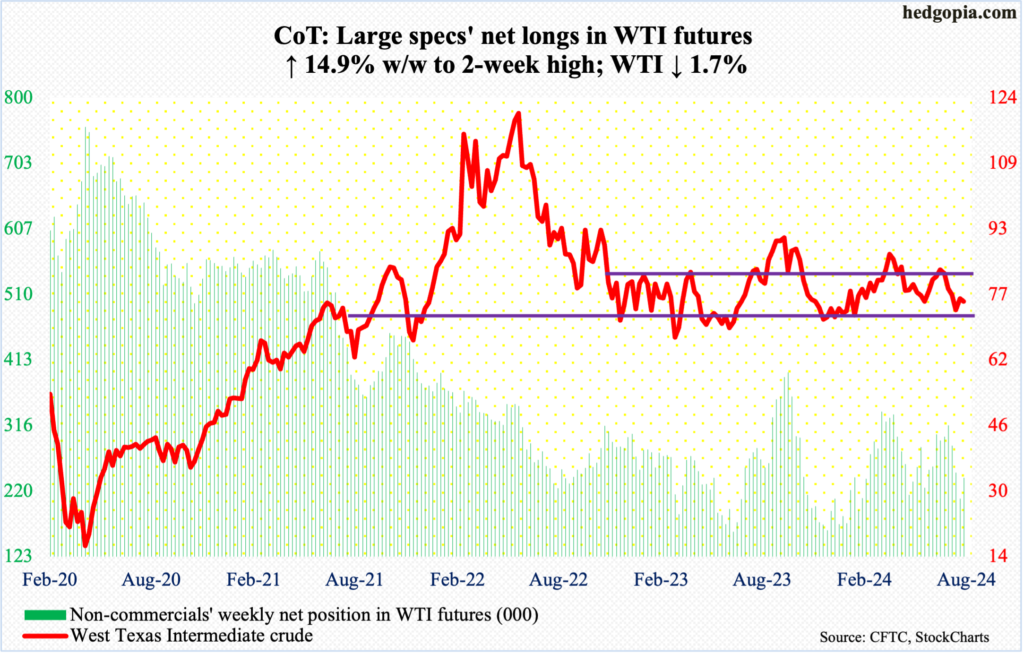
On the 5th this month, West Texas Intermediate crude bottomed at $71.67 intraday. A week later – this Monday – it hit $80.16 and headed lower, closing the week down 1.7 percent to $75.54/barrel.
For months, WTI has been rangebound between $71-$72 and $81-$82. This range is intact.
The August 5th low also successfully tested a rising trendline from May last year when the crude bottomed at $63.57. Above, trendline resistance from last September lies around $83; bears showed up at that trendline last month when the crude hit $84.52.
For now, the path of least resistance is down.
In the meantime, US crude production in the week to August 9th declined 100,000 barrels per day week-over-week from a record 14.4 million b/d. Crude imports increased 61,000 b/d to 6.3 mb/d. As did crude inventory, which grew 1.4 million barrels to 430.7 million barrels. Stocks of gasoline and distillates, however, dropped 2.9 million barrels and 1.7 million barrels respectively to 222.2 million barrels and 126.1 million barrels. Refinery utilization rose one percentage point to 91.5 percent.
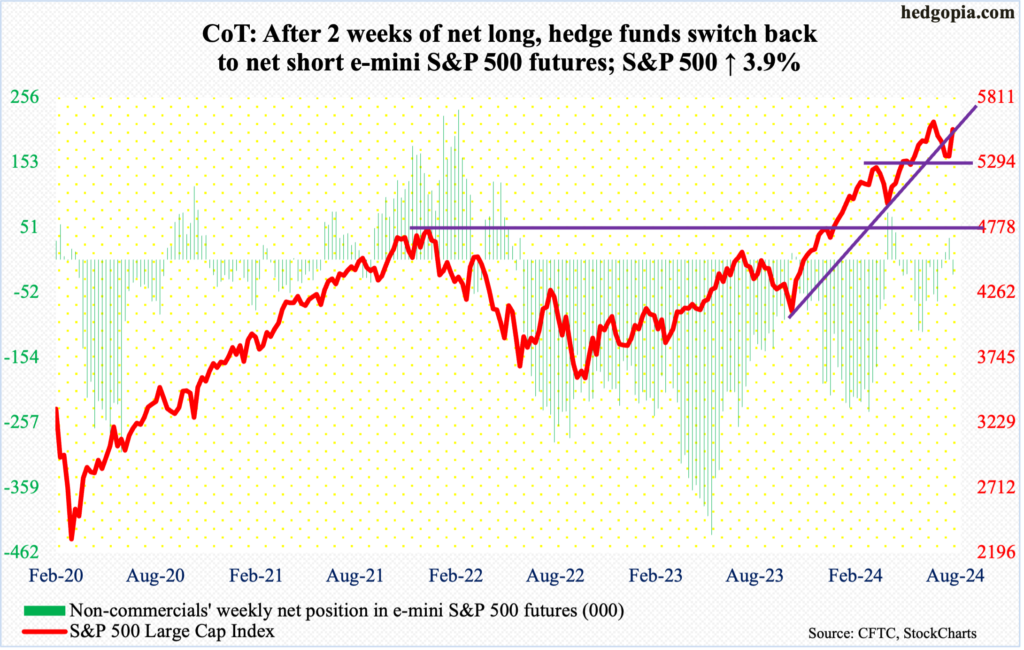
E-mini S&P 500: Currently net short 23.5k, up 57.4k.
Equity bulls picked up where they left off last week.
From the July 16th high to the August 5th low, the S&P 500 gave back 9.7 percent. Last week, through the 5th low of 5119, the large cap index was down 4.3 percent but recovered to end the week essentially unchanged. Momentum continued this week, as the index gained 3.9 percent to 5554. It is now merely 2.1 percent from last month’s record high 5670.
As things stand, odds favor the bulls more than the bears.
Euro: Currently net long 27k, down 6.6k.
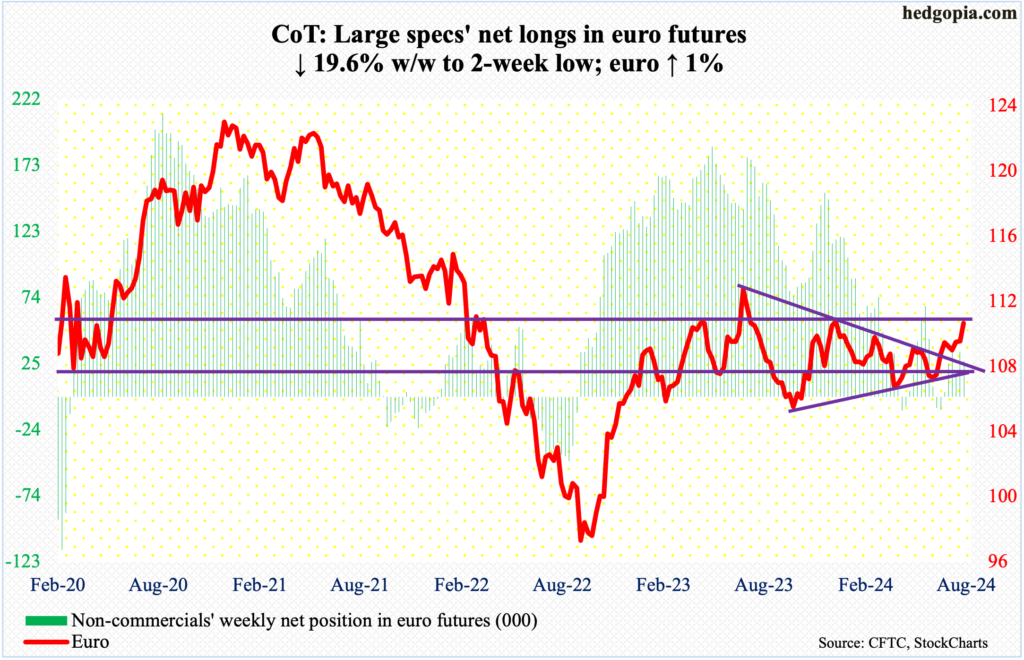
Last Monday’s intraday high of $1.101 would have been enough for the euro to break out of a symmetrical triangle it is in, but the bulls were unable to hang on to it. They achieved the feat this week, as the currency rallied one percent to $1.1027. The upper trendline in that triangle goes back to July last year when the euro topped at $1.128; trendline support is from last October when the euro bottomed at $1.045.
This week’s breakout swings the odds to the bulls’ favor. That said, they do face a hurdle at $1.10, which they have been unable to sustainably reclaim since February last year. A breakout here will be major.
Gold: Currently net long 267.3k, up 28.5k.
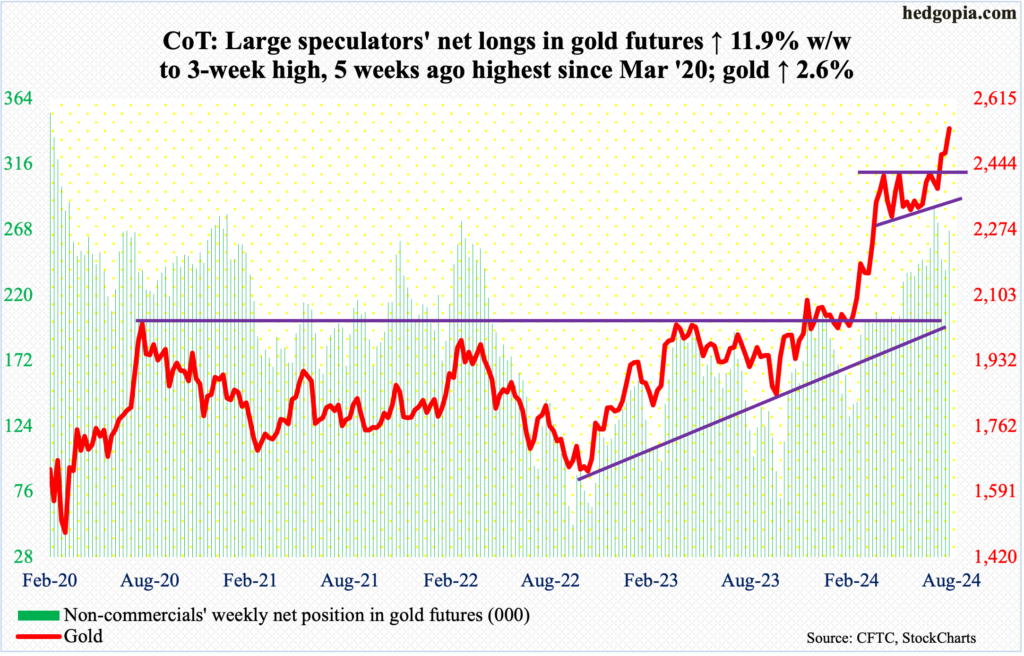
Gold rallied 2.6 percent this week to a new closing high of $2,538/ounce, with an intraday high of $2,548.
Earlier, the metal went sideways at $2,440s-50s for more than three months before breaking out early this month. As long as gold bugs are able to defend this level, the ball remains in their court.
Nasdaq (mini): Currently net long 8.5k, down 4.1k.
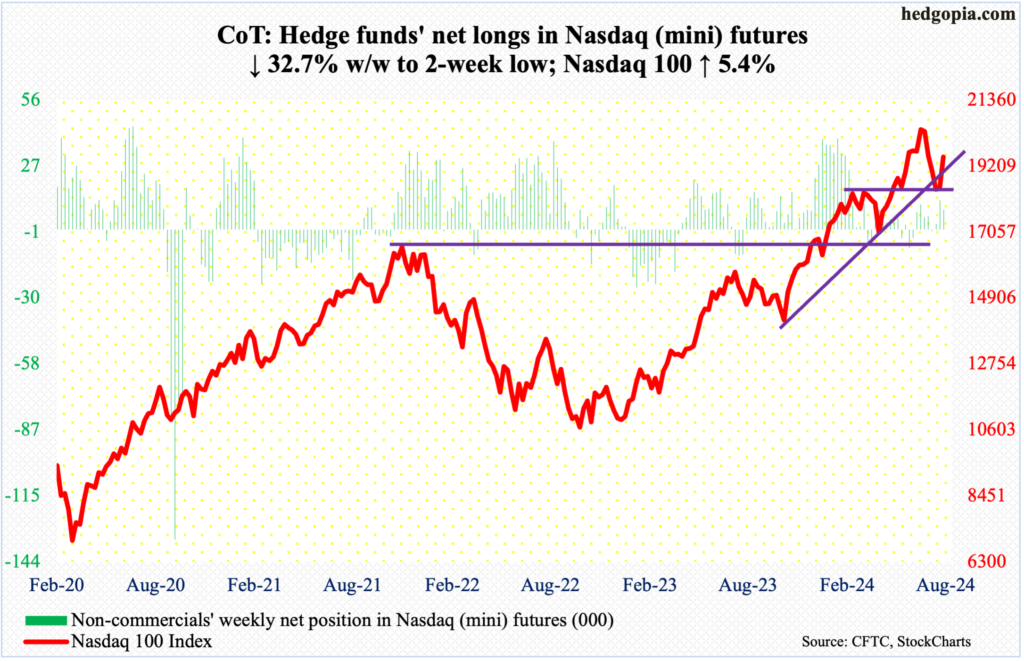
After four consecutive negative weeks, the Nasdaq 100 managed a back-to-back positive week. This week, it jumped 5.4 percent to 19509. Last week, the tech-heavy index was only up 0.4 percent but considering that it was down 5.5 percent intraday at the lows of Monday (August 5th), bulls must be satisfied how the week turned out.
From high (20691, July 10th) to low (17435, August 5th), the Nasdaq 100 was down 15.7 percent, a substantial portion of which has been recouped. The index is currently 6.1 percent from its record high.
As things stand, the July 24th gap gets filled at 19700s, followed by another gap fill from July 17th at 20200s.
Russell 2000 mini-index: Currently net short 13.3k, up 10.7k.
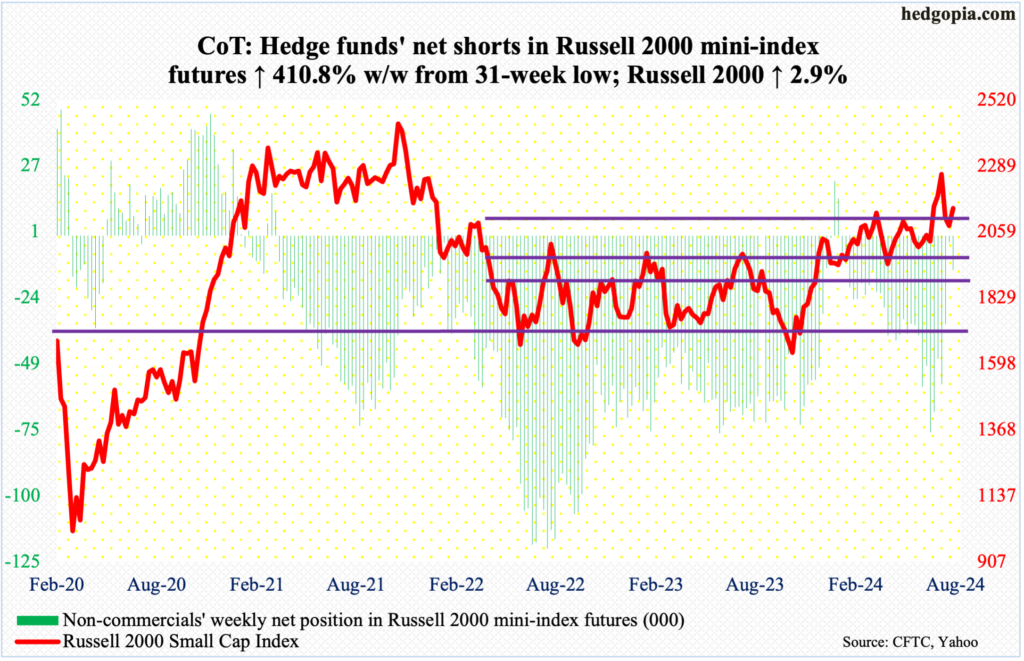
The prevailing bullish narrative is that the economy is holding up and there are rate cuts ahead. In this environment, one would imagine small-caps would outperform, but the Russell 2000 was up 2.9 percent for the week – weaker than its large-cap peers.
From small-cap bulls’ perspective, the good thing is that the Russell 2000 ended above 2100, which has proven to be an important level for bulls and bears alike.
The small cap index has had trouble at 2100 going back to early March. Plus, 2144 represents a 61.8-percent Fibonacci retracement of the drop between the November 2021 peak (2459) and the June 2022 trough (1641); 2100 also represents a measured-move price target post-breakout at 1900 last December, as the index was trapped between 1700 and 1900 going back to January 2022.
As of Tuesday, after reducing net shorts in Russell 2000 mini-index futures to a 31-week low in the prior week, non-commercials added in the latest week. Granted it is only one week, but these traders are probably not holding their breath about the cash being able to take out resistance at 2260s, which attracted selling several times in the second half last month.
US Dollar Index: Currently net long 18.5k, up 2.4k.
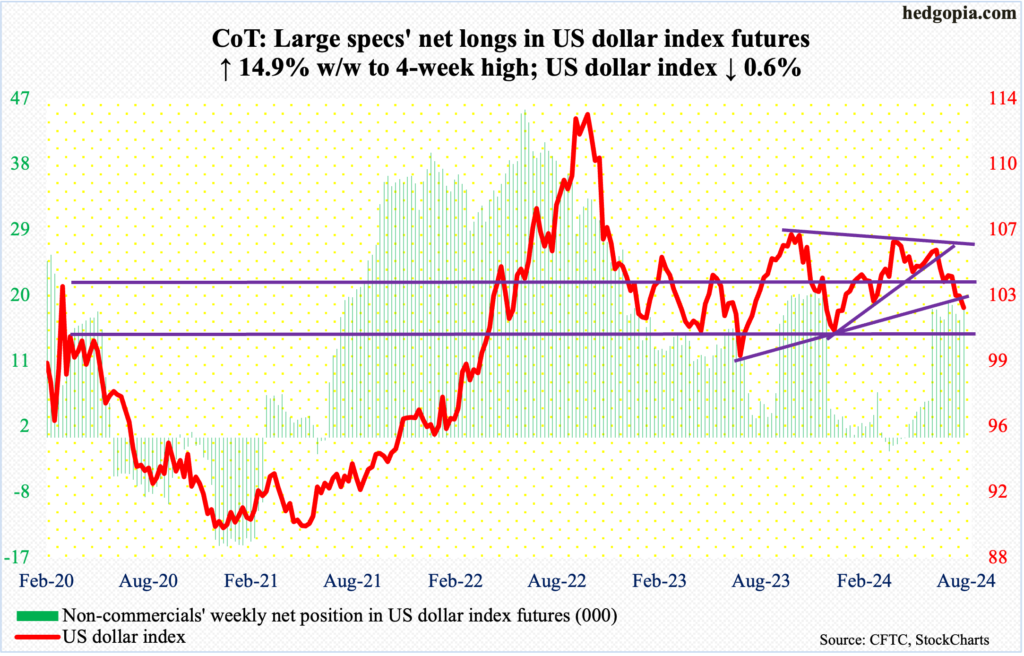
It is a make-or-break for dollar bulls. The US dollar index lost 0.6 percent this week to 102.31, essentially on trendline support (using intraday prices) from July last year when it bottomed at 99.22.
Seven-eight weeks ago, the bulls were denied at a falling trendline from last October when it peaked at 107.05. Six weeks ago, the index fell out of a symmetrical triangle consisting of a rising trendline from last December when it bottomed at 100.32. Hence the importance of the current trendline support.
The index already breached horizontal support at 103-104, which goes back to December 2016.
VIX: Currently net short 20.3k, down 23.3k.
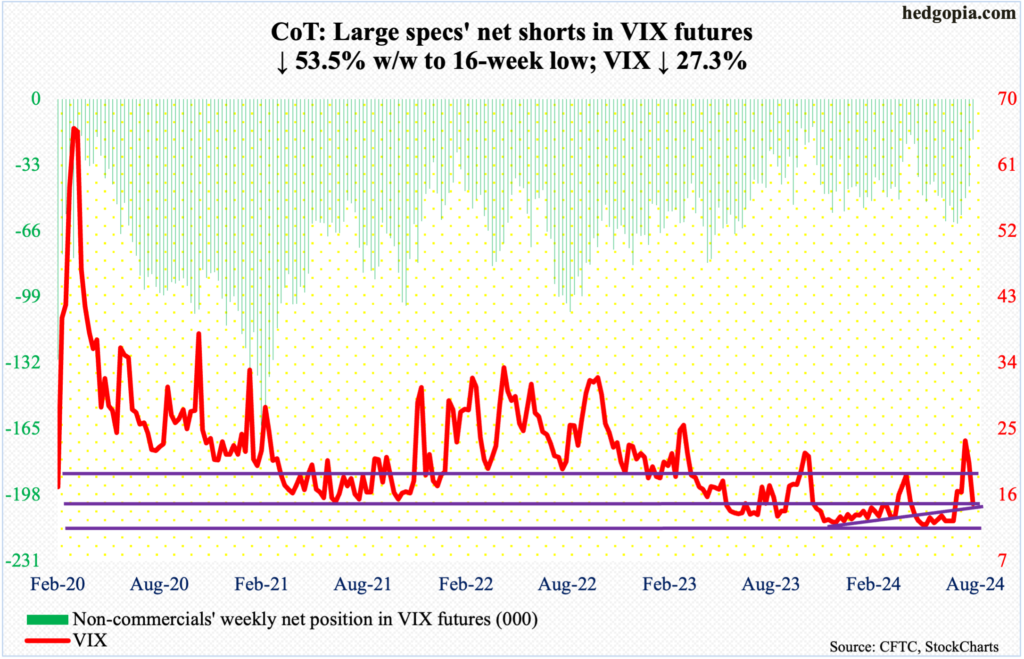
In 10 sessions, VIX collapsed from 65.73 (August 5th) to 14.65 intraday, with a weekly close of 14.80. Unreal!
This brings the volatility index to right between the 50- and 200-day moving averages (15.71 and 14.36 respectively), a breach of which raises the odds VIX likely gravitates toward 11-12, which is where it persistently found support for months.
Thanks for reading!

