Following futures positions of non-commercials are as of August 27, 2024.
10-year note: Currently net short 914.4k, down 123.7k.
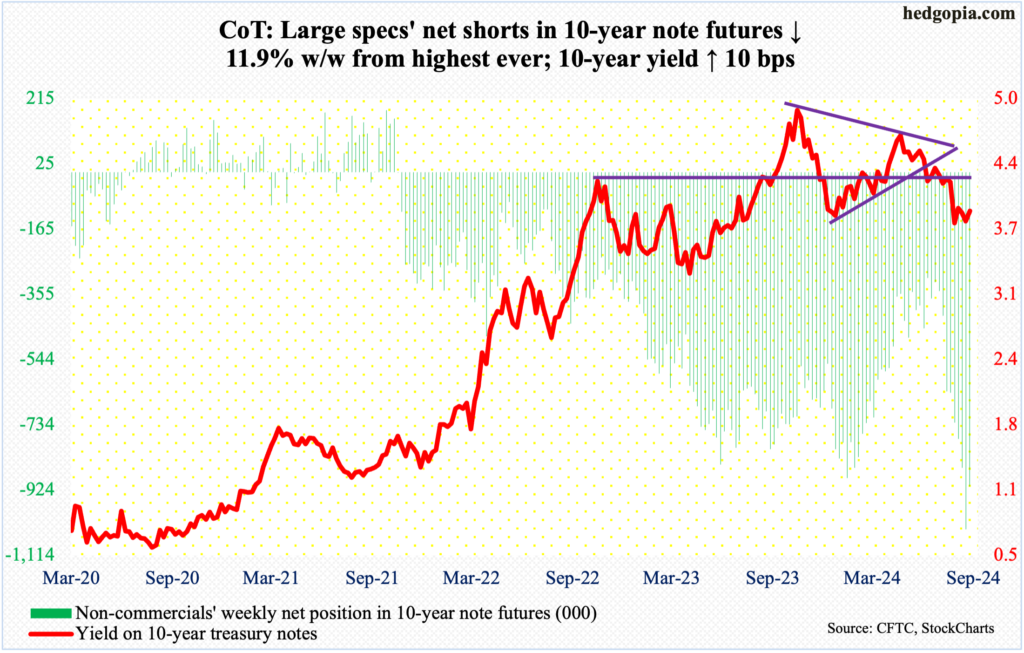
Fed funds futures traders continue to raise rate-cutting bets. Until last week, they expected 100 basis points of cuts in the three remaining meetings this year and 100 more in the eight scheduled meetings next year. This week, they are staying with 100 basis points this year, which would also mean a 50-basis-point cut in either November or December, but for next year they now expect five 25-basis-point reductions. Granted they do not have an enviable record, as late last year-early this year they were pricing in six or seven 25-basis-point cuts this year. Nevertheless, for them to be expecting the Federal Reserve to loosen by 225 basis points between next month’s meeting and December next year, they ought to be pretty bearish on the economic outlook.
Since July last year, the fed funds rate has been left unchanged at a range of 525 basis points to 550 basis points. Earlier, the Fed began to tighten from zero to 25 basis points in March 2022. The policymakers are expected to begin cutting in next month’s meeting. How long the easing cycle will last – both duration and magnitude – will depend on a whole host of factors, not the least of which are matters relating to employment and inflation.
Right here and now, both the equity and bond markets are in disagreement with the fed funds futures traders. Equities are at/near last month’s record highs, even as non-commercials are sitting just underneath their record holdings of net shorts in 10-year-note futures. Incidentally, the beginning of an easing cycle historically is not equity-friendly (more on this here).
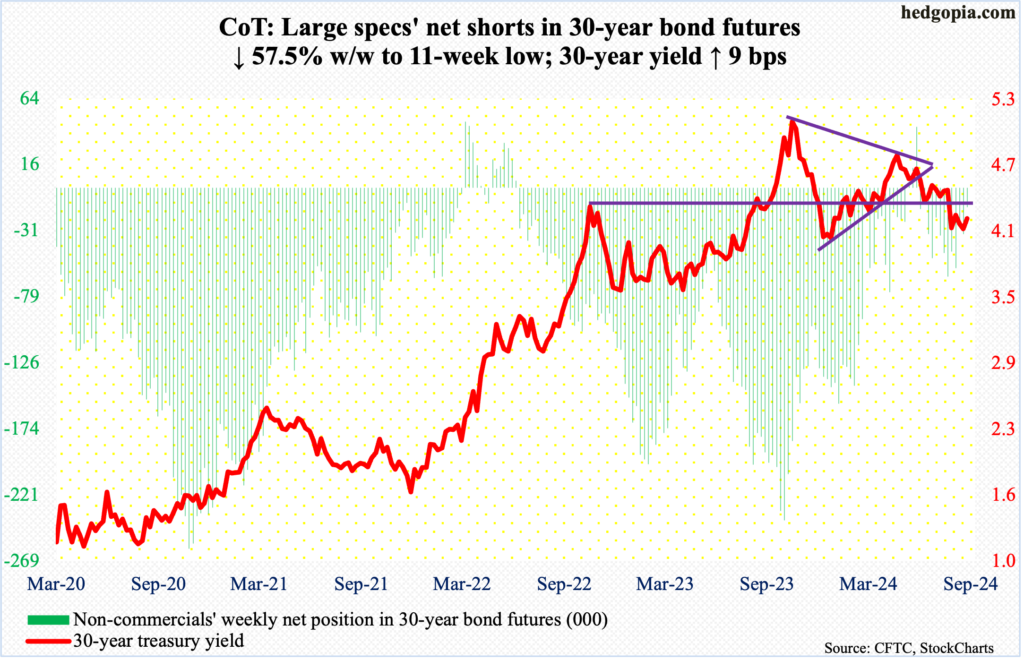
30-year bond: Currently net short 14.2k, down 19.3k.
Major US economic releases for next week are as follows. Markets are closed Monday for observance of Labor Day.
The ISM manufacturing index (August) is on schedule for Tuesday. In July, manufacturing activity decreased 1.7 percentage points month-over-month to 46.8 percent. This was the fourth consecutive month of contraction since March, when a 16-month streak of contraction was broken.
Wednesday brings job openings (July) and durable goods orders (July, revised).
Non-farm job openings in June declined 46,000 m/m to 8.2 million. Openings peaked at 12.2 million in March 2022 and hit 7.9 million – a 37-month low – this April.
Preliminarily, orders for non-defense capital goods ex-aircraft – proxy for business capex plans – inched lower 0.1 percent m/m to a seasonally adjusted annual rate of $73.6 billion. The series peaked last December at $74 billion.
Labor productivity (2Q24, revised) and the ISM services index (August) are scheduled for release on Thursday.
Preliminarily, 2Q24 non-farm output per hour rose 2.7 percent from a year ago. This was the fourth quarter in a row of productivity growth with a two handle, with 1Q24 registering 2.9 percent.
July services activity grew 2.6 percentage points m/m to 51.4 percent – a two-month high.
Payrolls (August) are due out Friday. The economy added 114,000 non-farm jobs m/m in July. In the first seven months this year, an average 203,000 jobs were added. This was weaker than last year’s monthly average of 251,000, and 377,000 in 2022.
WTI crude oil: Currently net long 216.4k, down 3.6k.
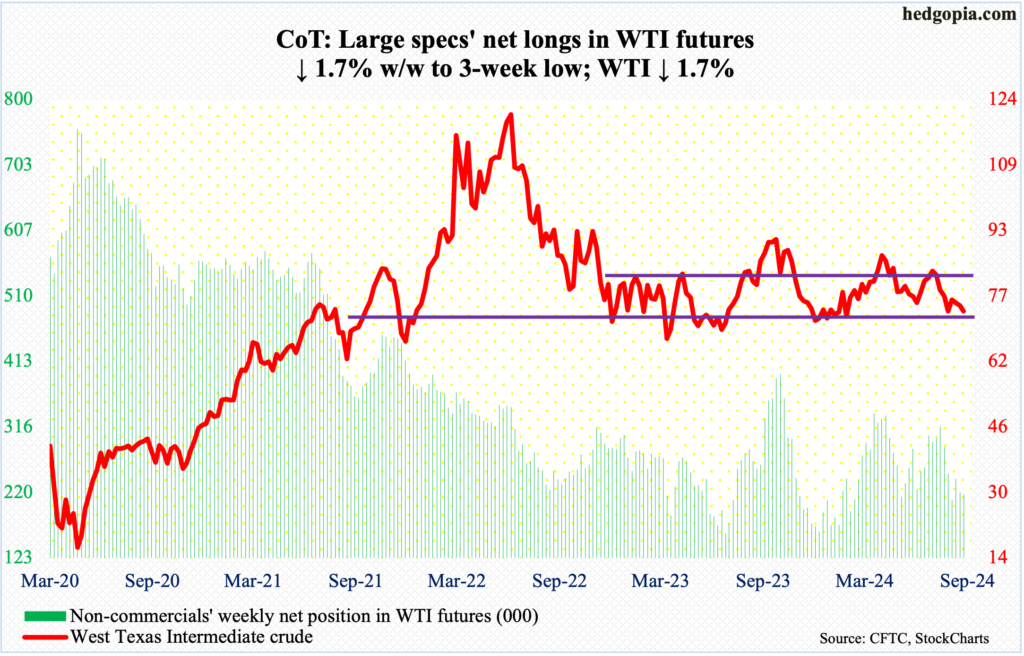
West Texas Intermediate crude began the week strong with a rise of 3.7 percent at Monday’s high, but sellers showed up just under the 200-day ($77.71), with the average once again attracting offers on Tuesday. In the end, the crude finished the week down 1.7 percent to $73.55/barrel.
Monday’s high $77.60 did not quite test the top end of a months-long range between $71-$72 and $81-$82. WTI just bounced off the bottom of the range in the prior week. Odds favor a test – again – of the support in the sessions ahead.
In the meantime, US crude production in the week to August 23rd decreased 100,000 barrels per day from the prior week’s record output of 13.4 million b/d. Crude imports declined 92,000 b/d to 6.6 mb/d. As did stocks of crude and gasoline, which respectively fell 846,000 barrels and 2.2 million barrels to 425.2 million barrels and 218.4 million barrels. Distillate inventory, on the other hand, grew 275,000 barrels to 123.1 million barrels. Refinery utilization grew one percentage point to 93.3 percent.
E-mini S&P 500: Currently net short 81.9k, down 2.9k.
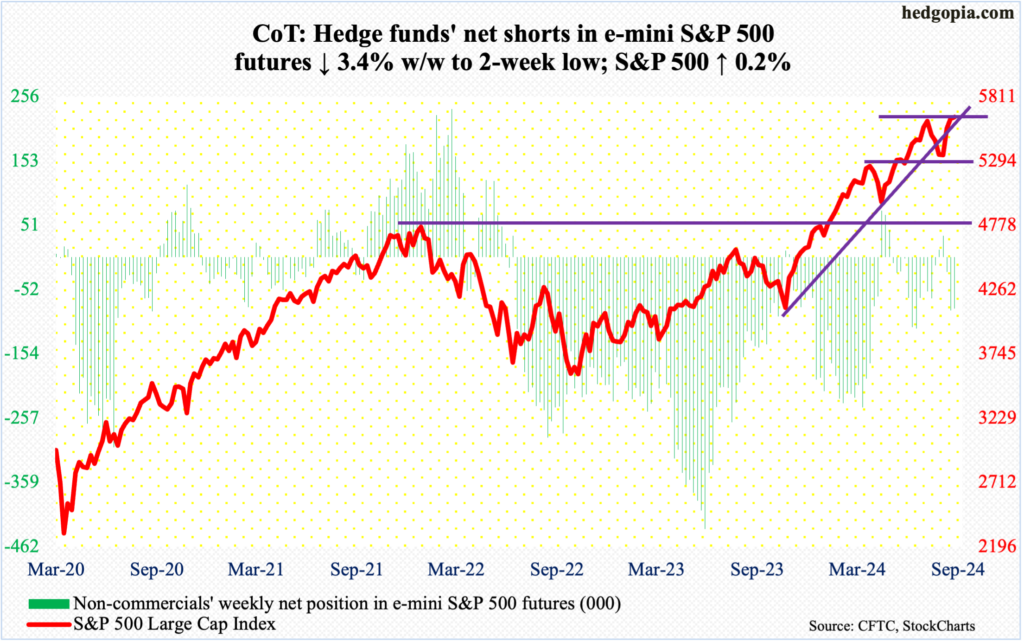
The week swung between weekly gains and losses, in the end favoring the bulls. The S&P 500 edged up 0.2 percent to 5648. At Wednesday’s low (5561), the large cap index was down as much as 1.3 percent. On the weekly, a dragonfly doji formed.
On the 16th last month (July), the index peaked at 5670, which is now merely 22 points away. A test is all but certain. The S&P 500 has essentially gone sideways at 5640s the last seven sessions, and a breakout looks imminent. More important is what follows once this resistance gets taken out and the index proceeds toward the July peak.
Euro: Currently net long 92.8k, up 36.8k.
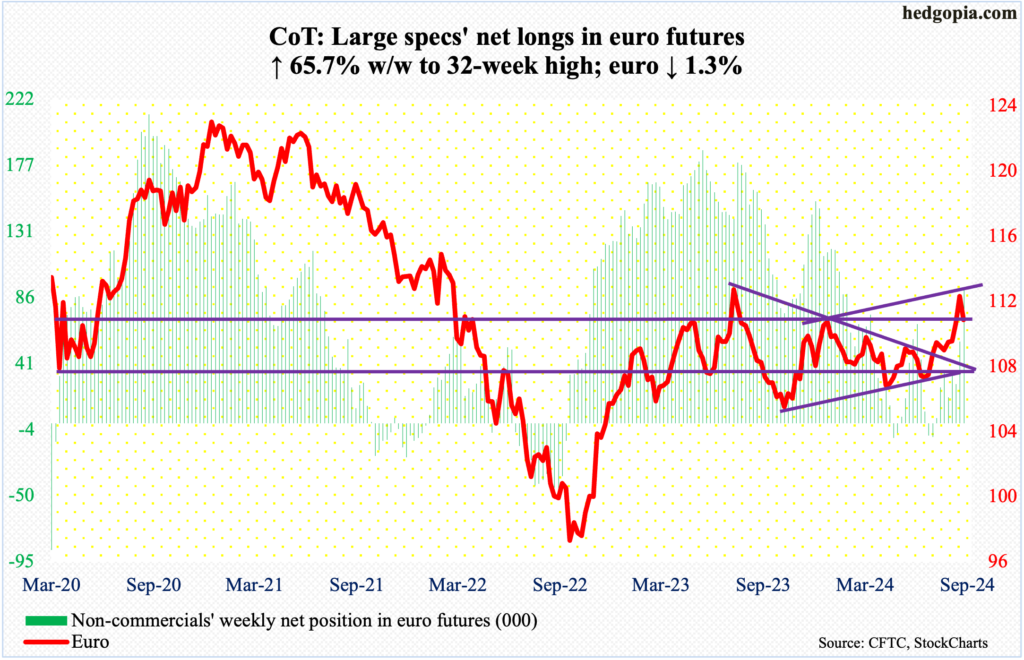
After enjoying its fourth consecutive up week, the euro on Monday surpassed last week’s high by a smidge – $1.1202 versus $1.1201 – before it ran out of steam. By Friday, it was down 1.3 percent for the week.
The currency closed last week right at channel (rising) resistance that goes back to last December. In the week before, it broke out of a symmetrical triangle – made up of an upper trendline that goes back to July last year when the euro topped at $1.128 and a lower trendline from last October when it bottomed at $1.045.
Last week, euro bulls also recaptured $1.10, which they had been unable to sustainably reclaim since February last year. No sooner did that breakout occur than it was being retested. The euro closed this week at $1.1048. This support likely yields in the sessions ahead. At $1.09 lies the upper trendline of the symmetrical triangle mentioned above, followed by the lower trendline at $1.07.
Gold: Currently net long 294.4k, up 3.2k.
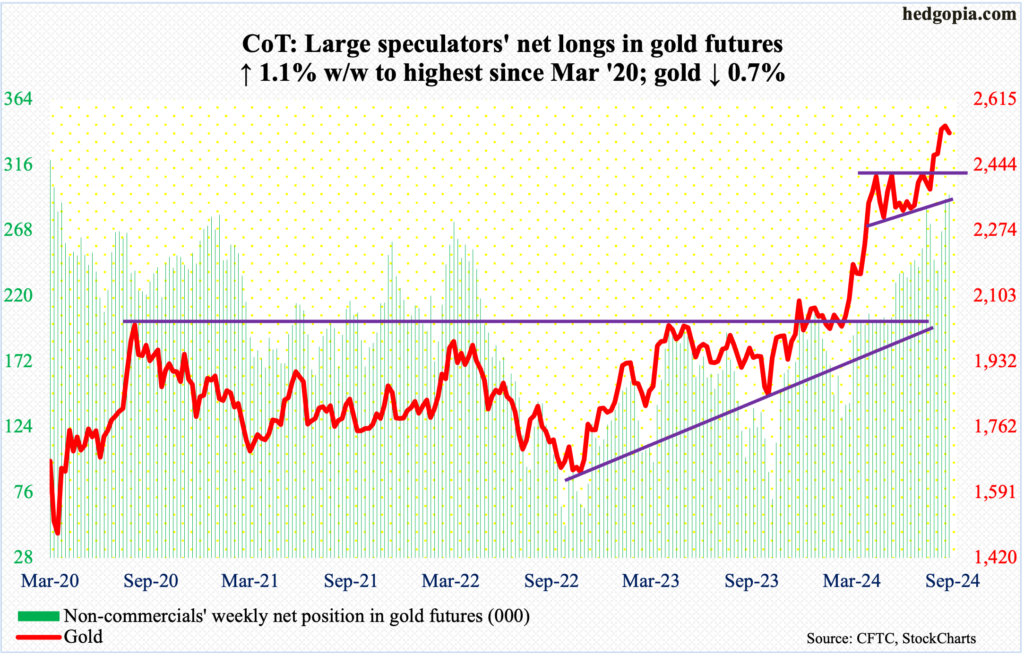
Going into this week, gold went sideways at $2,540s-50s for six sessions. This continued this week before suffering a 1.3-percent tumble on Friday, losing 0.7 percent for the week to $2,528/ounce. This preceded last week’s spinning top.
Earlier, the metal posted a fresh record of $2,570 on the 20th. Before that, it went sideways at $2,440s-50s for more than three months before breaking out early this month. It is probable the yellow metal is headed for a breakout retest. Non-commercials do not seem much worried about a breach; they are net long gold futures the most since March 2020.
Nasdaq (mini): Currently net long 21.4k, up 10.1k.
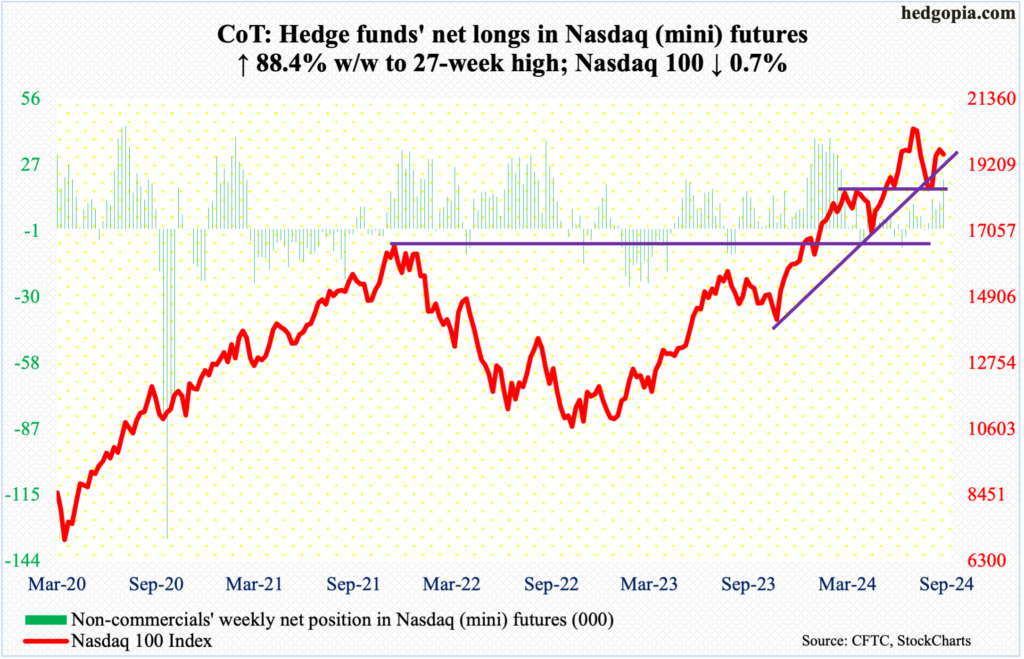
After three up weeks in a row post-August 5th trough, the Nasdaq 100 gave back 0.7 percent to 19575 this week. That said, the tech-heavy index was down as much as 2.5 percent at Wednesday’s low, so bulls deserve kudos for buying the weakness.
Nonetheless, tech is no longer leading. The sector was not giving out good vibes heading into this week’s July-quarter results from Nvidia (NVDA), which disappointed.
If there is any consolation in how the index traded this week, it is that the daily RSI just turned up at the median; the last time the metric hit 70s was last month when it was peaking, with the index recording 20691 on the 10th. Tech bulls might argue this means there is room for positive momentum to build, although the fact remains that the rally from earlier this month ran out of steam sooner than, let us say, it did for the S&P 500.
Russell 2000 mini-index: Currently net short 15.3k, down 11.8k.
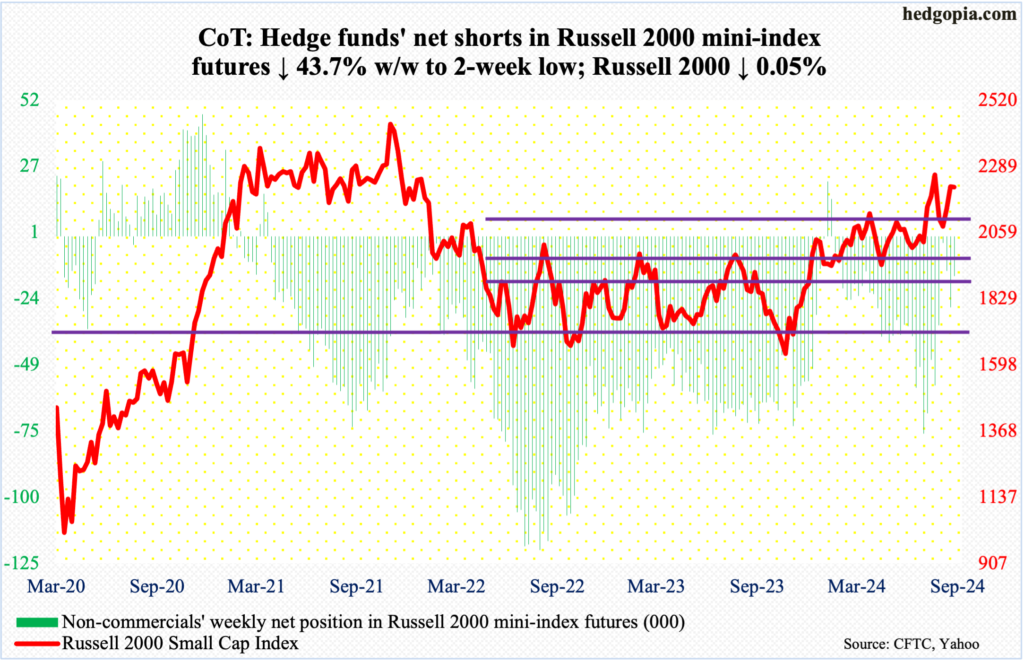
Small-caps joined their tech cousins in registering a down week. The Russell 2000 inched lower 0.05 percent to 2218. And, as was the case with tech, Wednesday’s low was bought, as the small cap index was down 1.7 percent for the week at that point.
In the event of a rally, what transpires at 2260s will be crucial. In the second half last month, there were several unsuccessful attempts at that price, including a run to 2300 on the 31st but only to end the session with a sharp reversal lower.
Earlier, the Russell 2000 broke out of 2100 on July 11th, reacting favorably to softer-than-expected CPI for June. This had been an important level for bulls and bears alike. After that, within merely 15 sessions of the 2100 breakout, the Russell 2000 added 200 points and retreated after ticking 2300 intraday.
The index has had trouble at 2100 going back to early March. To boot, 2144 represents a 61.8-percent Fibonacci retracement of the drop between the November 2021 peak (2459) and the June 2022 trough (1641); 2100 also represents a measured-move price target post-breakout at 1900 last December, as the index was trapped between 1700 and 1900 going back to January 2022.
US Dollar Index: Currently net long 18.9k, up 1.3k.
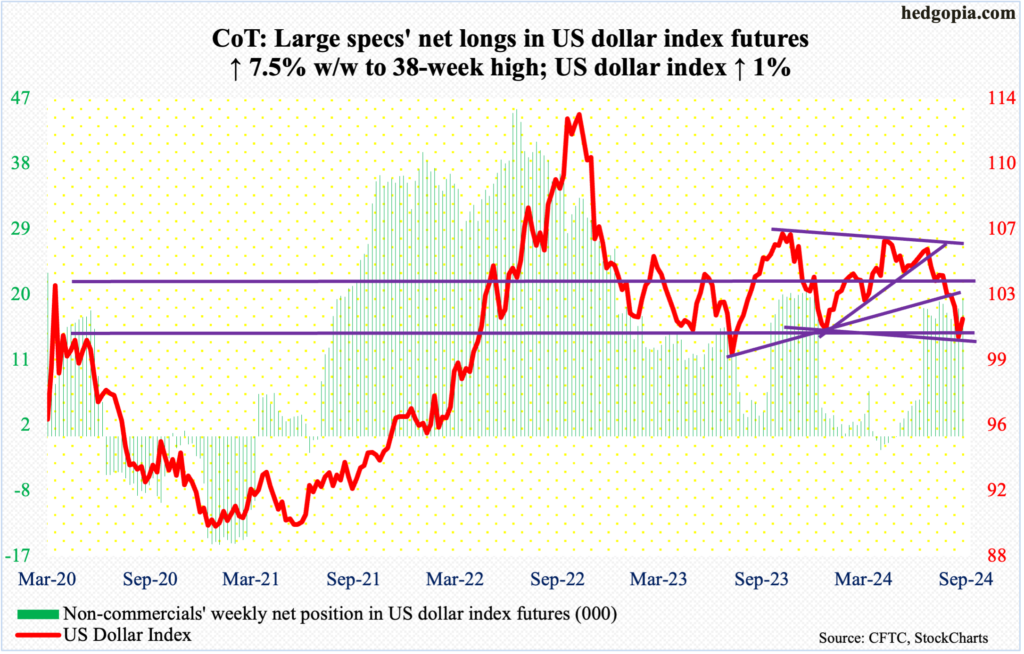
Dollar bulls have managed to defend horizontal support at 100-101, which goes back years. After 5 down weeks in succession – and seven out of eight – the US dollar index rallied one percent this week to 101.62. More gains probably lie ahead.
Previously, nine or 10 weeks ago, the bulls were denied at a falling trendline from last October when the index peaked at 107.05. Eight weeks ago, it fell out of a symmetrical triangle consisting of a rising trendline from last December when it bottomed at 100.32. Last week, it breached trendline support from July last year when it bottomed at 99.22.
The level to watch now is 103-104, which goes back to December 2016. The support was lost early this month.
VIX: Currently net short 30.5k, up 5.9k.
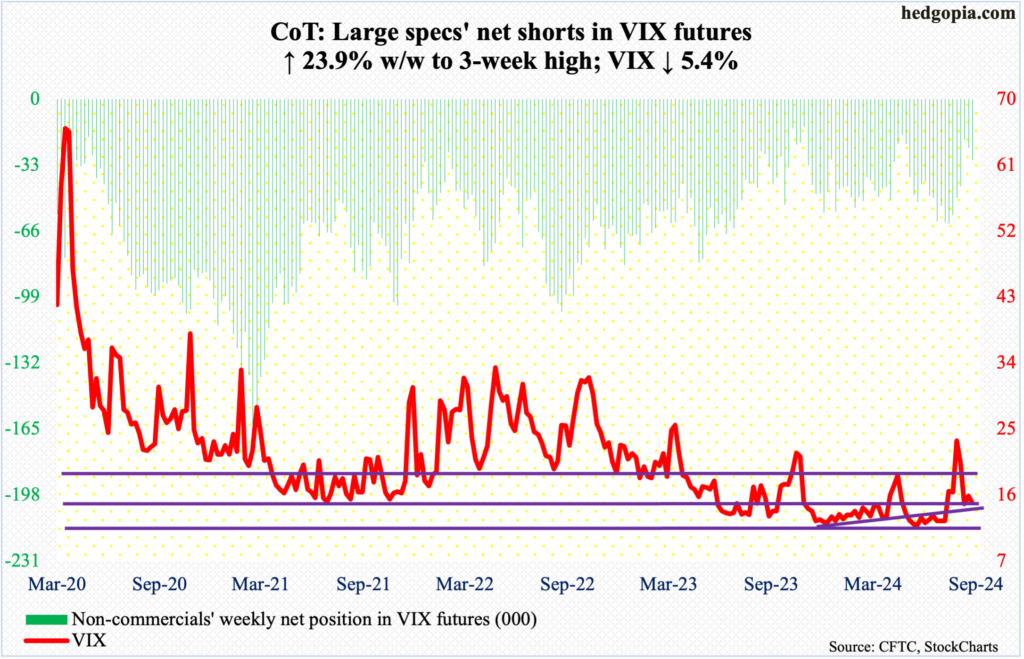
VIX is caught between the 50- and 200-day. In the last 12 sessions, the volatility index has tested but remained above the 200-day (14.39). Concurrently, it closed above the 50-day (16.40) in a couple of sessions but only to get pushed under right away.
This week, the daily RSI on Wednesday approached the median from underneath and retreated. Volatility lacks momentum. On August 5th, when VIX surged to north of 65, the metric hit mid- to high-80s; Friday, it was under 45.
If the volatility bears play their cards right, there is room for VIX to head lower – at least near term.
Thanks for reading!

