Following futures positions of non-commercials are as of October 22, 2024.
10-year note: Currently net short 848.2k, down 16.9k.
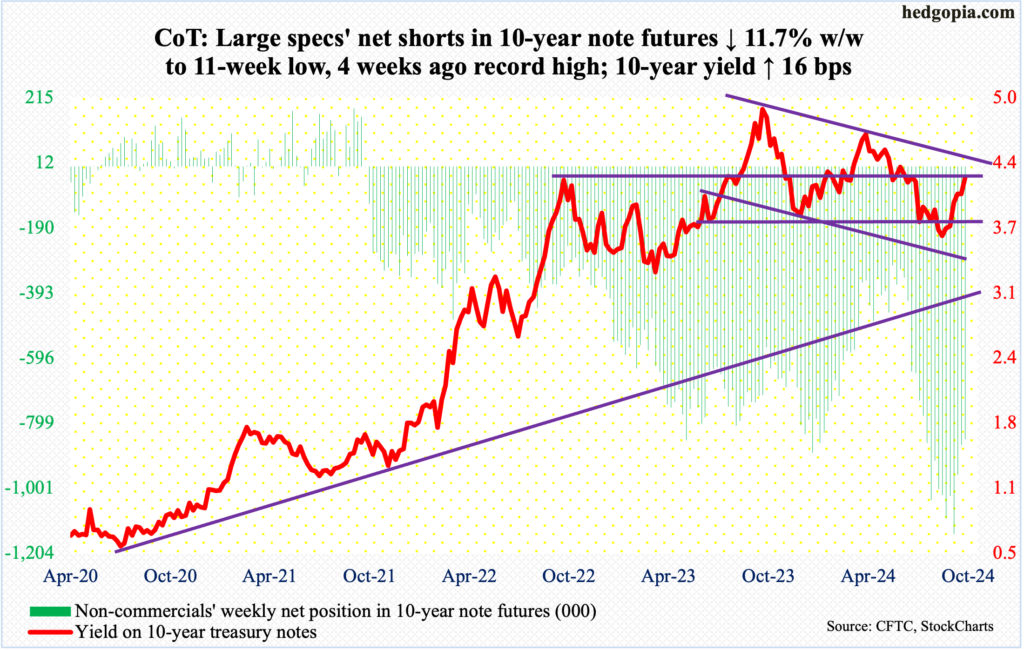
Non-commercials have reduced their net shorts in 10-year note futures by 25.9 percent from the week to October 1 when they were net short a record 1,143,889 contracts. They are locking in gains as yields have spiked.
The 10-year yield dropped to 3.6 percent on September 17, having peaked at five percent last October. This week, it rallied 16 basis points to 4.23 percent, ticking 4.26 percent intraday Wednesday.
This week’s high/close lands the 10-year right at horizontal resistance at 4.2-4.3s. This can pose resistance. At the same time, momentum is with the bears (on price, which moves inversely to yields).
The weekly has more room to rally. If the uptrend continues in this environment, there is trendline resistance from last October’s high at 4.4 percent. If the 10-year gets there, this is when these notes can seriously attract bidding, leading to lower rates.
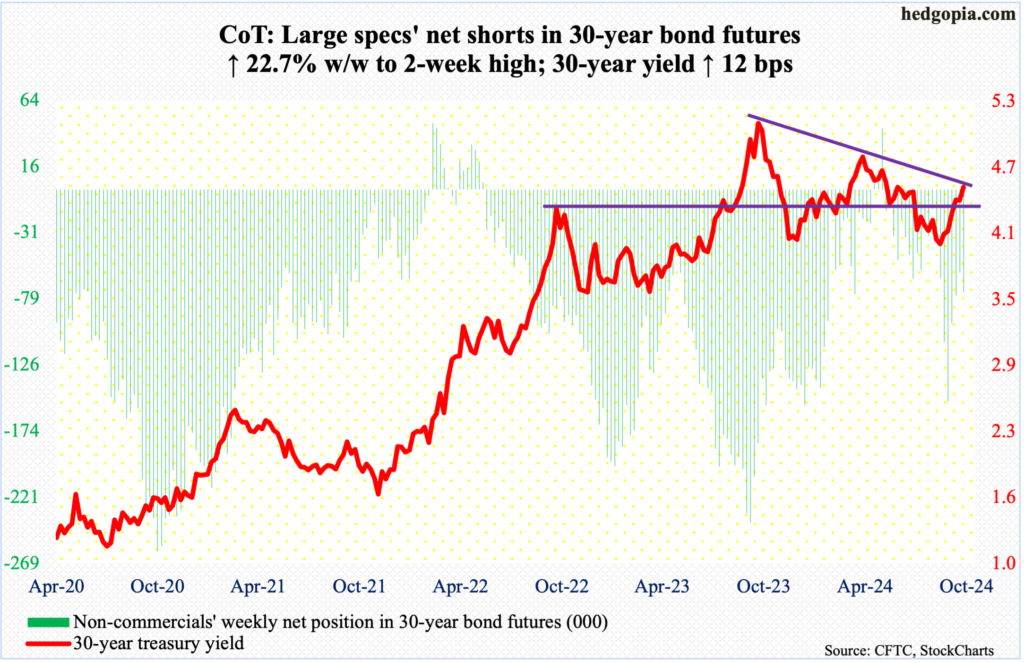
30-year bond: Currently net short 73.8k, up 13.7k.
Major US economic releases for next week are as follows.
The S&P Case-Shiller home price index (August) and JOLTs job openings (September) are on schedule for Tuesday.
Nationally in July, home prices rose five percent from a year ago. This was the slowest pace of annual appreciation in nine months.
August non-farm job openings increased 329,000 month-over-month to eight million. July’s 7.7 million was the lowest since January 2021. Openings reached an all-time high of 12.2 million in March 2022.
Wednesday brings GDP (3Q24, preliminary). In the June quarter, real GDP expanded at an annual rate of three percent. Barring a -1 percent reading in 1Q22, the economy has expanded since 3Q20.
Personal income/spending (September) and the employment cost index (3Q24) are due out Thursday.
In the 12 months to August, core PCE (personal consumption expenditures) – the Federal Reserve’s favorite – rose 2.68 percent. This was the fourth consecutive month of inflation at 2.6s. In February 2022, the metric peaked at a four-decade high of 5.65 percent.
Private-industry total comp increased 3.9 percent year-over-year in 2Q24. This was the first time in 12 quarters compensation grew with a three handle, with 2Q22’s 5.5 percent the highest since 2Q24.
On Friday, payrolls (October) and the ISM manufacturing index (October) will be reported.
September added 254,000 non-farm jobs, which was a six-month high. With nine months gone, this translates to the monthly average this year of 200,000, versus the average 251,000 in 2023, 377,000 in 2022 and 604,000 in 2021.
In September, manufacturing activity was flat m/m at 47.2 percent, which was the sixth consecutive reading of sub-50. Earlier, March’s 50.2 percent broke a 16-month streak of contraction.
WTI crude oil: Currently net long 143.2k, down 11k.
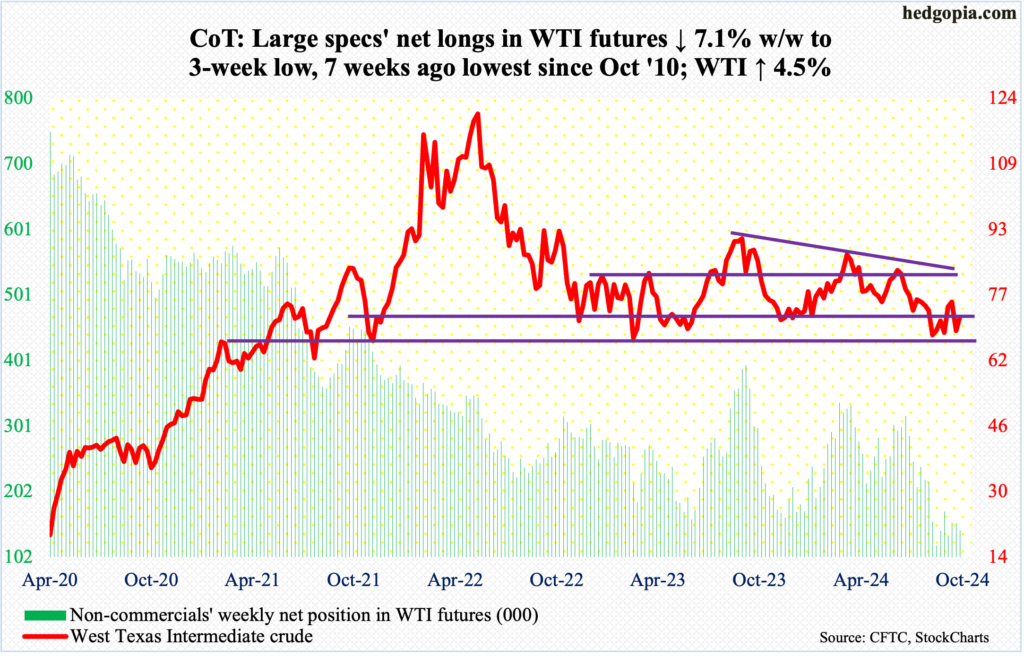
After tumbling 9.1 percent last week, West Texas Intermediate crude rallied 4.5 percent this week to $71.78/barrel. This essentially pushes WTI back into a months-long range between $71-$72 and $81-$82.
Earlier, WTI rose as high as $78.46 intraday on the 8th this month. There was resistance at $80, representing a falling trendline from September last year when the crude retreated after posting $95.03.
Down below, the crude ticked $65.27 on September 10, followed by higher lows of $66.33 on the 1st this month and $68.17 on the 18th. A rising trendline thereof extends to $70, and that should act as support for now.
In the meantime, US crude production in the week to October 18 was unchanged week-over-week at 13.5 million barrels per day – a record. Crude imports increased 902,000 b/d to 6.4 mb/d. Stocks of crude and gasoline rose as well – up respectively 5.5 million barrels and 878,000 barrels to 426 million barrels and 213.6 million barrels. Inventory of distillates, however, declined 1.1 million barrels to 113.8 million barrels. Refinery utilization grew 1.8 percentage points to 89.5 percent.
E-mini S&P 500: Currently net long 23k, down 5.2k.
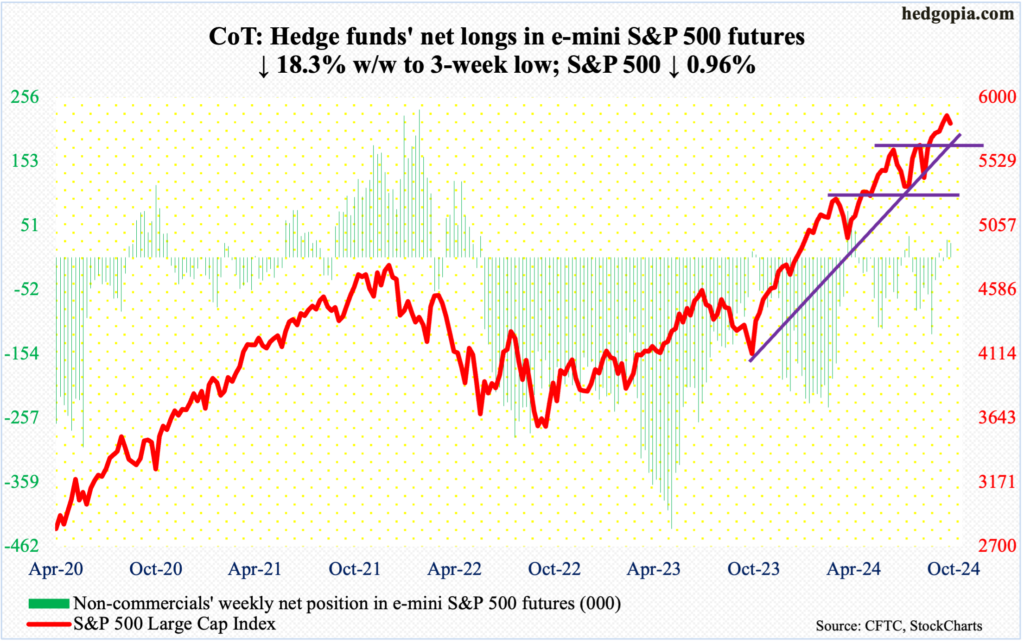
Equity bears enjoyed the first down week in seven. The S&P 500 gave back one percent this week to 5808. On September 6, it tagged 5403 before rallying.
Friday was interesting in that the bulls had an opportunity to end the week essentially unchanged as the large cap index touched 5863 within the first hour, but only to then come under pressure. Sellers have appeared at 5860s-70s for nearly two weeks now.
The good thing from the bulls’ perspective is that on Wednesday they needed to defend horizontal support at 5760s, and they did that. Odds strongly favor this support gets tested again next week. If it is breached, the next layer of support rests at 5670s, which is crucial.
Euro: Currently net short 28.5k, up 45.7k.
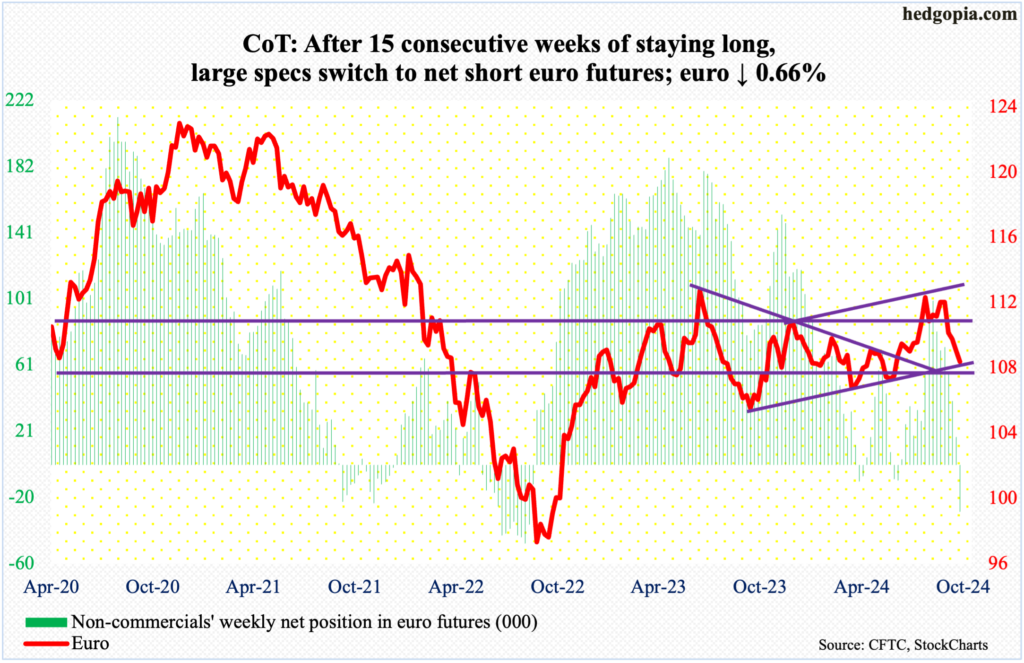
After remaining long for 15 weeks in a row, non-commercials have switched to net short. Holdings are as of Tuesday. On Wednesday, the cash dropped as low as $1.0761, which drew some buying. By the end of the week, the euro reached $1.0796, still down 0.7 percent for the week. This was the fourth consecutive weekly loss.
On September 30, after facing rejection at $1.12 for six consecutive weeks, the currency sharply fell, proceeding to breach crucial lateral support at $1.10 by the 4th this month.
Importantly, Wednesday’s low kissed trendline support from last October. This is an excellent opportunity for euro bulls to put their foot down, and they likely will. Their mettle will be tested at $1.09, and at $1.10 after that.
Gold: Currently net long 296.2k, up 9.8k.
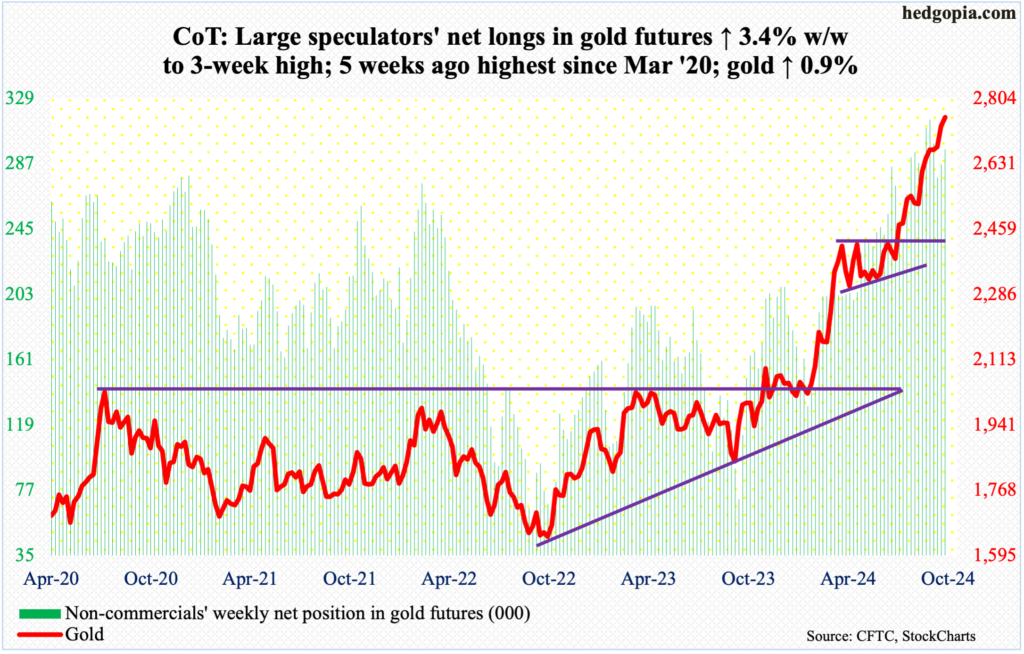
There is no stopping the yellow metal, rallying this week 0.9 percent to $2,755/ounce, tagging $2,773 on Wednesday. This was the third up week in a row – and sixth in last seven.
Gold has rallied strongly since June when it ticked $2,305. Since then, there have been several breakouts. Five weeks ago, after five sessions of sideways action at $2,610s, it broke out on September 20. This followed a breakout in the prior week at $2,540s-50s after several unsuccessful attempts since mid-August. Prior to this, after more than three months of sideways action, gold broke out at $2,440s-50s in August.
If one were to nitpick, the daily RSI has made lower highs even as gold went on to add $100 in the past month.
Nasdaq (mini): Currently net long 2.7k, up 1.3k.
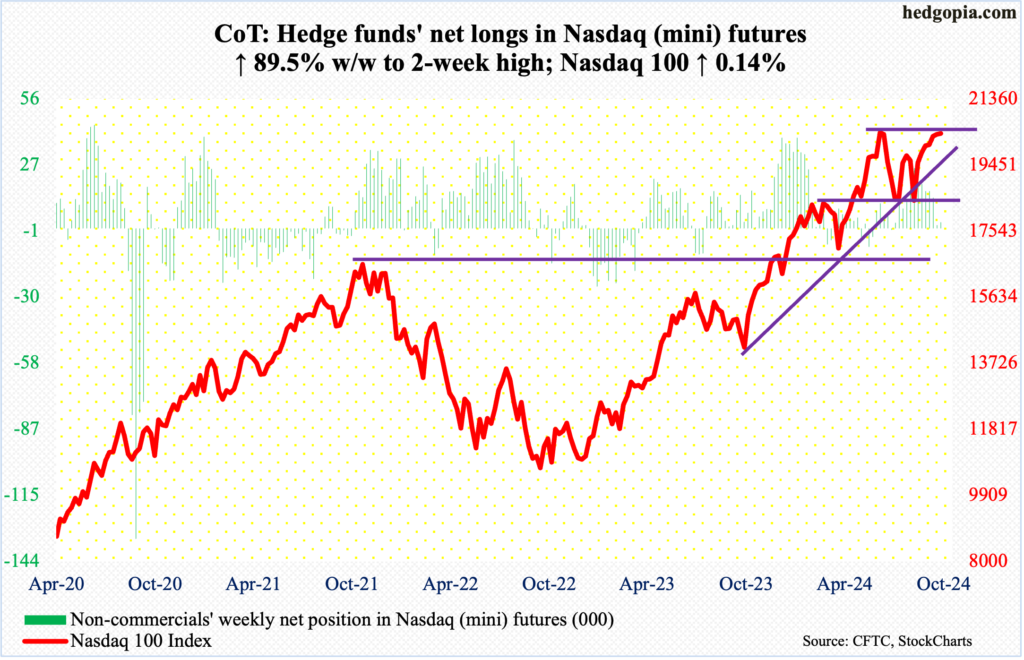
The Nasdaq 100 eked out a gain of 0.1 percent this week to 20352 – for seven up weeks in a row. Last week, the tech-heavy index edged up 0.3 percent. Both weeks formed a weekly spinning top. And this is occurring not too far away from the all-time high of 20691 posted on July 10, with the high this week of 20553 and last week of 20494.
Next week is crucial. Google parent Alphabet (GOOG) reports its September quarter on the 29th, Microsoft (MSFT) and Facebook parent Meta (META) on the 30th, and Apple (AAPL) and Amazon (AMZN) on the 31st. Ahead of these results, tech traders seem non-committal – one way or the other. Non-commercials are acting similarly, with net longs of merely 2,660 contracts.
Russell 2000 mini-index: Currently net long 18.8k, down 7.6k.
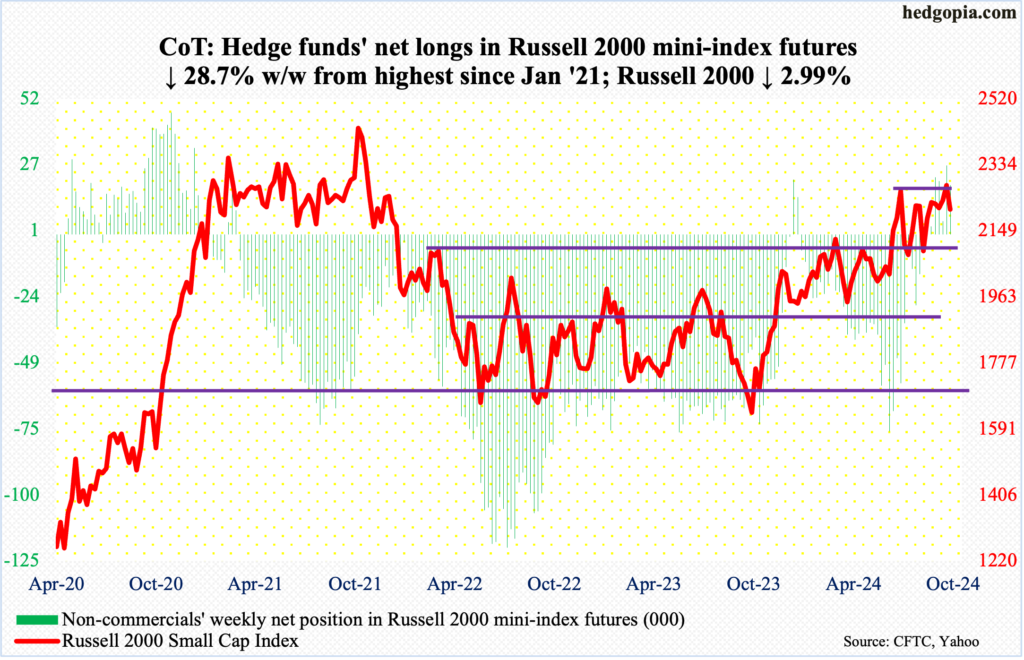
Small-cap bulls fell short of building on last week’s potentially positive development. Last week, the Russell 2000 eked out a breakout at 2260s, closing at 2276, with a high of 2289. Horizontal resistance at 2260s goes back to mid-July. In the week before, the small cap index pushed above a descending channel going back to September 18 when it ticked 2259.
This week, 2260s was lost as early as Monday, ending the week lower three percent to 2208. The Russell 2000 remains significantly under its all-time high of 2459 from November 2021.
The daily has room to head lower near term.
US Dollar Index: Currently net long 911, up 3k.
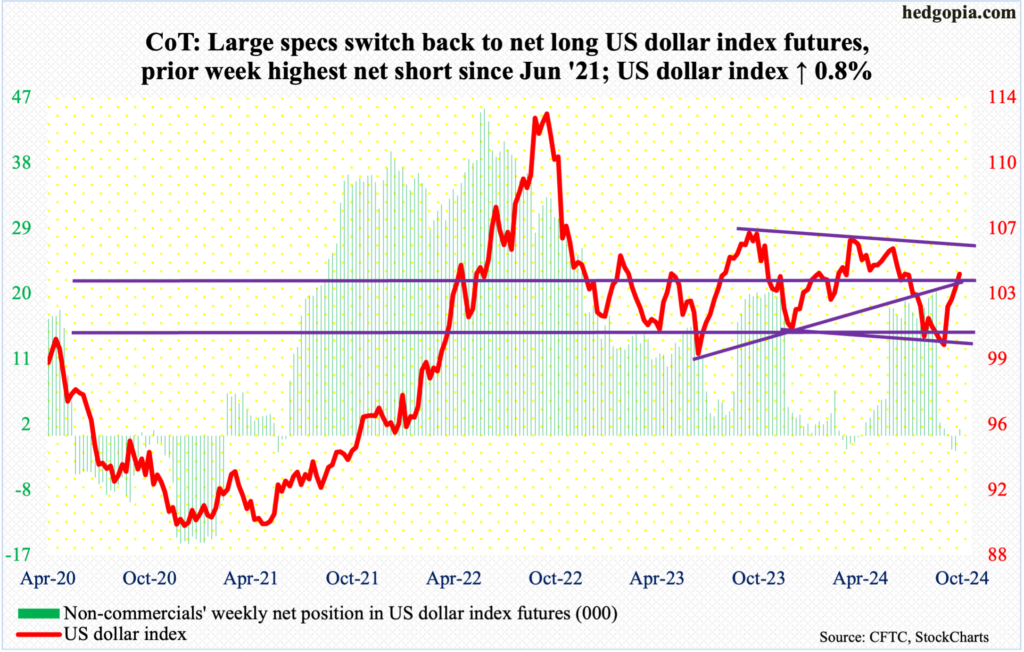
The week began with Monday’s reclaiming of the 200-day and remaining north of the average (103.64) in the next four sessions. The US dollar index rallied 0.8 percent this week to register a fourth consecutive weekly gain. It began to reverse higher on September 30, after having gone sideways just under 100 for several sessions. This week, it closed at 104.13. Resistance at 103-104 goes back to December 2016.
Earlier, the index had been under pressure since ticking 105.80 in June; this was preceded by highs of 106.38 in April and 107.05 last October, establishing a pattern of lower highs. This trendline resistance lies at 105.50. The daily is extremely overbought, but dollar bulls are probably eyeing this hurdle.
VIX: Currently net long 4k, up 3.7k.
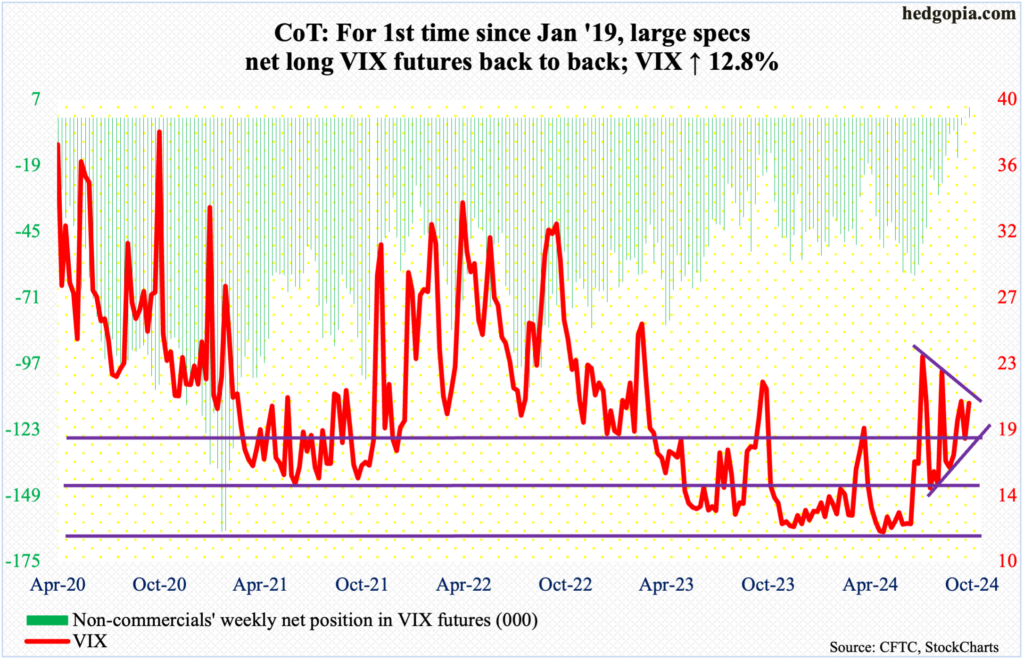
The daily Bollinger bands are narrowing. If past is prelude, when this happens, VIX tends to make a sharp move – either up or down. Most recently, in June and the first half of July, the bands gradually narrowed before the volatility index began to rally, eventually spiking to 65.73 on August 5. The bands are not as narrow now, but if things remain on the same trajectory, it would not be long before they narrow enough to unleash a surge in volatility.
This week, VIX rose 2.30 points to 20.33. The 50-day at 18.12 was defended all week.
Thanks for reading!

