Following futures positions of non-commercials are as of December 3, 2024.
10-year note: Currently net short 891.9k, down 34.7k.

The futures market is now factoring in an 86-percent chance of a 25-basis-point cut when the FOMC meets on 17-18 this month. The fed funds rate currently stands at a range of 450 basis points to 475 basis points, down 75 basis points from the September high. Next year, another 50 to 75 basis points of reduction is currently priced in.
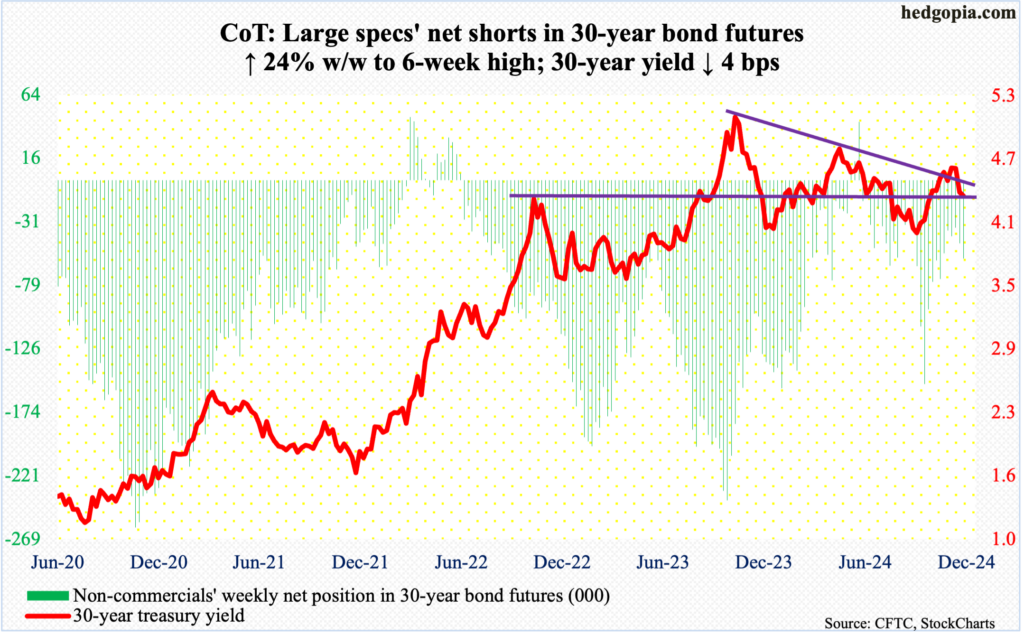
The 10-year treasury yield has refused to tag along. Rates bottomed at 3.6 percent on September 17 and rose as high as 4.51 percent by November 15, closing this week at 4.15 percent. At last month’s high, the 10-year faced stiff resistance at a falling trendline from October last year when these notes yielded five percent.
Rates are currently below horizontal support at 4.3s and below both the 50- and 200-day moving averages (4.19 percent and 4.2 percent respectively). More downward pressure is possible, but the divergence between the long end of the curve and the fed funds rate is the bond market’s way of saying the Federal Reserve is easing a bit too much here.
30-year bond: Currently net short 58.8k, up 11.4k.
Major US economic releases for next week are as follows.
The NFIB Optimism Index (November) and labor productivity (3Q24, revised) are on schedule for Tuesday.
Small-business optimism in October firmed up 2.2 points month-over-month to 93.7, matching July’s reading, which was a 29-month high. March’s 88.5 was the lowest since December 2012.
The first print showed 3Q24 non-farm output per hour grew at an annualized rate of 2.2 percent. This was a three-quarter high.
On Wednesday, the consumer price index (November) is due out. In the 12 months to October, headline and core consumer inflation increased 2.6 percent and 3.3 percent, which respectively were at a three- and six-month high. In 2022, they peaked at 9.1 percent and 6.6 percent in June and September, in that order.
The producer price index (November) will be released on Thursday. In October, headline and core wholesale prices rose 2.4 percent and 3.5 percent respectively.
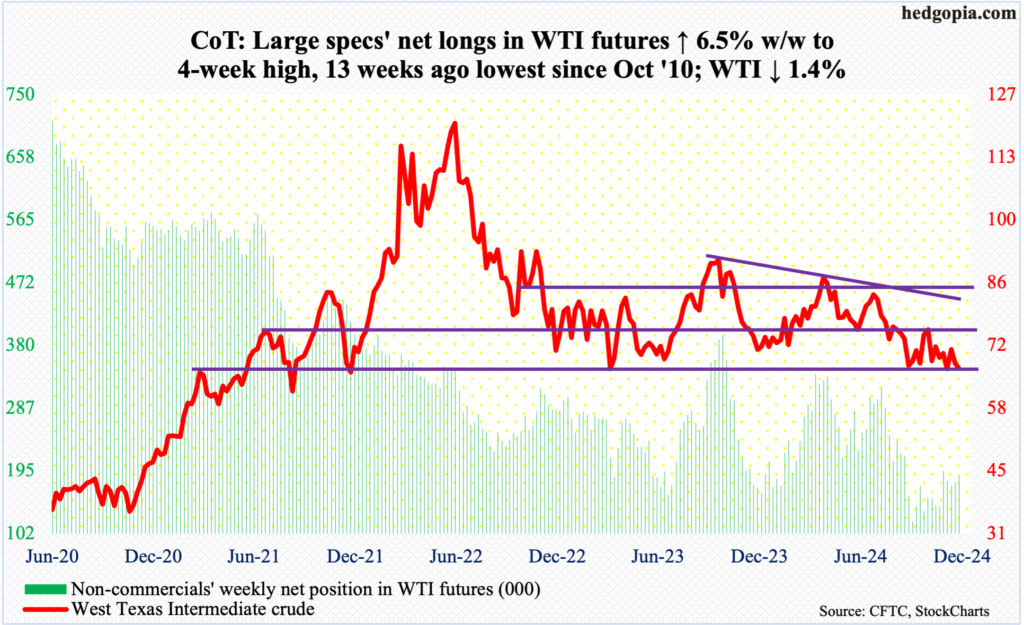
WTI crude oil: Currently net long 188.8k, up 11.5k.
OPEC+, which pumps about half the world’s oil, on Thursday delayed output hike to April 2025, citing weak demand and strong production outside the group. US output is at a record high. OPEC+ has been weighing the possibility of a hike since June but this is yet to come into fruition. It is possible the group is on a wait-and-watch as to if the new administration under President-elect Donald Trump will be putting sanctions against Iran and Venezuela. During his first term (2017-2021), Trump was critical of OPEC+ for high prices, asking Saudi Arabia to release more oil. Bottom line, Trump wants lower prices, but not low enough to hurt US shale.
Amidst this, West Texas Intermediate crude dropped 1.4 percent this week to $67.20/barrel. This is a critical level. The past three months, bids have routinely showed up at $66-$67, but subsequent rallies for the most part have not amounted to much.
This week, the 50-day ($70.26) provided stiff resistance on Tuesday and Wednesday. A likely breach ahead of $66-$67 will open the door toward horizontal support at $61-$62.
In the meantime, US crude production in the week to November 29 increased 20,000 barrels per day to 13.513 million b/d – a record. Crude imports increased 1.2 mb/d to 7.3 mb/d. As did inventory of gasoline and distillates, which respectively grew 2.4 million barrels and 3.4 million barrels to 214.6 million barrels and 118.1 million barrels. Crude stocks, on the other hand, fell – down 5.1 million barrels to 423.4 million barrels. Refinery utilization rose 2.8 percentage points to 93.3 percent.
E-mini S&P 500: Currently net short 108.6k, up 29.7k.
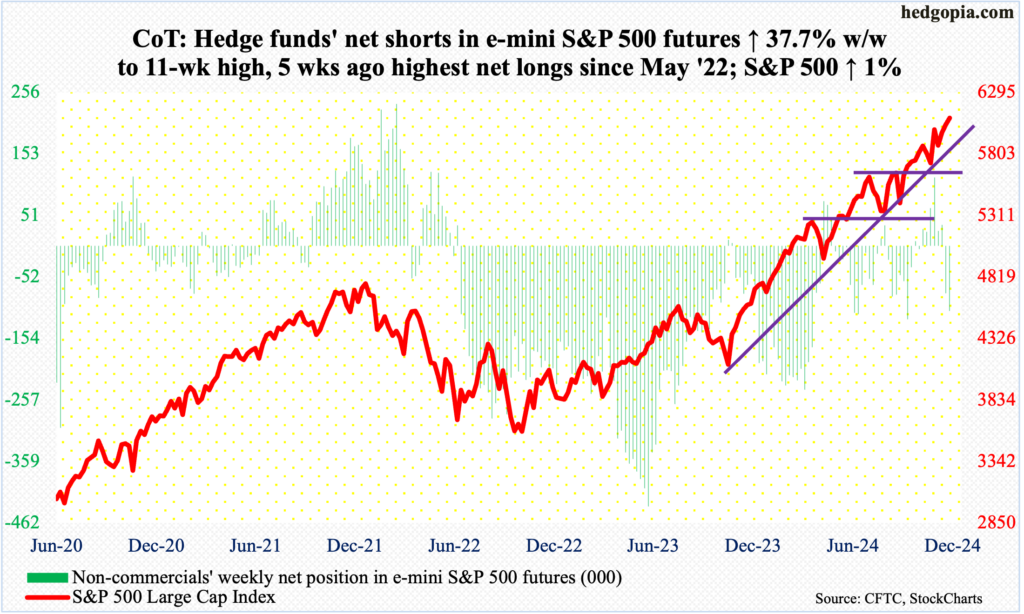
The S&P 500 added one percent this week to score a third consecutive up week. Rallying as high as 6100 intraday, Friday closed at 6090. On November 5 – the day of the US election – the large cap index closed at 5783, hence adding over 300 points post-election. Investor mood has decidedly shifted into higher bullish gear – to a point where several indicators are now looking extended, if not outright frothy.
Investors Intelligence bulls this week (as of Tuesday) were up 1.6 percentage points week-over-week to 62.9 percent – a 19-week high – even as the bearish count slid as much to 16.1 percent, which set an 18-month low. Bulls are now 60 percent or higher for four weeks in a row. In June and July this year, the streak ended after seven weeks, with the S&P 500 subsequently losing just under 10 percent from high to low over three weeks.
Non-commercials seem to be positioning for a similar outcome. In five weeks, they have gone from net long 113,440 contracts in e-mini S&P 500 futures to net short 108,610 contracts.
The cash is extended technically, but the bulls do have the advantage of a favorable seasonal period. In the event of downside pressure, their first test lies at 6020s.
Euro: Currently net short 57.5k, up 1.5k.
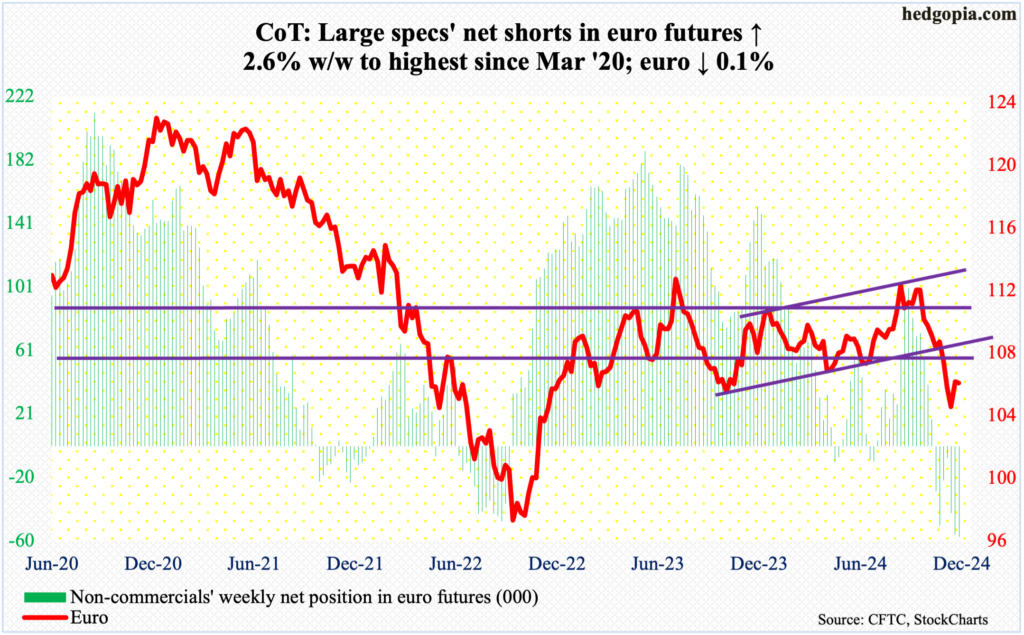
Three weeks ago, after dropping in seven of eight weeks, the euro bottomed at $1.0332. This preceded a sharp fall starting September 30 after facing rejection at $1.12 for six consecutive weeks.
This week, the currency fell 0.1 percent to $1.0568, forming a weekly spinning top. Odds favor continued strength ahead. The euro closed just north of horizontal support at $1.05, which goes back nearly a decade.
The next level to watch is $1.08, with the sharply falling 50-day at $1.075.
Gold: Currently net long 259.7k, up 9.4k.
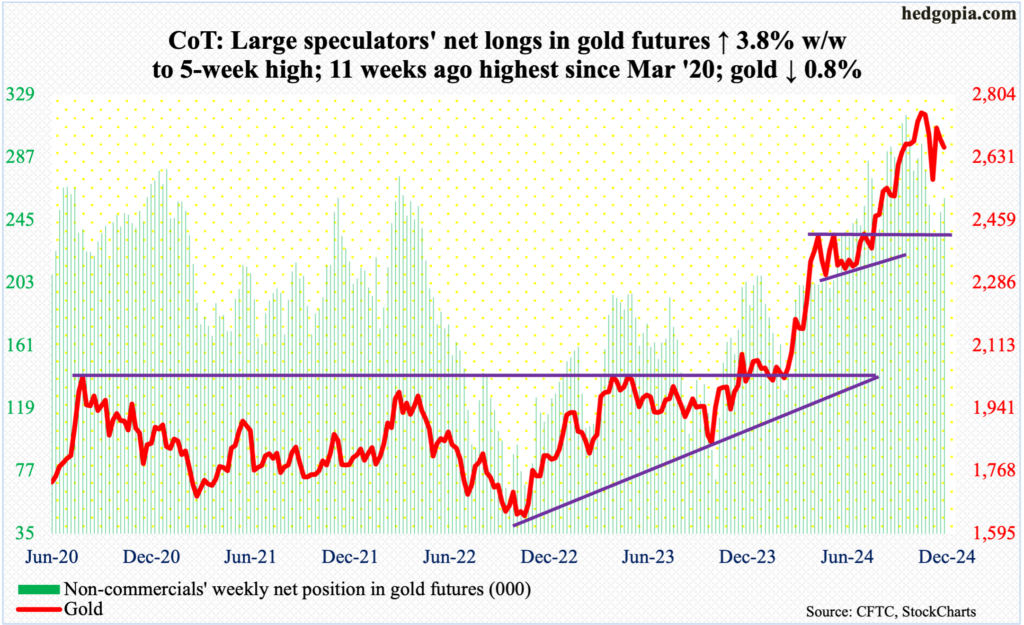
Gold bugs were repelled at the 50-day ($2,681) for six successive sessions including the first four this week. They lost the average on November 11 and have since closed above it only once.
Earlier on October 30, gold reached a new high of $2,802, having begun to rally in June at $2,305. On the way to that peak, there were several breakouts – $2,610s, $2,540s-50s and $2,440s-50s, which can now provide support.
On November 14, the metal ticked $2,542 intraday and reversed higher. The rally since has now stalled at the 50-day. This week, it lost 0.8 percent to $2,660/ounce. The longer it takes to reclaim the average, which is now flat to slightly falling, the higher the odds of continued downside pressure. There is support at $2,610s immediately ahead.
Nasdaq (mini): Currently net long 29.7k, up 10.2k.
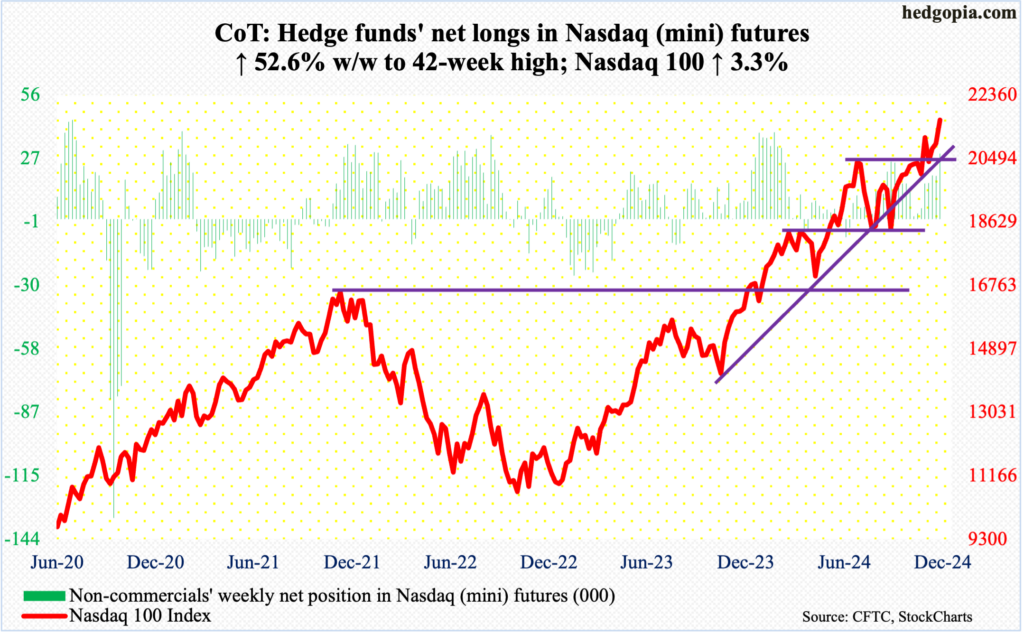
After stalling at 21100s for a couple of sessions, the Nasdaq 100 gapped up and broke free on Tuesday with the week closing at 21622 – up 3.3 percent for the week and a new high. The daily RSI still struggled to close above 70, registering 69.53; the last time the momentum indicator hit the overbought level was early July, which was soon followed by selling lasting nearly a month.
This time around, with seasonal tailwind at their back, tech bulls deserve the benefit of the doubt so long as the index remains above 20500s.
Russell 2000 mini-index: Currently net short 11.6k, up 9k.
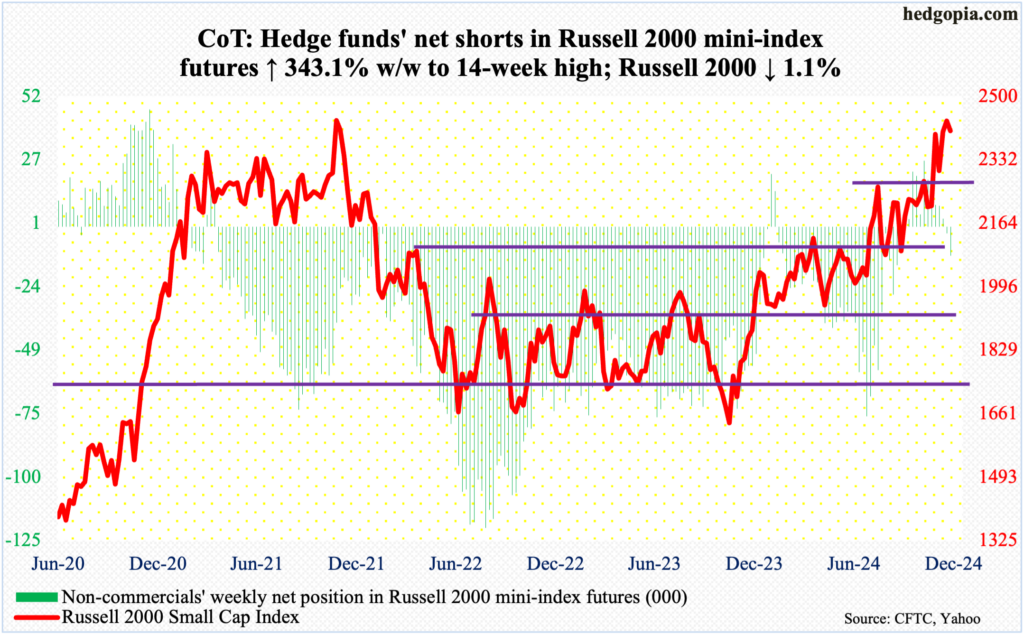
Unlike its large-cap peers, the Russell 2000 was in the red this week, down 1.1 percent to 2409. The small cap index has struggled since hitting 2466 on November 25, which barely surpassed the prior high of 2459 posted in November 2021.
This week’s performance also followed last week’s weekly spinning top, which showed up in the same week the index posted a new high. That said, the index remains comfortably ahead of the make-or-break horizontal support at 2260s, which goes back to mid-July.
US Dollar Index: Currently net short 3.1k, up 255.
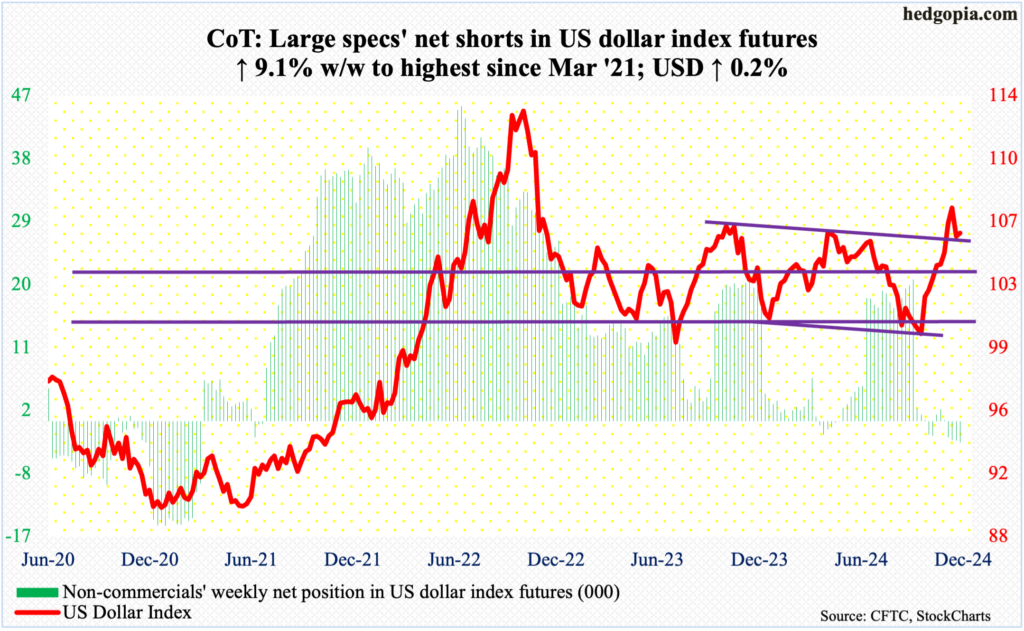
Dollar bulls last week were unable to defend 107. This week, the US dollar index inched up 0.2 percent to 106.04, with a wide range of 106.72 and 105.40.
Earlier on November 22, the index tagged 108.07 intraday, with the session leaving behind a large upper wick. Previously, it began to reverse higher on September 30 this year, after having gone sideways just under 100 for several sessions.
More downside pressure is likely once 105.70s is breached.
VIX: Currently net short 33.2k, up 13.8k.
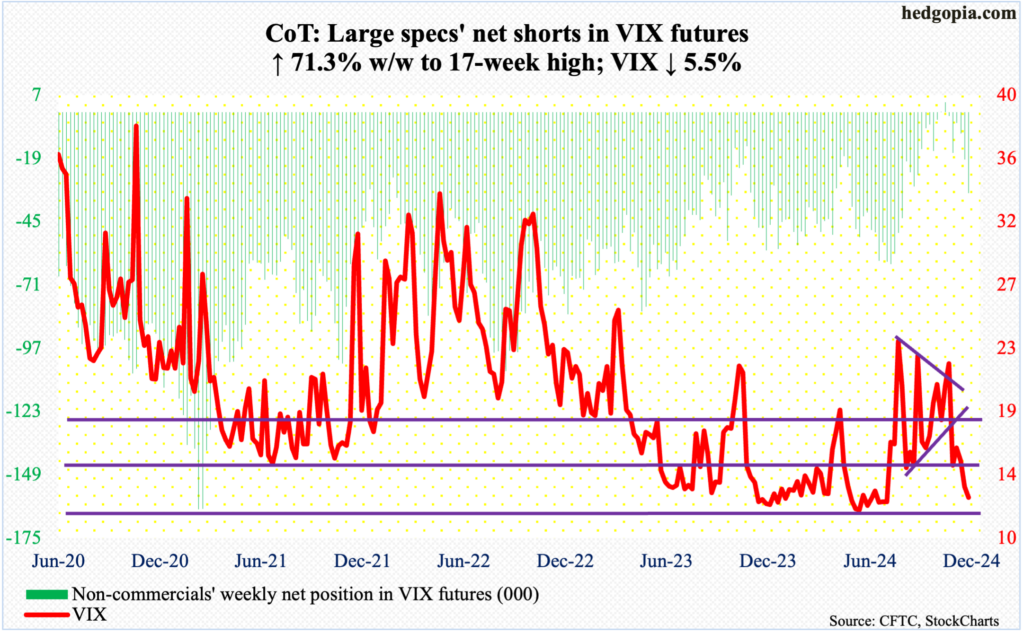
Down three weeks in a row, VIX’s close this week at 12.77 is the lowest in nearly five months. With this, the volatility index also approaches crucial support at 12.
Concurrently, the options market is reflecting extreme optimism, with the 21-day moving average of the CBOE put-to-call ratio dropping to 0.512 on Thursday, which is the lowest print since April 2022.
Thanks for reading!

