Following futures positions of non-commercials are as of February 25, 2025.
10-year note: Currently net short 699.9k, down 9.7k.

Non-commercials’ net shorts in 10-year note futures are down nearly 39 percent from the record 1.1 million contracts in the week to October 1 last year. Nevertheless, at 700,000, these holdings, which will benefit if the 10-year treasury yield rallies, remain sizable. In recent weeks, however, yields have not quite cooperated.
The 10-year hit 4.81 percent on January 14 and headed lower, with a lower high of 4.66 percent on February 12. This week, the 10-year tumbled 19 basis points week-over-week to 4.23 percent – essentially right on the 200-day moving average at 4.24 percent. The 50-day at 4.54 percent was breached seven sessions ago.
The 4.2s-4.3s level also constitutes horizontal support going back years. It is a make-or-break. A decisive breach will probably lead these traders to hasten to cover their net shorts, which, should it unfold, can put these rates under more downward pressure.
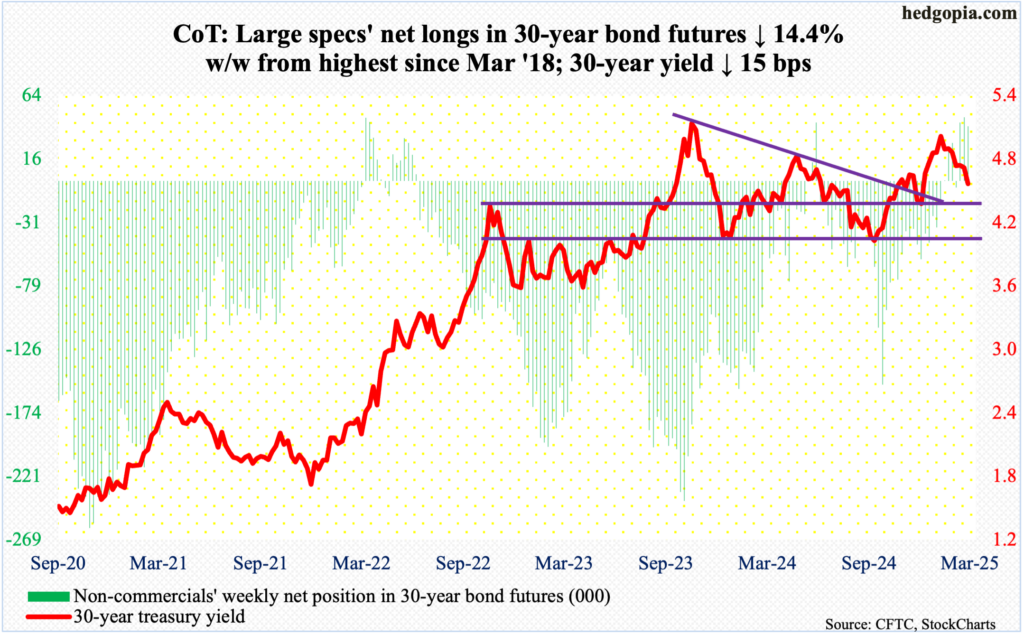
30-year bond: Currently net long 40.9k, down 6.9k.
Major US economic releases for next week are as follows.
The ISM manufacturing index (February) is due out Monday. Manufacturing activity increased 1.7 percentage points month-over-month in January to 50.9 percent. This was the first time in 26 months the sector witnessed expansion.
Durable goods orders (January, revised) and the ISM services index (February) are scheduled for Wednesday.
Orders for non-defense capital goods ex-aircraft – proxy for business capex plans – grew 0.8 percent m/m to a seasonally adjusted annual rate of $75.1 billion. This set a new record.
In January, non-manufacturing activity decreased 1.2 percentage points m/m to 52.8 percent.
Labor productivity (4Q24, final) will be published on Thursday. Preliminarily, 4Q non-farm output per hour rose 1.6 percent from a year ago. This was the first time in six quarters productivity grew sub-two percent year-over-year.
Friday brings monthly payrolls (February). The economy created 143,000 non-farm jobs in January. This comes in the wake of a monthly average of 166,000 in 2024, 216,000 in 2023, 380,000 in 2022 and 603,000 in 2021.
WTI crude oil: Currently net long 141.3k, down 34.3k.
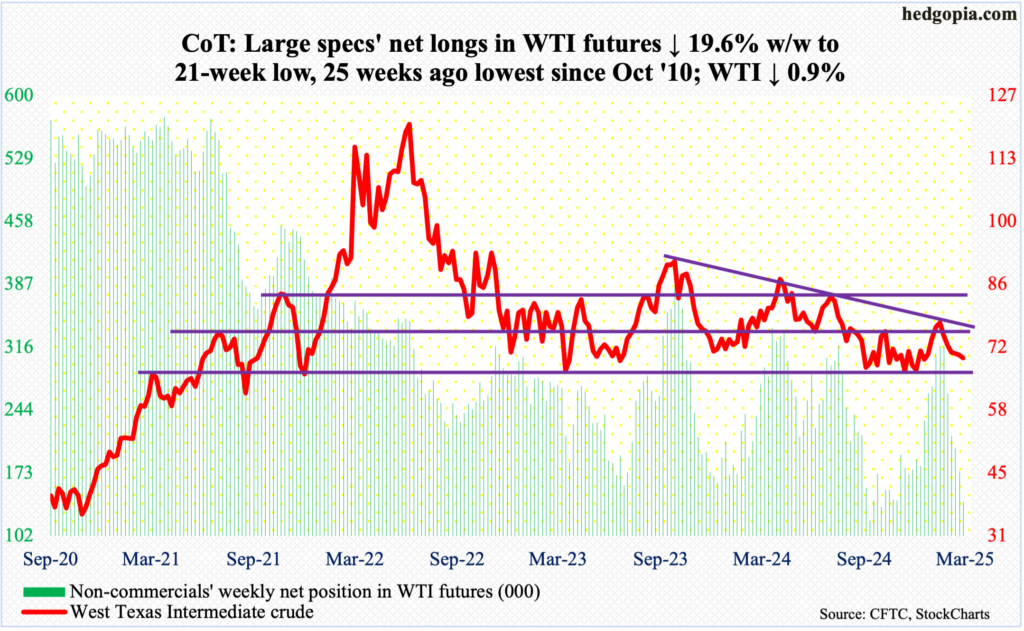
Last week, after six consecutive weekly losses, West Texas Intermediate crude was at risk of continued downward momentum until crucial support from last September’s low was tested. This did occur on Wednesday this week as a rising trendline from back then was successfully tested with a session low of $68.36. The week ended lower 0.9 percent to $69.76/barrel, forming a weekly long-legged doji.
The daily can rally, and for that to happen, oil bulls need to reclaim the months-long $71-$72 and $81-$82 range, which was breached last September, the sooner the better. On Thursday, the crude rallied up to $70.54 before giving back some of the gains on Friday.
In the meantime, US crude production in the week to February 21 increased 5,000 barrels per day w/w to 13.502 million b/d; output has come under slight pressure since reaching a record 13.631 mb/d in the week to December 6. Crude imports rose as well, up 99,000 b/d to 5.9 mb/d. As did gasoline and distillate inventory which increased 369,000 barrels and 3.9 million barrels respectively to 248.3 million barrels and 120.5 million barrels. Crude stocks, however, decreased 2.3 million barrels to 430.2 million barrels. Refinery utilization grew 1.6 percentage points to 86.5 percent.
E-mini S&P 500: Currently net short 32.8k, down 7.2k.
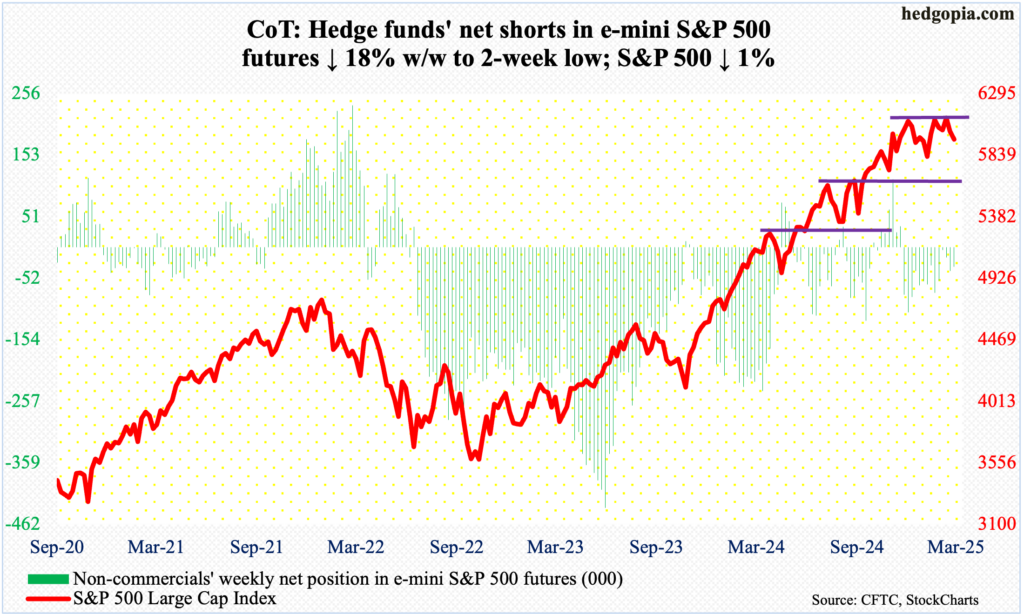
After beginning the week with Monday’s breach of the 50-day, equity bulls tried to reclaim the average in the next three sessions but only to get overpowered by the bears on Thursday. For the week, the large cap index declined one percent – a back-to-back negative week – to 5954.
Last week, the S&P 500 broke out of 6120s, registering a new intraday high of 6147 on Wednesday the 19th, followed by Friday’s brutal selloff ending right on the 50-day. This week, the average could not be saved, rather attracted sellers as the week went on.
The good thing from the bulls’ perspective is that they bought Friday’s weakness; the index dropped as low as 5838 in that session. In essence, horizontal support at 5870s has been defended. The path of least resistance for now is up. The 50-day (5999), which is now pointing down, also lines up with straight-line resistance at 6000. Inability to recapture this dual resistance raises the odds that the index wants to test another layer of support at 5770s. The 200-day – still rising – rests at 5720.
Euro: Currently net short 25.4k, down 26k.
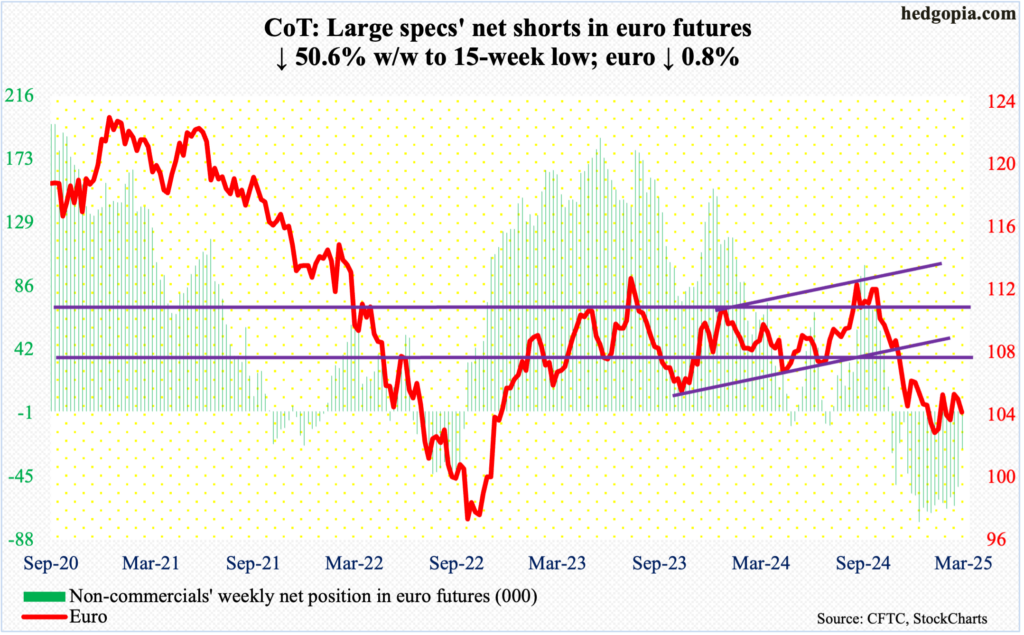
Horizontal resistance at $1.05, which goes back at least a decade, is standing like a rock. This level has been hit in five of the last six weeks and is in no mood of yielding. Through Wednesday this week, the euro traded just north of $1.05 for five sessions in a row, to no avail as far as euro bulls are concerned. By Friday, the currency was down 0.8 percent to $1.0376.
Earlier on December 6, the euro ticked $1.063 and reversed lower. Even before that, it fell sharply starting September 30 (last year) after facing rejection at $1.12 for six consecutive weeks. It started to stabilize early this year around $1.02s, which was defended for a whole month.
There is lateral support at $1.03. If this gives way, bears will once again be eyeing $1.02s.
Gold: Currently net long 261.6k, down 7k.
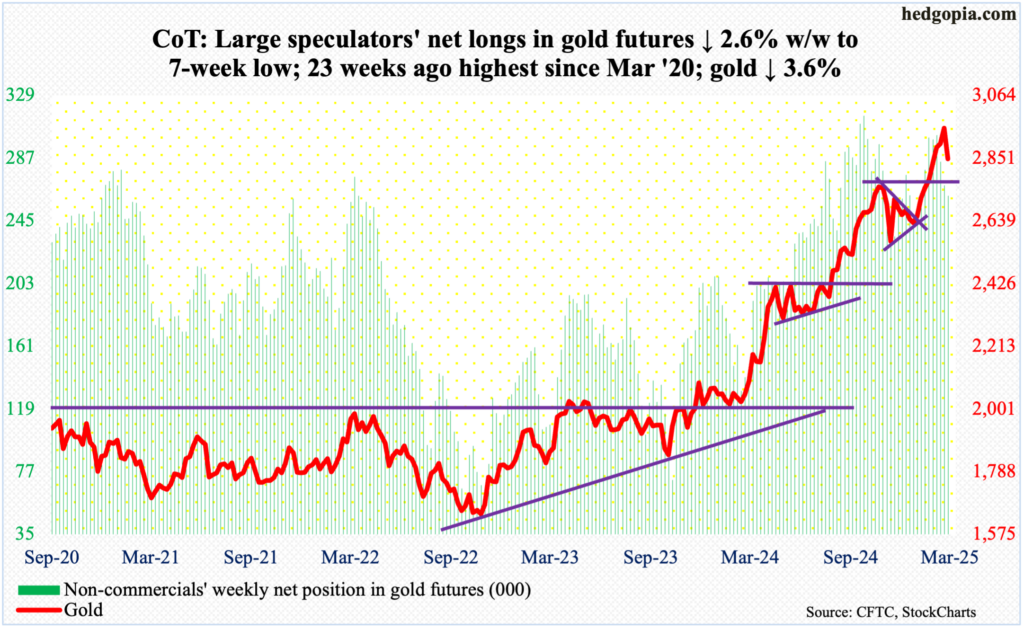
Gold bugs finally caught their breath. Gold dropped 3.6 percent this week to $2,848/ounce.
The metal had been rallying since it ticked $2,608 on December 30. Last week, it rallied 1.8 percent to $2,953/ounce; this was the eighth week in a row of positive weekly gains.
Concurrently, in five of eight sessions through last week, sellers showed up at $2,960s-70s. This continued in the first two sessions this week, with Monday tagging a fresh intraday all-time high of $2,974.
Ahead lies a crucial breakout retest at $2,800. After this, there is support at $2,750s, and $2,540s-50s and $2,440s-50s after that.
Nasdaq (mini): Currently net long 25.8k, up 15.9k.
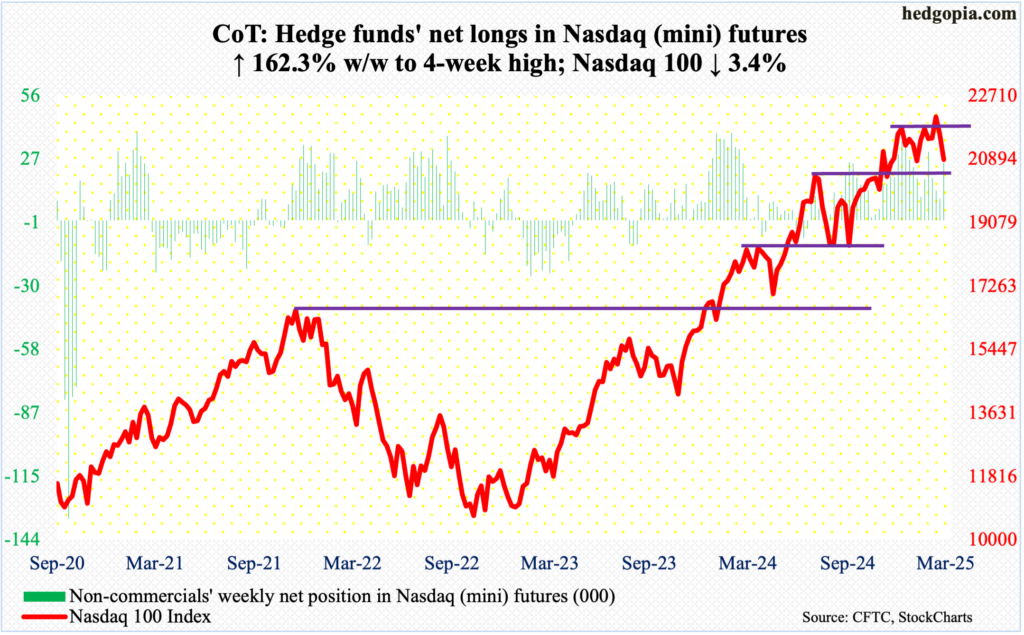
Nvidia (NVDA) giveth and Nvidia taketh away (more on this here). Its January-quarter results were better than expected but failed to reenergize the bulls, with the stock getting slammed 8.5 percent on Thursday post-earnings. It was a highly anticipated report – kind of a make-or-break not only for the company but for the entire stock market. At the end of last week, NVDA made up of 8.4 percent of the Nasdaq 100 and 6.6 percent of the S&P 500; at the end of this one, this dropped to 7.4 percent and 5.8 percent respectively.
Not surprisingly, the Nasdaq 100 was punished this week, down 3.4 percent to 20884. This was preceded by a new intraday high of 22223 last Wednesday the 19th – past the prior high of 22133 from December 16 – but momentum ran out of steam by Friday.
This Friday was a little different, as the intraday low of 20407 elicited buying interest. Horizontal support at 20500s was defended. A relief rally can occur. The 50-day, which is turning lower, is at 21461.
Russell 2000 mini-index: Currently net short 21.3k, down 8.5k.
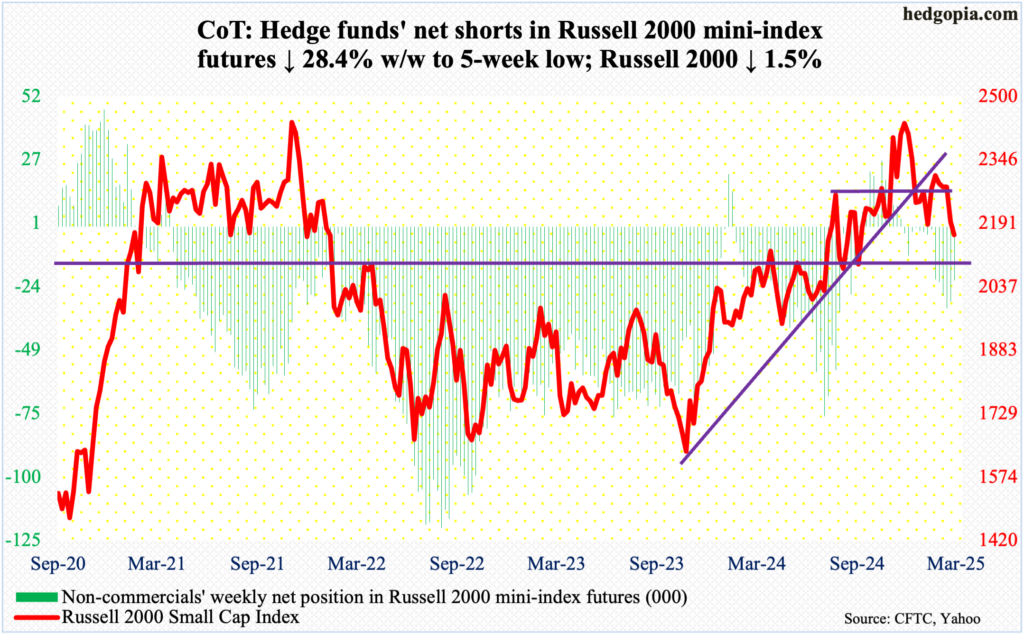
The Russell 2000 experienced a breakout retest on Friday – just about. It ticked 2126 intraday and closed at 2163, with the week finishing lower 1.5 percent. The small cap index broke out of 2100 last July, with a successful retest in September. Small-cap bulls hope this week’s retest lasts.
This week’s action followed a new all-time high of 2466 on November 25 – just past the prior high of 2459 from November 2021; in the week the new high was posted, a spinning top showed up on the weekly.
Most recently, the Russell 2000 was repelled repeatedly at 2320s. Before the bulls could again go after this, they are likely to face resistance at 2200 and then 2260s, with the latter going back to mid-July last year.
US Dollar Index: Currently net long 15.7k, down 1k.
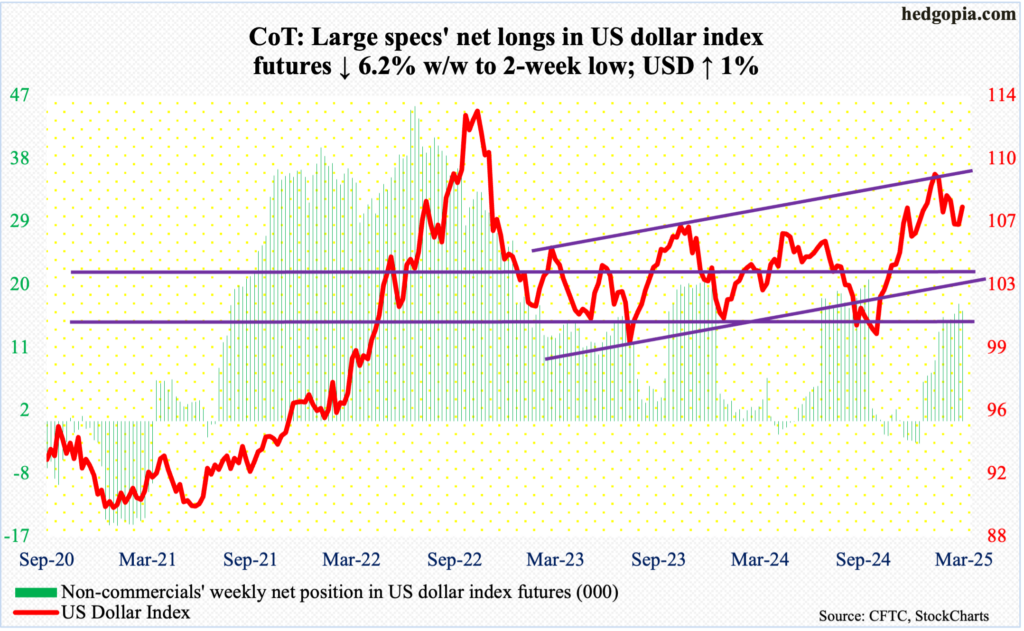
After defending 106 in the first three sessions, the US dollar index rallied strong in the latter half with the week ending up one percent to 107.56. This comes after three down weeks in a row – and in five out of six.
On January 13, the index posted a two-plus-year intraday high of 110.02. Crucial support at 107 was breached last week but has been reclaimed this week.
The daily has room to rally. The 50-day, which is flattish, is at 107.88, and after that comes lateral resistance at 108.
VIX: Currently net short 69.1k, down 11.4k.
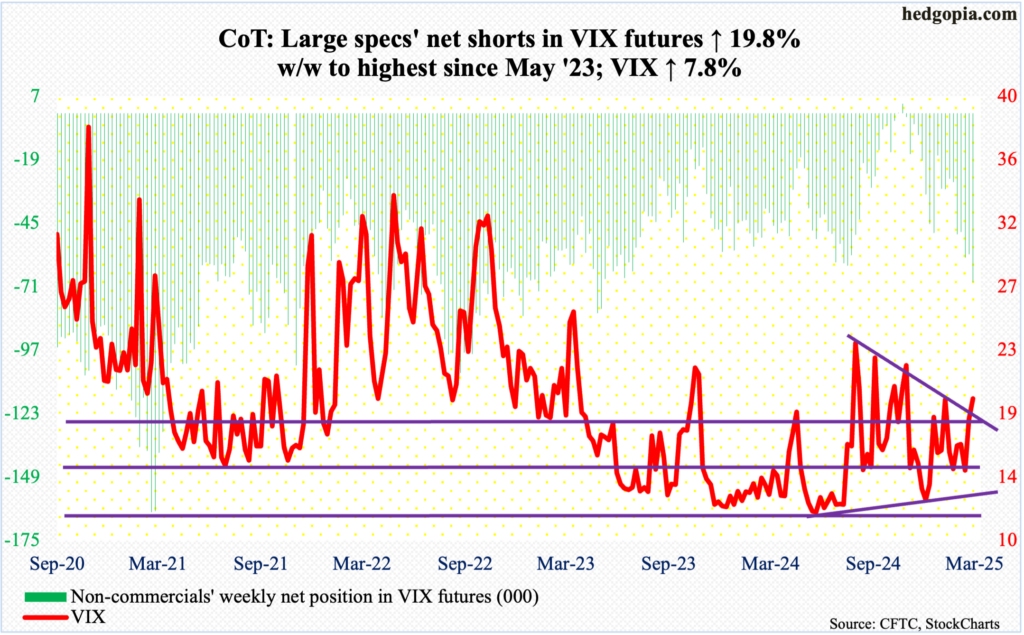
Non-commercials raised net shorts in VIX futures to a nearly two-year high. The volatility index, in the meantime, rallied from 15.28 last Friday to this Friday’s high of 22.40 intraday. Vol bulls, however, were unable to hang on to Friday’s gains, with the session closing at 19.63. For the week, it added 1.42 points.
Since September last year, 23 – or thereabouts – has posed difficulty for volatility bulls, and this trend prevailed this week as well.
VIX for now is probably headed lower.
Thanks for reading!

