
Following futures positions of non-commercials are as of March 25, 2025.
10-year note: Currently net short 810.1k, down 71.3k.
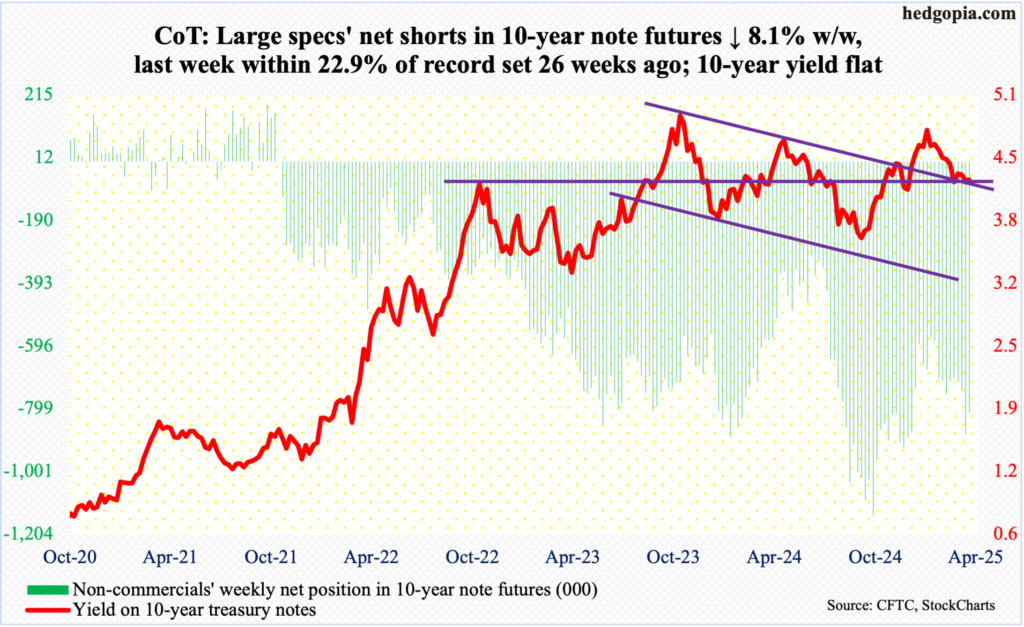
Non-commercials reduced net shorts in 10-year note futures sequentially, but holdings remain elevated. In the week to October 1st last year, they were net short a record 1.14 million contracts. This week’s tally is 29.1 percent lower from that high and 29.9 percent higher than the low of January 14th this year.
The 10-year treasury yield ticked 4.81 percent on January 14th and reversed lower to bottom at 4.11 percent on the 4th this month. This week, these rates were flat at 4.26 percent. In recent weeks, non-commercials’ wager on higher rates have paid off, albeit marginally. This is likely to change in the sessions ahead.
On the daily, the 10-year acts like it wants lower prints. It is currently sandwiched between the 50- and 200-day moving averages (4.41 percent and 4.22 percent respectively); a breach of the latter, which currently lines up with trendline support from the low early this month, will raise the odds that the rates are headed toward that low.
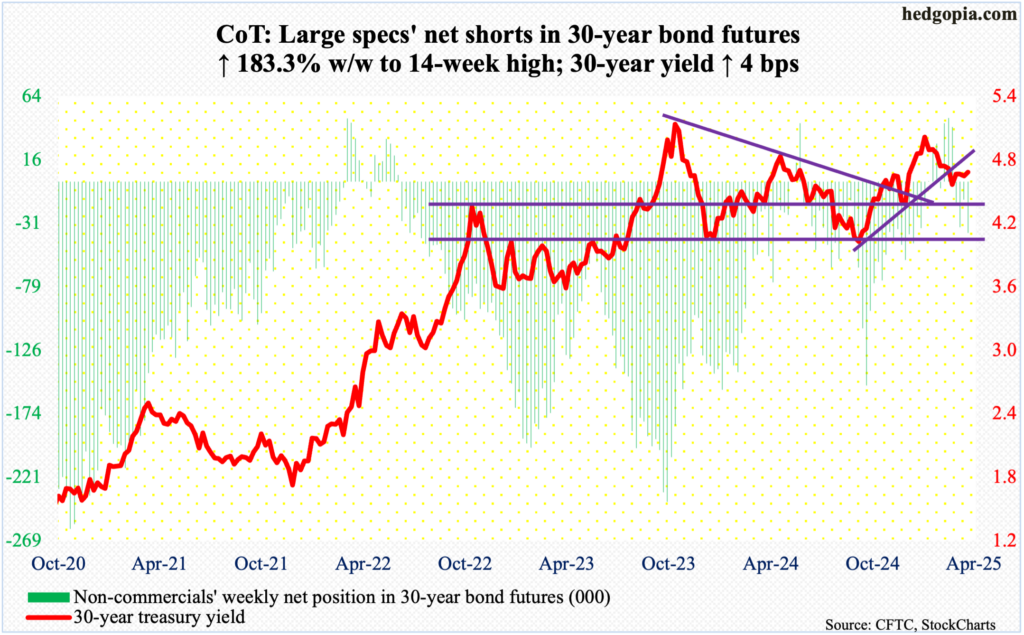
30-year bond: Currently net short 38.3k, up 24.8k.
Major US economic releases for next week are as follows.
The ISM manufacturing index (March) and JOLTs job openings (February) will be out Tuesday.
Manufacturing activity in February dropped six-tenths of a percentage point month-over-month to 50.3 percent. This is the second consecutive monthly expansion after 26 months of contraction.
In January, non-farm job openings rose 232,000 m/m to 7.7 million. Last September’s 7.1 million was the lowest since December 2020. Openings peaked at 12.1 million in March 2022.
Factory orders (February, revised) are scheduled for Wednesday. Orders for non-defense capital goods ex-aircraft – proxy for business capex plans – fell 0.3 percent m/m to a seasonally adjusted annual rate of $75 billion. January’s $75.2 billion was a record.
Thursday brings the ISM services index (March). February services activity increased seven-tenths of a percentage point m/m to 53.5 percent. This is the eighth monthly expansion in a row.
Payrolls (March) will be released Friday. For the first two months, the economy created an average 138,000 non-farm jobs year-to-date. This is lower than the monthly average of 168,000 in 2024, 216,000 in 2023 and 380,000 in 2022.
WTI crude oil: Currently net long 178.7k, up 14.7k.
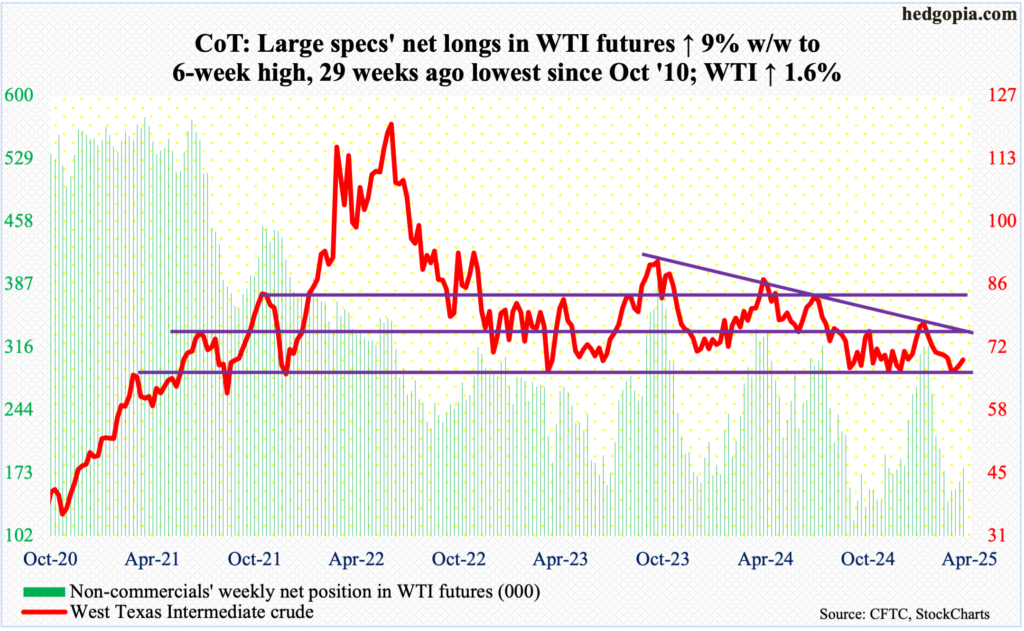
Up 1.6 percent this week, West Texas Intermediate crude has now rallied for three weeks in succession. This followed defense of horizontal support at $65-$66 for several sessions in the first half this month. Support at $65-$66 goes back years, with buyers also having shown up there last September.
This Wednesday, the crude rallied as high as $70.22, with a weekly close of $69.36/barrel. Wednesday’s high just fell short of $71-$72, which makes up the lower bound of a months-long range with the upper bound at $81-$82. This range was broken last September. The sharply falling 50-day lies at $70.53.
On the weekly, more gains are likely, but trading in the sessions ahead is likely to be dominated by the now-overbought daily indicators.
In the meantime, US crude production in the week to March 21st increased 1,000 barrels per day week-over-week to 13.574 million b/d; output has come under slight pressure since registering a record 13.631 mb/d in the week to December 6. Crude imports rose as well, up 810,000 b/d to 6.2 mb/d. Stocks of crude, gasoline, and distillates all dropped – by 3.3 million barrels, 1.4 million barrels and 421,000 barrels respectively to 433.6 million barrels, 239.1 million barrels and 114.4 million barrels. Refinery utilization inched up one-tenth of a percentage point to 87 percent.
E-mini S&P 500: Currently net short 53.4k, up 121.7k.
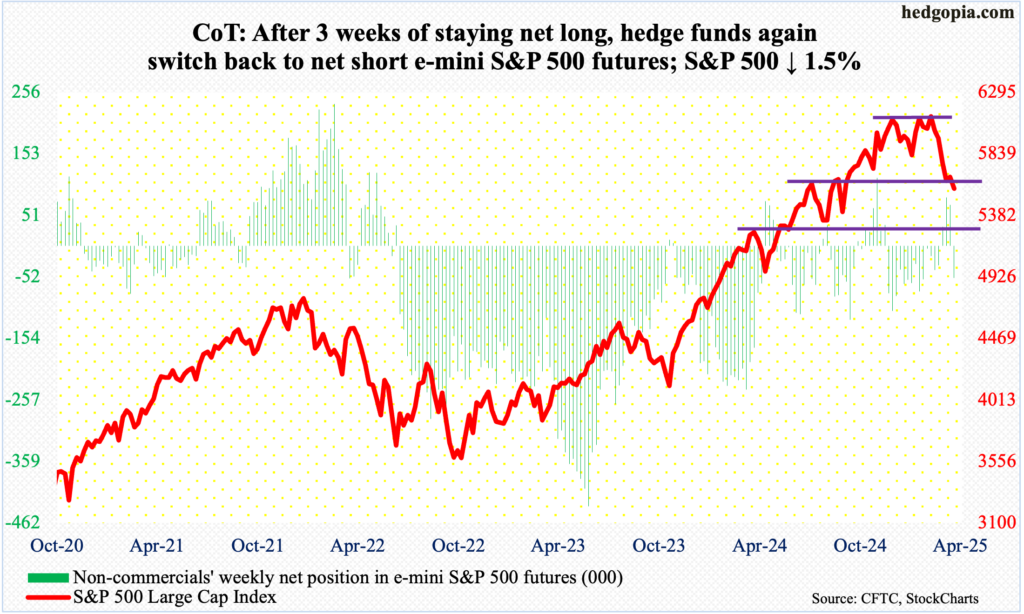
Non-commercials stuck to their long bias for only three weeks before jumping ship. This week, there was a swing of 121,673 contracts, as in the prior week they were net long 68,311 contracts. Holdings are as of Tuesday, and the cash at one time in that session was up 2.1 percent for the week, tagging 5787 to form a long-legged doji just above the 200-day. By Friday, momentum went the other way, and the index finished the week lower 1.5 percent. This followed last week’s gains of 0.5 percent, which was a first up week in five.
Previously, between February 19th when the S&P 500 reached a fresh intraday high of 6147 and March 13th when it bottomed at 5505, the large cap index tumbled 10.5 percent. That low is now 1.4 percent away, and it is a must-hold for the bulls, who this week were unable to sustainably reclaim the 200-day as well as horizontal resistance at 5770s. In fact, sellers showed up right at that hurdle.
As things stand, the index (5581) probably wants to go lower, with the daily RSI having turned lower this week right at the median.
Euro: Currently net long 65.5k, up 6.1k.
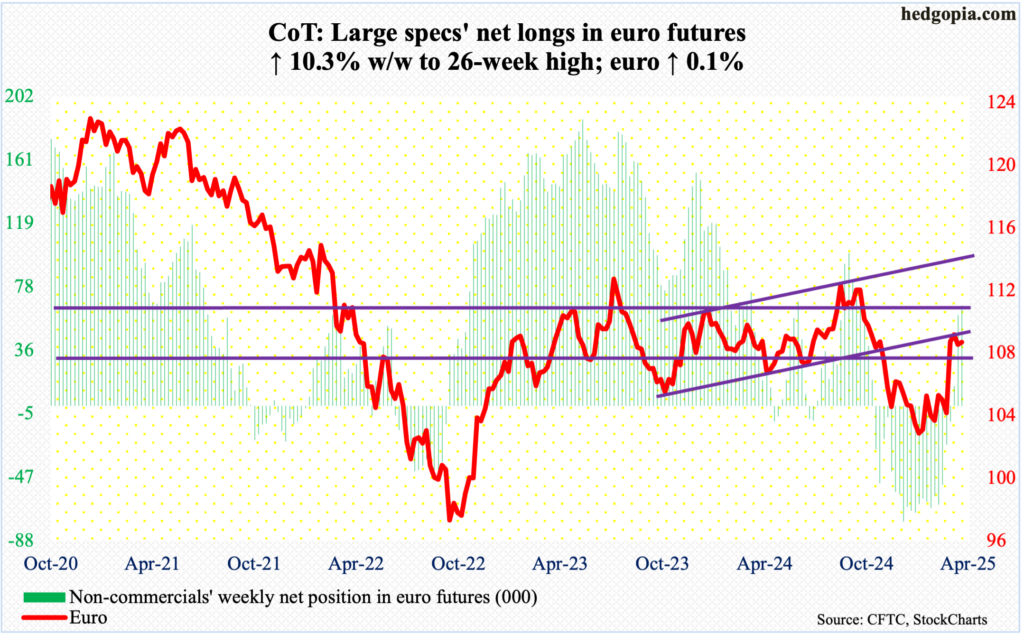
The euro fell for six consecutive sessions before attracting bids at the flattish 200-day ($1.0731) on Wednesday. For the week, it edged up 0.15 percent to $1.0831.
Earlier, euro bulls had to endure rejection at $1.09s, with last week’s high of $1.0955 following the prior week’s $1.0947. Difficulty there arose after a decent two-month rally.
Even earlier, the currency fell sharply starting September 30th last year following trouble at $1.12 for six consecutive weeks. Then, it began to stabilize early this year around $1.02s, which was defended for a whole month.
For now, the euro is stuck between $1.09s and resistance-turned-support at $1.05, which goes back at least a decade and which was reclaimed 21 sessions ago.
Gold: Currently net long 249.8k, down 8.1k.
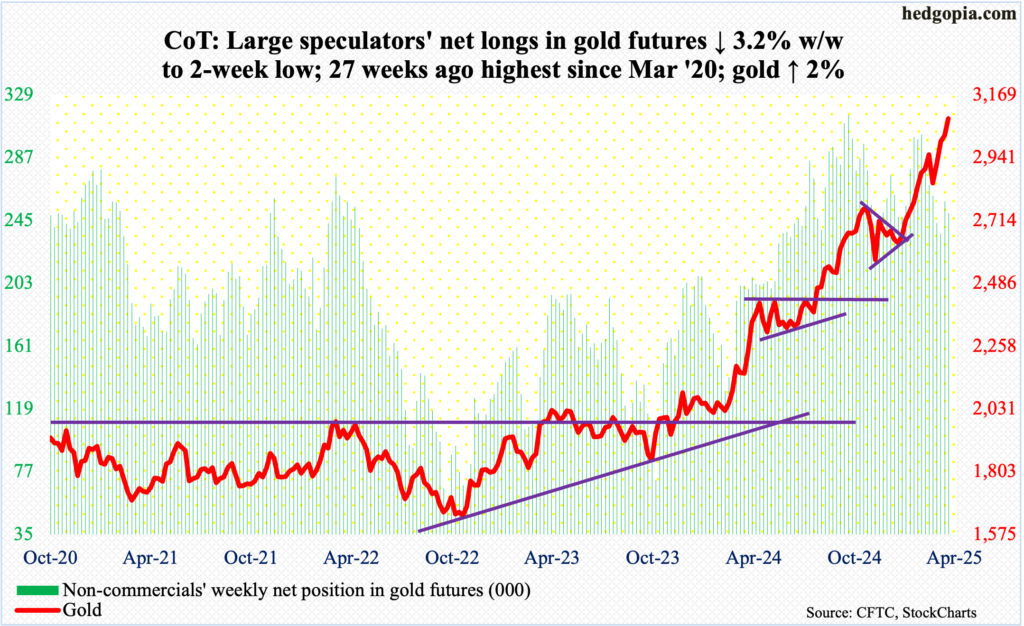
As unreal as it may sound, gold has now rallied for 12 out of the last 13 weeks. This week, it added a couple of percent to $3,082/ounce, closing near Friday’s session high $3,086. The yellow metal has been rallying since ticking $2,608 on December 30th last year.
Not surprisingly, gold is extended on nearly all timeframes. It has just about gone parabolic for a year now. In February last year, the yellow metal touched $1,984. Gold bugs have done an excellent job of sustaining the up momentum, aided by breakouts followed by successful retests. This Friday, gold broke out of short-term resistance at $3,050s. In the event of selling pressure near term, this is the one to watch for now. After that lies $3,000 and $2,960s-70s.
Nasdaq (mini): Currently net long 8.7k, down 14.3k.
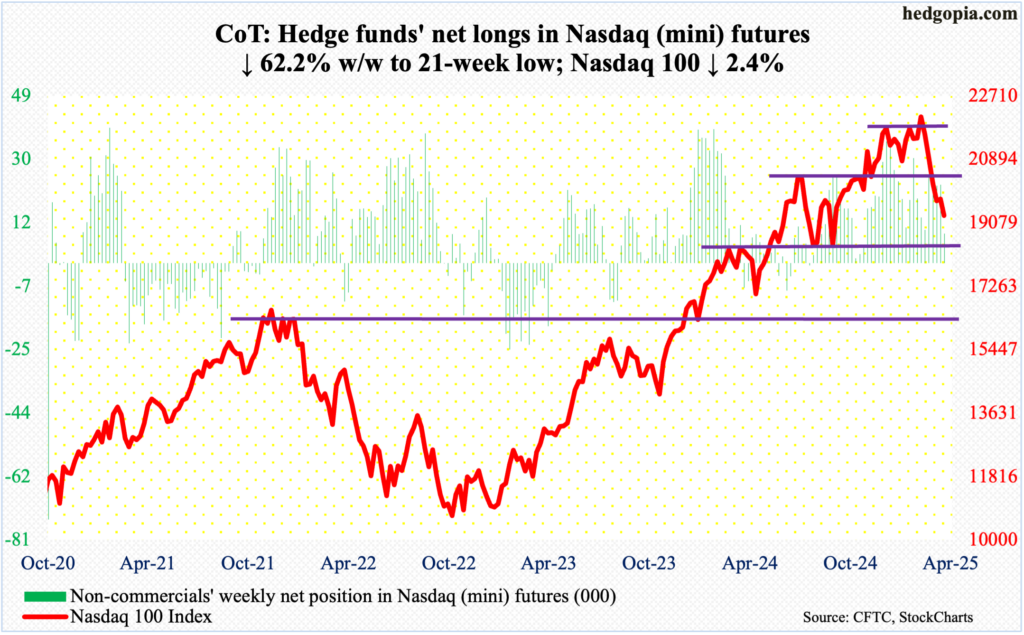
Up 2.7 percent for the week at Tuesday’s intraday high of 20292, the Nasdaq 100 reversed hard the next three sessions to end 2.4 percent lower to 19281. Barring last week’s rise of 0.25 percent, this was the fifth down week in the last six.
Earlier, from the February 18th all-time high of 22223 to the March 13th low of 19153, the tech-heavy index dropped 12.8 percent. That low is merely 0.7 percent away.
Rally attempts this week in the first two sessions faced massive resistance at the flattish 200-day (20316). If the March 13th low gets breached, it is likely to trigger stop-loss selling, eventually resulting in the average sustain lower. The 50-day is already pointing lower; this is also the case with the S&P 500.
Russell 2000 mini-index: Currently net short 15.3k, up 5.1k.
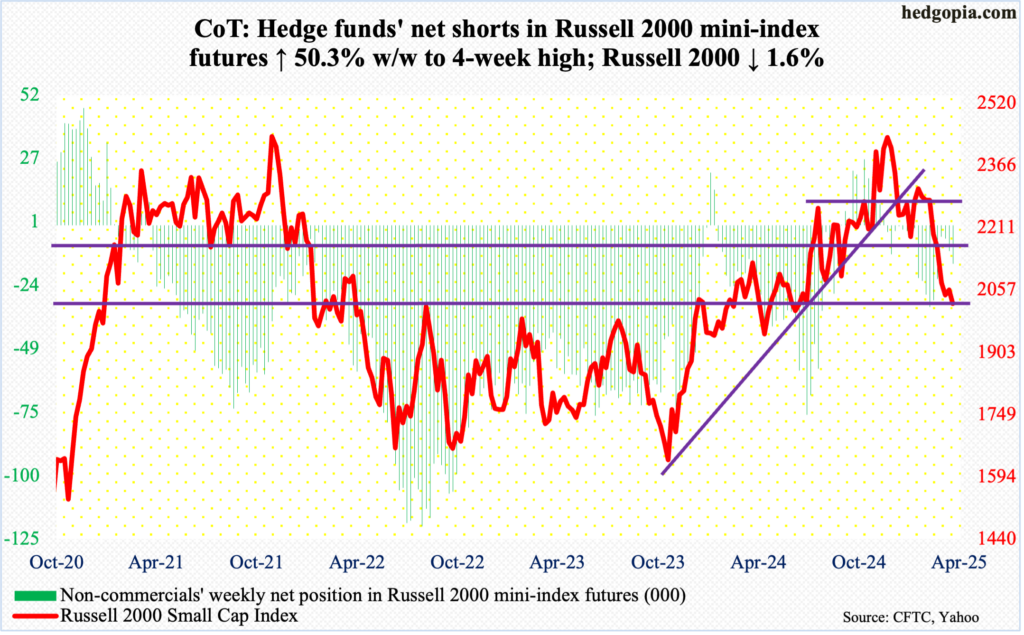
In the first week of this month, breakout retest at 2100, which the Russell 2000 broke out of last July, with a successful retest in September, failed. Subsequently, the small cap index dropped as low as 1985 on the 13th. By then, it was down 19.5 percent from November 25th (last year) when a new all-time high of 2466 scraped past the prior high of 2459 from November 2021.
This week, the Russell 2000 was stopped at that resistance Monday through Wednesday, with session highs of 2111, 2110 and 2104, in that order. Small-cap bulls were unable to cling on to those highs. By the end of the week, the index declined 1.6 percent to 2023; the March 13th low of 1985 has now gained in significance. This needs to hold. Else, the death cross – 50-day (2183) and 200-day (2204) – that just completed can begin to impact sentiment.
US Dollar Index: Currently net long 7.5k, up 280.
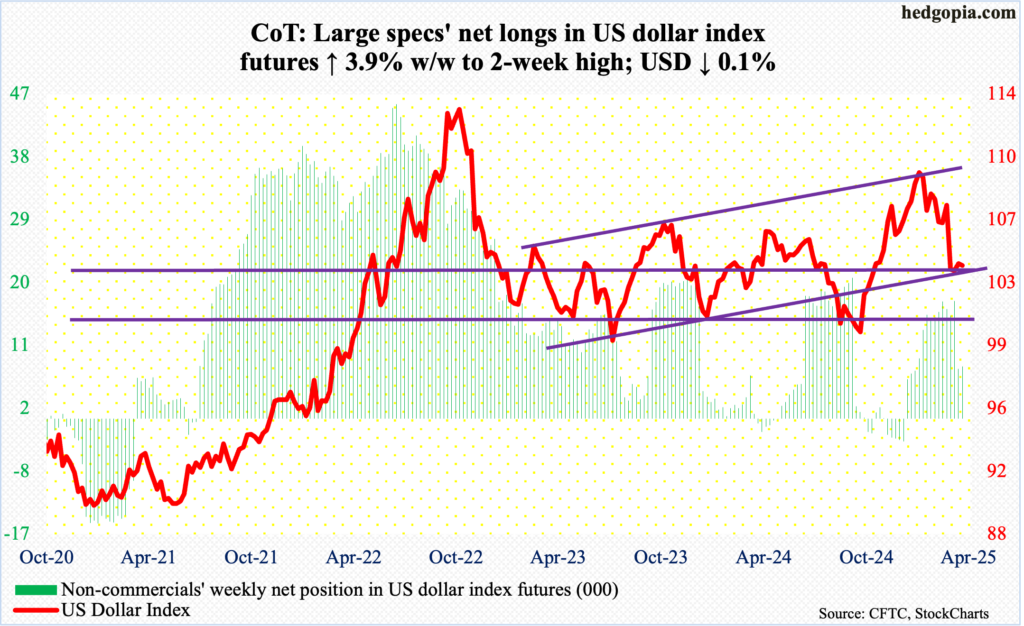
The US dollar index could be itching to go lower. In the prior two weeks, dollar bulls were able to stop selling pressure at 103.20s, but this did not amount to much. This week, the index fell 0.1 percent to 104.01, with Thursday’s session high of 104.65. Just above at 104.93 rests the 200-day.
Previously, the index peaked on January 13th at a two-plus-year intraday high of 110.18. In the sessions ahead, 103.20s hold the key.
VIX: Currently net short 9k, up 15.2k.
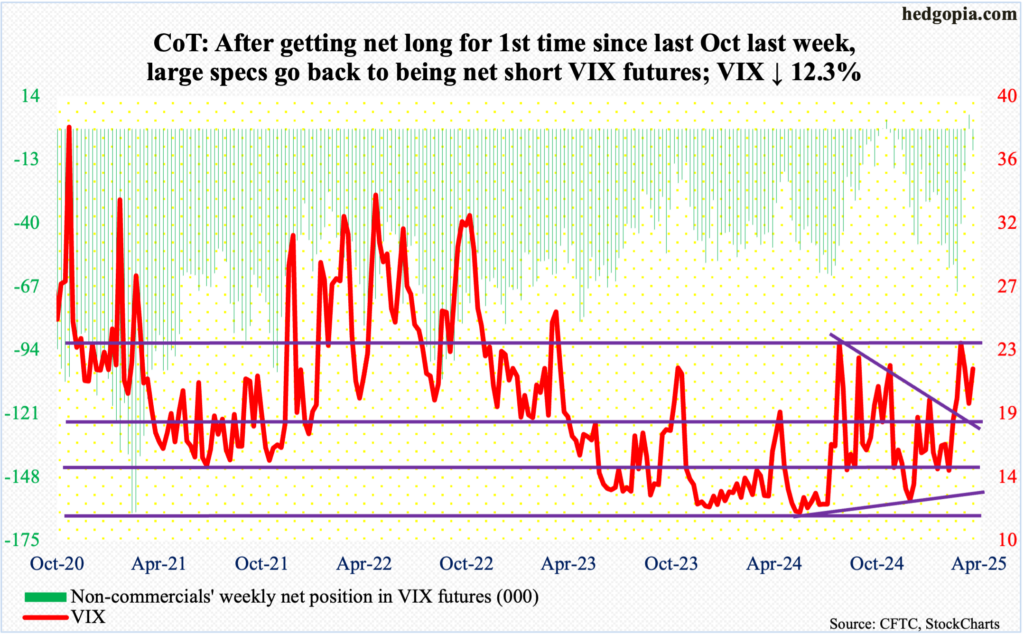
VIX was volatile, to say the least, with a high of 22.18 on Friday and a low of 16.97 on Wednesday, closing the week up 2.37 points to 21.65.
Previously, on March 10th and 11th, the volatility index ticked 29.56 and 29.57 respectively before coming under pressure. Volatility bulls defended the 200-day (17.37) this week, also reclaiming the 50-day at 18.72.
There is room for continued strength in the sessions ahead.
Thanks for reading!
