
Following futures positions of non-commercials are as of Feb 24, 2026.
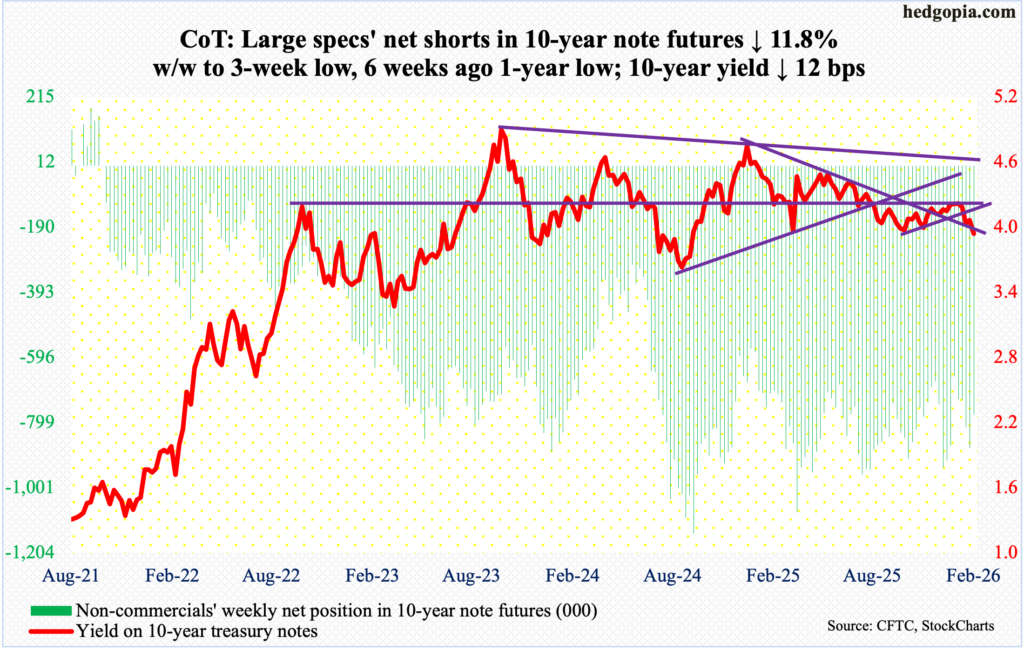
10-year note: Currently net short 774k, down 103.8k.
ISM manufacturing activity in January entered expansion territory for the first time in 11 months. The job market could be stronger, with an average 15,000 non-farm jobs added each month last year, but real GDP grew 2.2 percent in 2025, slower than 2024’s 2.8 percent pace but strong enough to show that the economy is hanging in there. You would not know this economic resiliency looking at the long end of the treasury yield curve.
This week, the 10-year T-yield gave back 12 basis points to slide under four percent. Rates gapped down Friday to close at 3.96 percent. This is not what non-commercials are positioned for. Heavily net short 10-year note futures, they are betting on/hoping for higher rates. In February alone, the 10-year dropped 28 basis points.
Back in October 2023, yields peaked at five percent and have consistently made lower highs. There is consistent bid under these notes. Bond vigilantes seem to be preparing for a nasty curveball to come out of somewhere, even as technically the 10-year has approached a crucial level. It will be considered a major breakdown should bond bears (on price) are unable to decisively defend 3.90s.
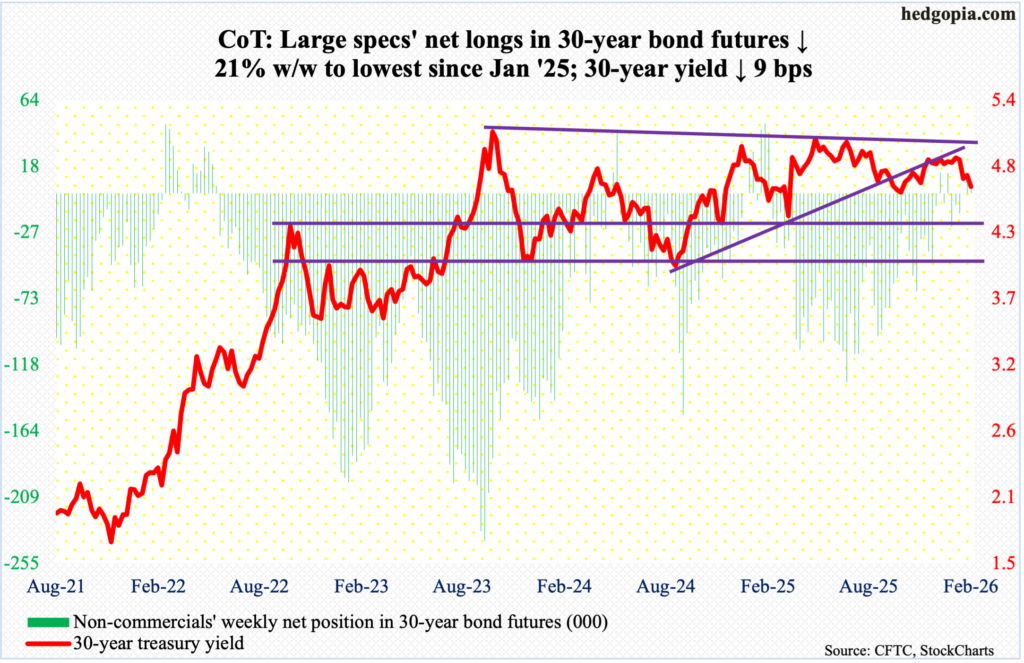
30-year bond: Currently net long 5.1k, down 1.4k.
Major US economic releases for next week are as follows.
The ISM manufacturing index (February) is due out Monday. Manufacturing activity in January jumped 4.7 percentage points month-over-month to 52.6 percent. This is the first reading of 50 percent or higher in 11 months.
Wednesday brings the ISM services index (February). Non-manufacturing activity remained unchanged m/m in January at 53.8 percent, which is the highest reading since registering 55.5 percent in October 2024.
Labor productivity (4Q25) and factory orders (January) are scheduled for Thursday.
Non-farm output per hour in the September quarter grew at a four-quarter high 1.9 percent year-over-year.
Orders for non-defense capital goods ex-aircraft – proxy for business capex plans – increased 0.8 percent m/m in December to a seasonally adjusted annual rate of $79.2 billion, which set a fresh high.
Payrolls (February) and retail sales (January) will be published on Friday.
In January, the economy created 130,000 non-farm jobs. Prior months were revised lower to show that in 2025 only 15,000 jobs were added each month; this compares with a monthly average of 122,000 in 2024, 210,000 in 2023 and 377,000 in 2022.
December retail sales of $735 billion inched lower 0.02 percent from November’s record $735.1 billion.
WTI crude oil: Currently net long 194.5k, down 16.2k.
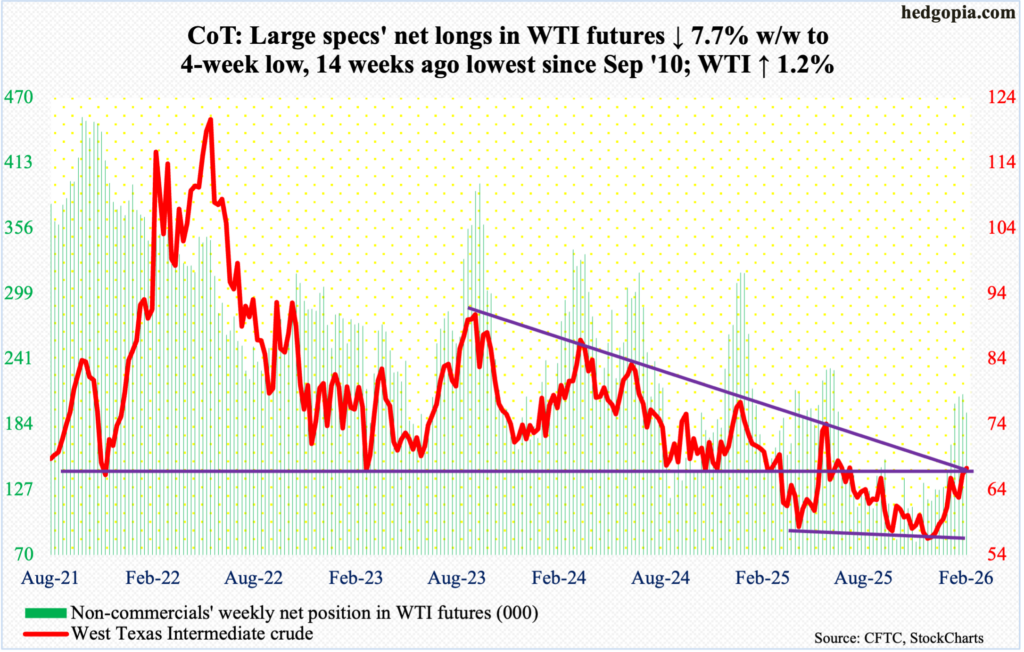
Amidst overbought weekly conditions, West Texas Intermediate crude this week snuck a peek at dual resistance at $65-$66, finishing up 1.2 percent to $67.29/barrel.
Horizontal resistance at $65-$66 goes back many years. Right around there also lies a falling trendline from March 2022 when the crude hit $126.42 intraday and reversed lower.
In late December-early January, WTI bottomed at $56, which going back to at least last April has consistently drawn bids. This was followed by eight out of 10 up weeks.
If it turns out this week’s feeble breakout is genuine, then nearest resistance lies at $74-$75. Else, oil bulls will be forced to defend $65-$66 retest.
In the meantime, as per the EIA, US crude production in the week to January 20th decreased 33,000 barrels per day week-over-week to 13.702 million b/d; output registered a record 13.862 mb/d in the week to November 7 last year. Crude imports increased 135,000 b/d to 6.7 mb/d. As did stocks of crude and distillates, which respectively grew 16 million barrels and 252,000 barrels to 435.8 million barrels and 120.4 million barrels; gasoline inventory dropped one million barrels to 254.8 million barrels. Refinery utilization contracted 2.4 percentage points to 88.6 percent.
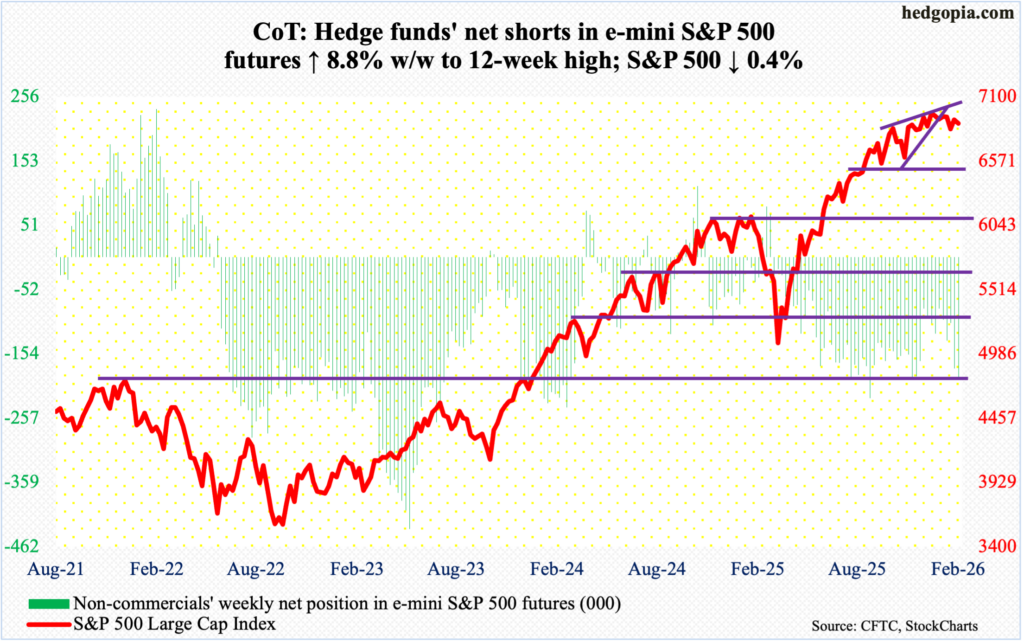
E-mini S&P 500: Currently net short 193.5k, up 15.7k.
Both bulls and bears could arguably claim victory this week.
The S&P 500 shed 0.4 percent to 6879, but 6800 did draw bids both Monday and Tuesday, with a low of 6815. Concurrently, come Wednesday, the session high 6953 kissed the falling trendline from 28 January when the large cap index posted a new all-time high 7002, and sellers came out in droves. By Friday, the index was pushed back below the 50-day moving average at 6900.
For the week, a spinning top was formed. This was the fourth time this candle had shown up in the last seven weeks. As a matter of fact, it can be argued that the S&P 500 has been sideways since late October when it tagged 6920s. The sideways move followed a massive rally from last April when the index bottomed at 4835.
Bulls’ consolation is that 6770s, which goes back nearly five months, remains intact. A breach, which is a matter of when not if, will open the door to an eventual test of lateral support at 6500s, which lines up with the 200-day at 6560.
Importantly, on the monthly, February finished with a spinning top, which also showed up in December and January. This was preceded by November’s hanging man.
Euro: Currently net long 156.9k, down 17.6k.
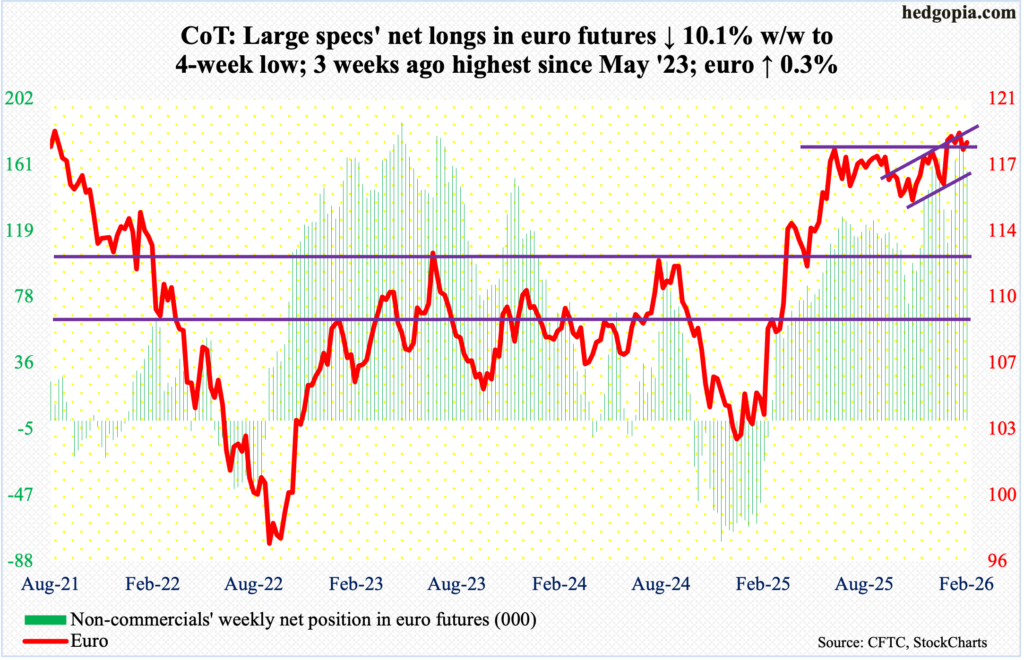
After January’s rather large monthly spinning top, February produced the same candle, only small. Last month’s range was a high of $1.193 and a low of $1.174, ending lower 0.3 percent to $1.182; for the week, the euro gained by as much.
Despite a four-and-a-half-year high $1.208 reached on 27 January, the euro has essentially straddled $1.18, or just north of it, since at least last June. In January last year, the euro bottomed at $1.018. One year later, it ticked $1.208; in the week in which that high was attained, a gravestone doji, which is a bearish pattern, developed.
There is room for the daily to rally, but mid- to long-term, the path of least resistance is down.
Gold: Currently net long 159.2k, down 738.
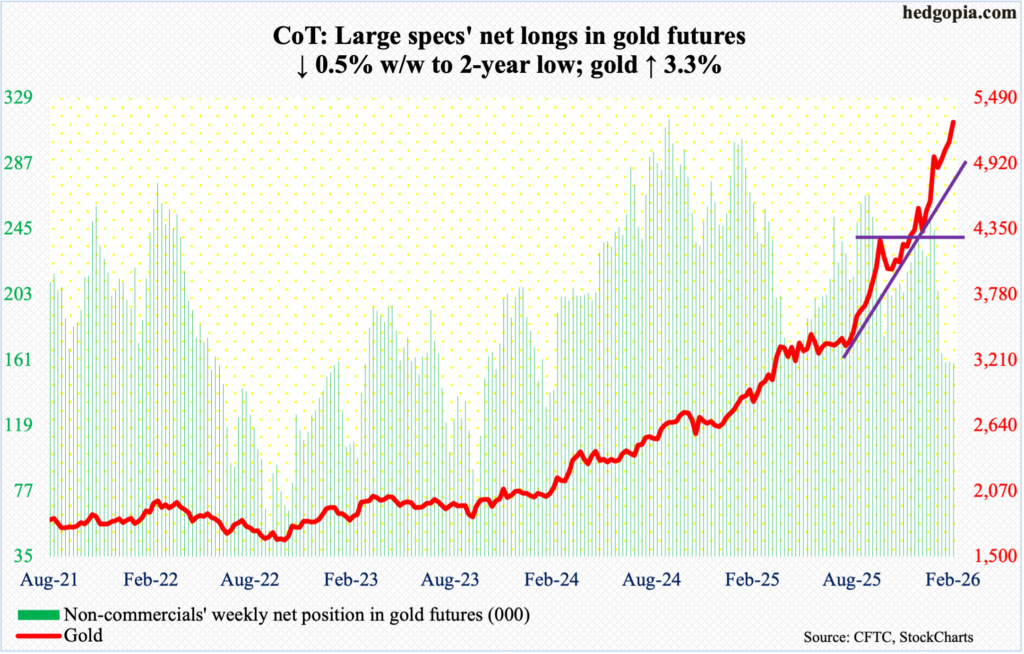
January produced a candle with a large wick. February produced a similar candle, except the rather large wick is on the other end, helping form what looks like a hanging man. For the month, gold jumped eight percent to $5,278/ounce, with the week adding 3.3 percent.
The yellow metal has now rallied for seven months in a row; in fact, over 29 months, there have only been five down months. In October 2023, gold bottomed at $1,810.
On 29 January, gold ticked $5,608 intraday but only to then quickly drop to $4,405 two trading sessions later on 2 February. It has since risen. Defense of horizontal support at $4,370s four weeks ago has continued to bear fruits for gold bugs. A loss of $4,370s will open the door to the next layer of support at $3,900, and then $3,440s.
But for now, gold bulls are not worried about that. They will do their best to first get as close as possible to the January high.
Nasdaq (mini): Currently net long 10.8k, down 13.6k.
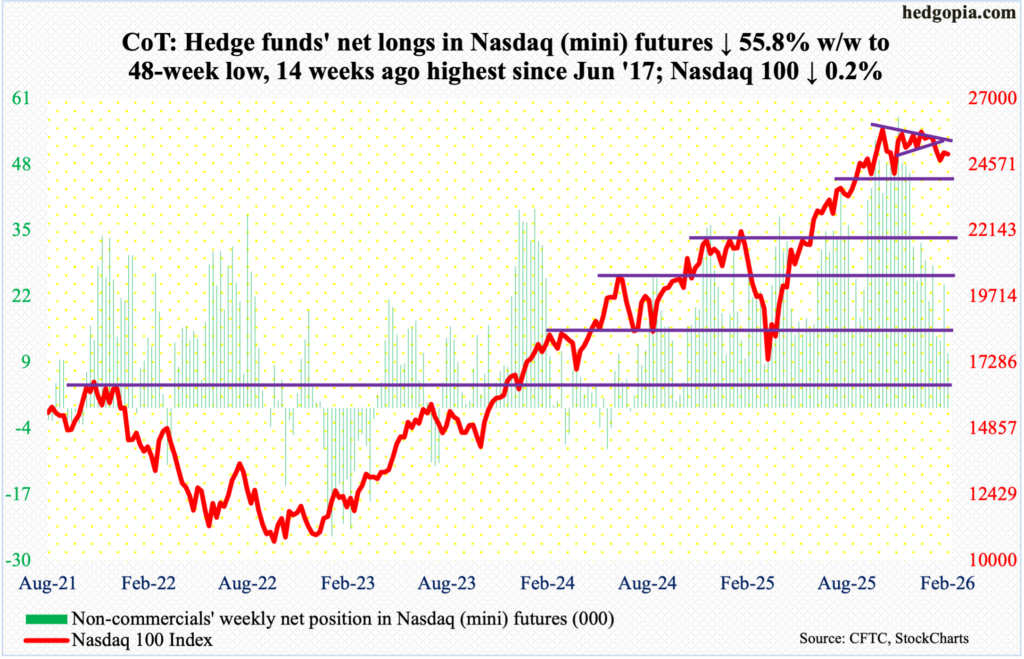
The Nasdaq 100 has been under the 50-day (25311) since the 3rd (this month). Tech bulls’ attempt to reclaim the average failed this week, although the index did nudge its head out of it on Wednesday. By Friday, it lost 0.2 percent for the week to 24960, for a weekly spinning top.
Bulls were also denied on 28 January when the Nasdaq 100 came within 17 points of the all-time high 26182 recorded on 29 October. Earlier, it shot up 58 percent between the intraday low of 16542 on 9 April and the October high. A symmetrical triangle from that high broke to the downside four weeks ago.
At some point, the Nasdaq 100 looks headed for the 200-day, which is not that far away at 24106. In this scenario, bulls would have then lost straight-line support at 24500s.
Russell 2000 mini-index: Currently net short 2.9k, down 4.2k.
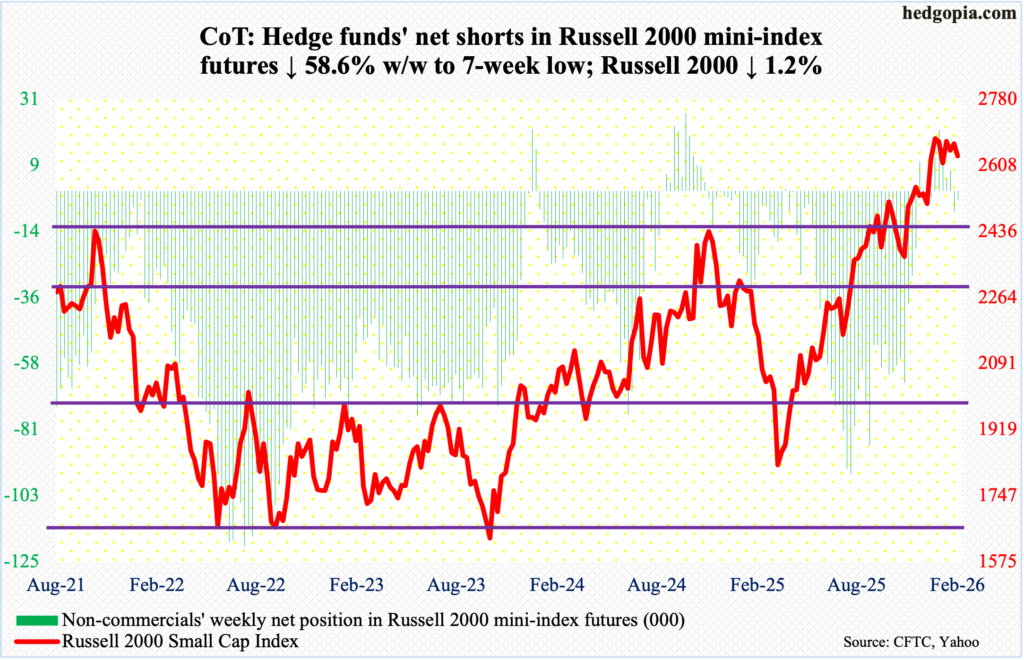
The Russell 2000 just completed three weekly spinning tops in a row. This week, it gave back 1.2 percent to 2632, with a high of 2680 and a low of 2601. This is the eighth consecutive week the small cap index has gone sideways since breaking out of 2540s, followed by a breakout retest three weeks ago.
Earlier on 22 January, the Russell 2000 reached a record 2735, followed by a tag of 2706 three weeks ago. Positive momentum has lost steam post-2540s breakout, although if this level remains intact – followed by another crucial retest at 2460s – bulls can always hope that they can rebuild momentum.
For now, since the January peak, the index has made lower highs, with the 50-day (2615) providing support underneath. Once the average gives way, a test of 2540s is the next stop.
US Dollar Index: Currently net short 1.8k, up 2.1k.
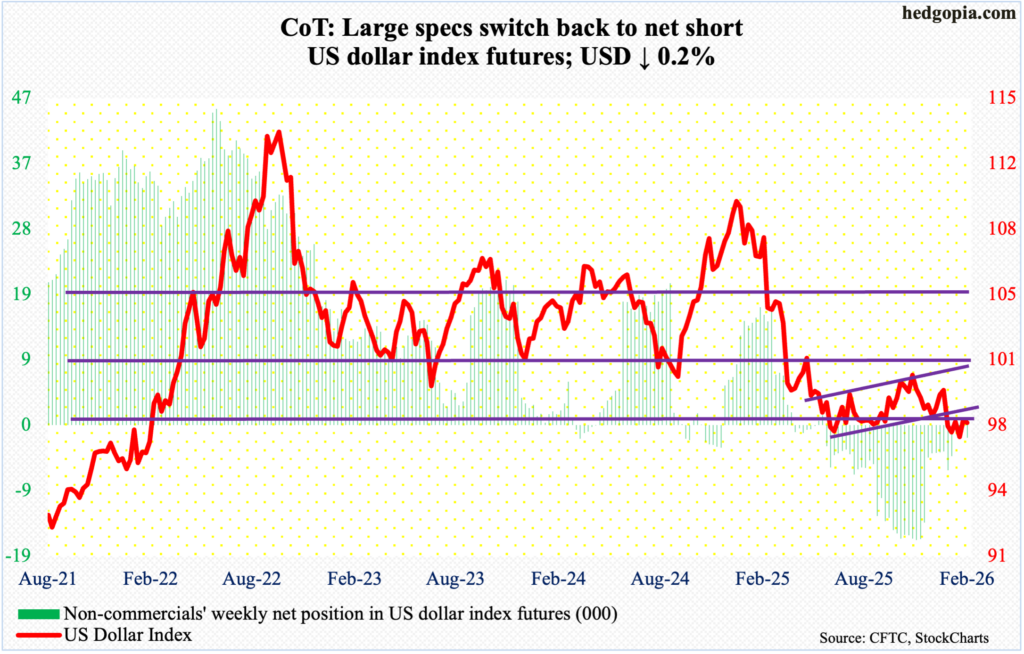
Once again, sellers were quick to show up at 98, which has provided stiff resistance in three of the last four weeks. This week, the US dollar index kissed the price point three times intraday, Tuesday through Thursday, to no avail. In the end, it dropped 0.2 percent for the week to 97.64.
In January last year, after a three-plus-month rally, the index reversed hard at 110.18, subsequently reaching 96.38 in June and successfully testing that low with a lower low 96.22 in September. On 27 January, another lower low 95.55 was ticked, and that was embraced by dollar bulls, ending the week with a weekly dragonfly doji.
Dollar bulls need to recapture 98 before they can eye resistance just north of 100, which goes back more than a decade.
VIX: Currently net short 54.9k, down 17k.
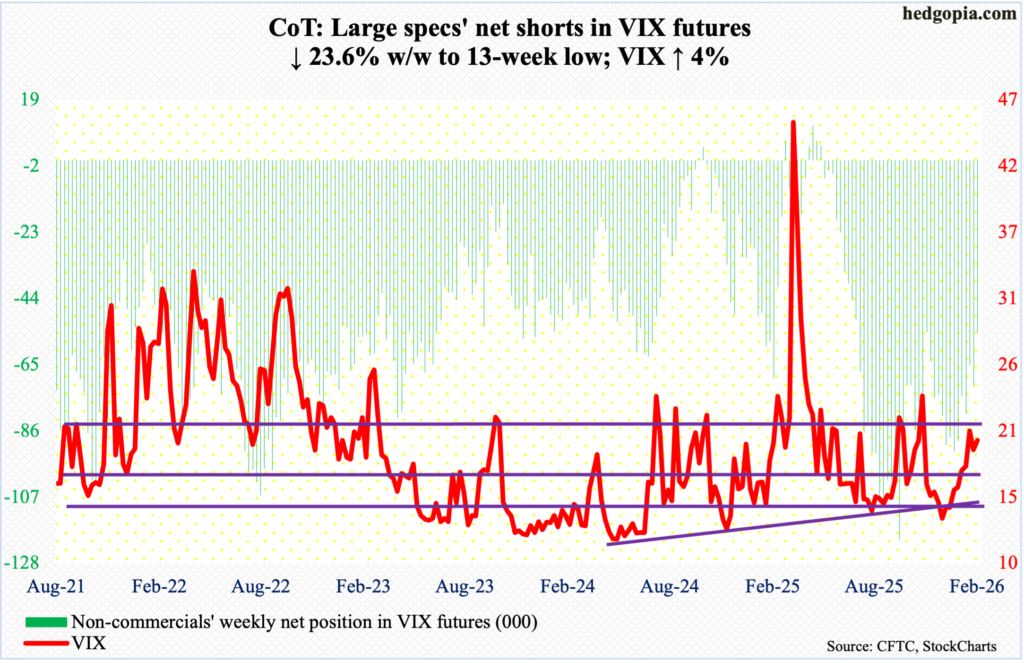
Yet again, a rising trendline from Christmas Eve when VIX ticked 13.38 intraday was defended this week, with an intraday tag of 17.50 on Thursday. But at the same time, Friday’s high 21.74 was given away, as the volatility index closed at 19.86, up 0.77 points for the week.
From 20 January, VIX traded north of 20 intraday in 16 sessions, with a high of 23.10 on the 5th, but only for momentum to soon peter out. It just feels like suppressed upside energy is accumulating. Concurrently, both the 50- and 200-day (16.97 and 17.27 respectively) are rising, and a golden cross seems to be in the making, in which case volatility should rise.
Thanks for reading!
