
Following futures positions of non-commercials are as of March 3, 2026.
10-year note: Currently net short 654.5k, down 119.5k.
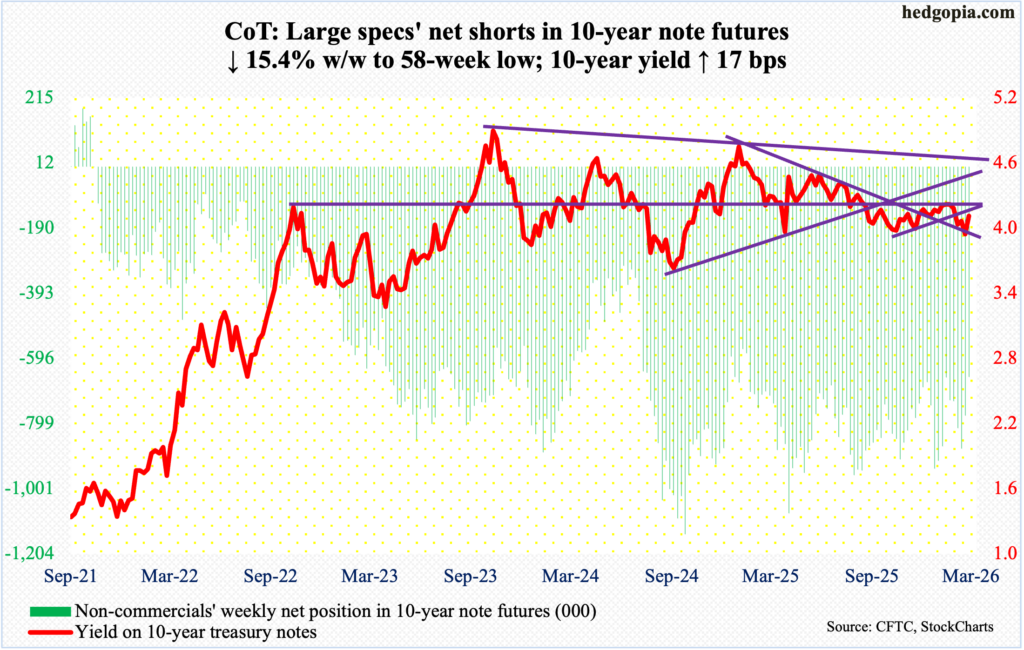
February pulled a surprise, as the economy unexpectedly lost 92,000 jobs, even as January and December were revised lower by a combined 69,000; the unemployment rate ticked up from January’s 4.3 percent to 4.4 percent. Any other time, markets would probably react to this by immediately raising the odds of more rate cuts than going into the print, but not this time.
Futures traders went from pricing in two 25-basis-point cuts in the fed funds rate this year pre-jobs report to only one after. They now expect a cut in September, while December odds are less than 50 percent. The rather sanguine outlook for easing is also reflected in how the rates-sensitive small-caps traded on Friday when the Russell 2000 dropped 2.3 percent. Often, small-caps would rally on a dismal jobs report on hopes of more easing by the Federal Reserve.
But these are not normal times. West Texas Intermediate crude went from $67.02/barrel last Friday to $91.27 this Friday. The over-the-weekend strikes by the U.S. and Israel on Iran, and the resultant spike in energy prices, will end up forcing the Fed to sit on their hands the longer the possible. The jump in oil prices is set to renew inflation risks, and global central banks are having to reassess their rates trajectory. The Fed, with a dual mandate of price stability and maximum employment, is caught between a rock and a hard place.
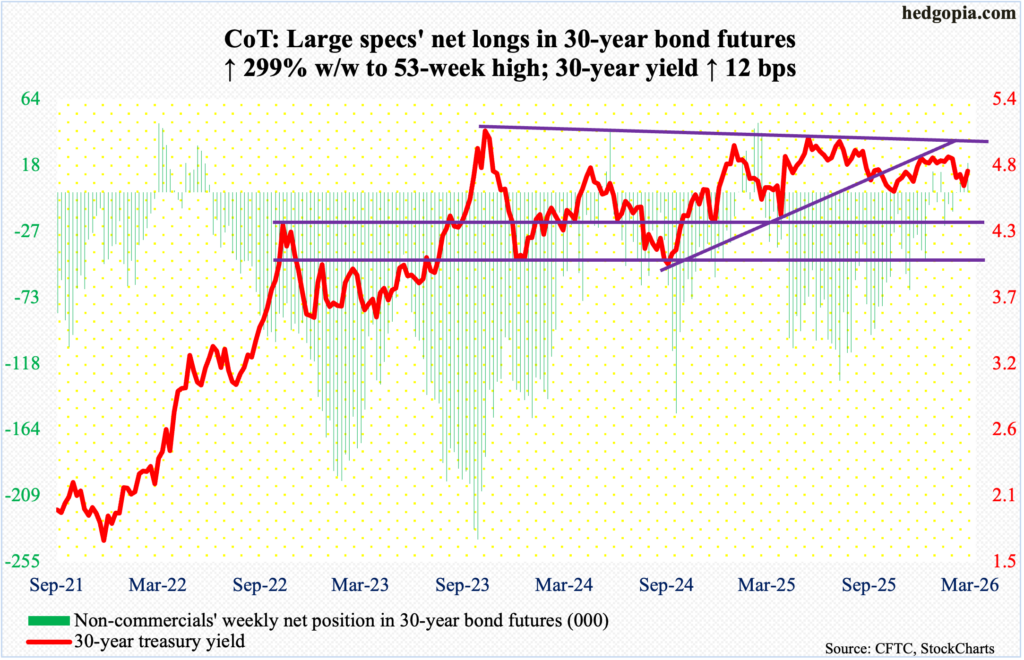
30-year bond: Currently net long 20.3k, up 15.2k.
Major US economic releases for next week are as follows.
The NFIB optimism index (February) and existing home sales (February) are scheduled for Tuesday.
Small-business optimism shrank two-tenths of a point month-over-month in January to 99.3 – a two-month low.
January sales of existing homes tumbled 8.4 percent m/m to a seasonally adjusted annual rate of 3.91 million units. This was a 16-month low.
Wednesday brings the consumer price index (February). In the 12 months to January, headline and core CPI rose 2.4 percent and 2.5 percent respectively. Last April’s 2.3-percent increase was the lowest since February 2021, while January’s core reading was the lowest since March that year.
Housing starts (January) are due out Thursday. Starts in December increased 6.2 percent m/m to 1.4 million units (SAAR) – a five-month high.
Real GDP (4Q25, first revision), personal income/spending (January), durable goods orders (January), job openings (JOLTs, January) and University of Michigan’s consumer sentiment index (March, preliminary) are on schedule for Friday.
The economy grew 1.4 percent annually in the December quarter, the first print showed. This represents quite a deceleration from the 3Q pace of 4.4 percent and 2Q’s 3.8 percent.
From a year ago, headline and core PCE (personal consumption expenditures) in December rose 2.9 percent and three percent, in that order. This was the quickest pace since March 2024 and April that year respectively.
Orders for non-defense capital goods ex-aircraft – proxy for business capex plans – grew 0.8 percent m/m in December to $79.2 billion (SAAR), which set a record.
Non-farm job openings dropped 386,000 m/m to 6.54 million, which was the lowest since September 2020. Openings peaked at 12.1 million in March 2022.
February consumer confidence inched up two-tenths of a point m/m to 56.6 – a six-month high.
WTI crude oil: Currently net long 192.1k, down 2.4k.
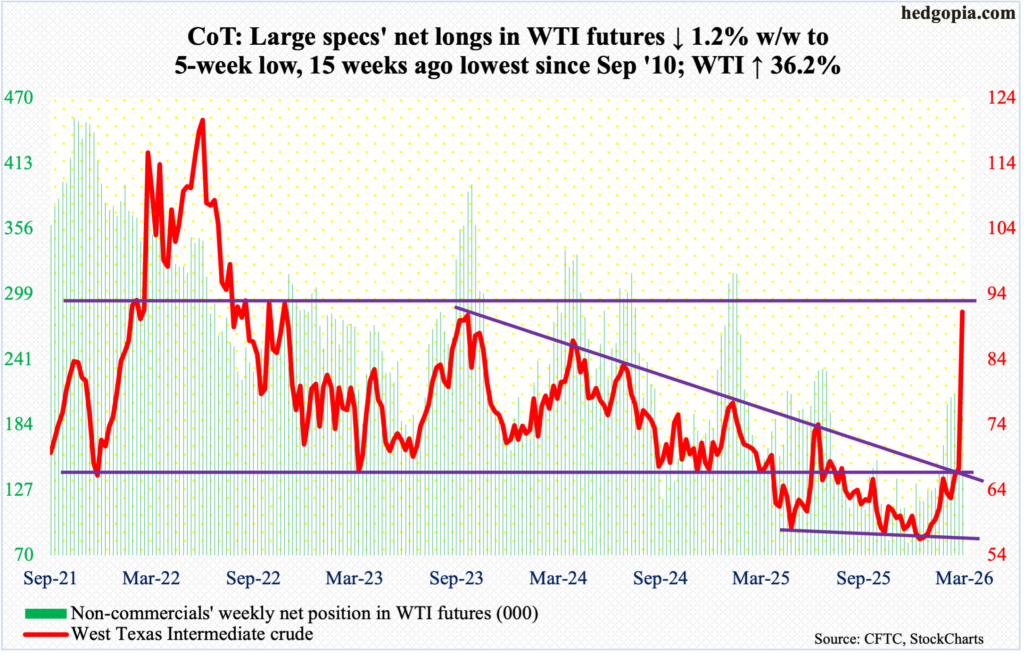
The Middle East conflict continues, and oil is reacting. West Texas Intermediate crude shot up 36.2 percent this week to $91.27/barrel, opening the week with Monday’s gap-up and ending with Friday’s attempt to take out an important price point. In September 2023, the crude tagged $92.48 and peaked; this high was tested Friday with a high of $92.68, with the week closing a little under that.
If $92 and change, the importance of which goes back many years, decisively gives way, then oil bulls will be eyeing the March 2022 high of $126.42. A falling trendline from that high was convincingly broken to the upside this week.
Earlier, in late December-early January, WTI bottomed at $56, which going back to at least last April has consistently drawn bids. This was followed by nine out of 11 up weeks.
In the meantime, as per the EIA, US crude production in the week to February 27 decreased 6,000 barrels per day week-over-week to 13.696 million b/d; output registered a record 13.862 mb/d in the week to November 7 last year. Crude imports declined too, down 335,000 b/d to 6.3 mb/d. As did gasoline inventory, which fell 1.7 million barrels to 253.1 million barrels. Stocks of crude and distillates went the other way, up 3.5 million barrels and 429,000 barrels to 439.3 million barrels and 120.8 million barrels respectively. Refinery utilization rose six-tenths of a percentage point to 89.2 percent.
E-mini S&P 500: Currently net short 168.2k, down 25.3k.
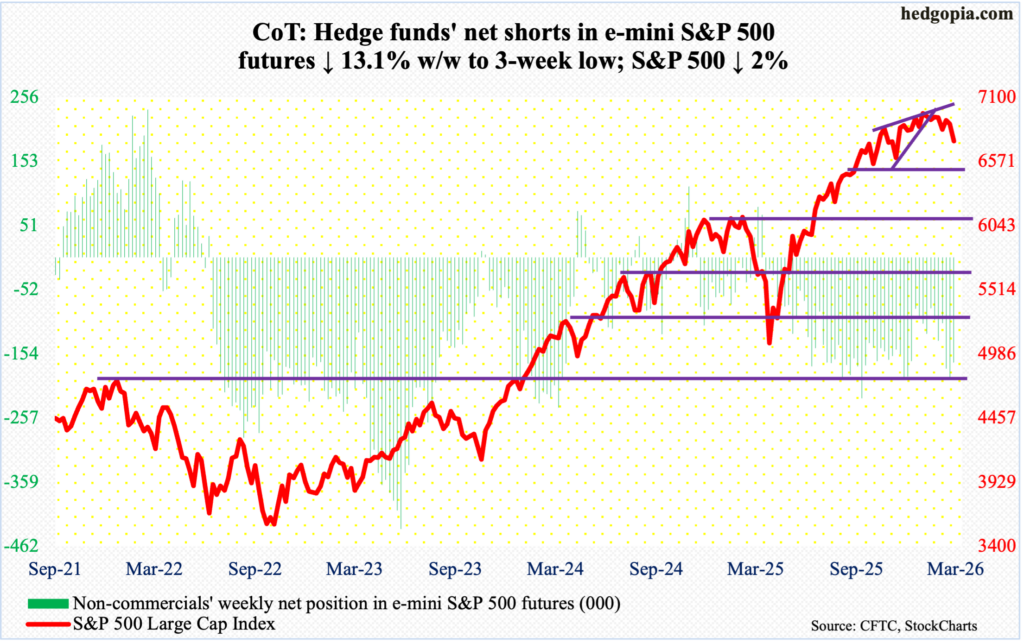
Equity bulls could no longer defend 6800. The S&P 500 dropped two percent this week to 6740.
Last week’s high 6953 kissed a falling trendline from 28 January when the large cap index posted a new all-time high 7002, attracting sellers. Selling continued this week.
This follows last week’s fourth weekly spinning top in seven weeks. On the monthly, February, January and December all produced a spinning top, preceded by November’s hanging man. Earlier in April last year, the S&P 500 bottomed at 4835.
Up until this week, bulls’ consolation was that 6770s, which goes back nearly five months, remained intact. This support has now been breached, albeit nominally.
The 200-day (6583) has not been tested since last May, and one seems imminent. Right around there lies horizontal support at 6550s. If bulls fail to defend this, bears in due course could lay their eyes on 6100s.
Euro: Currently net long 136.5k, down 20.4k.
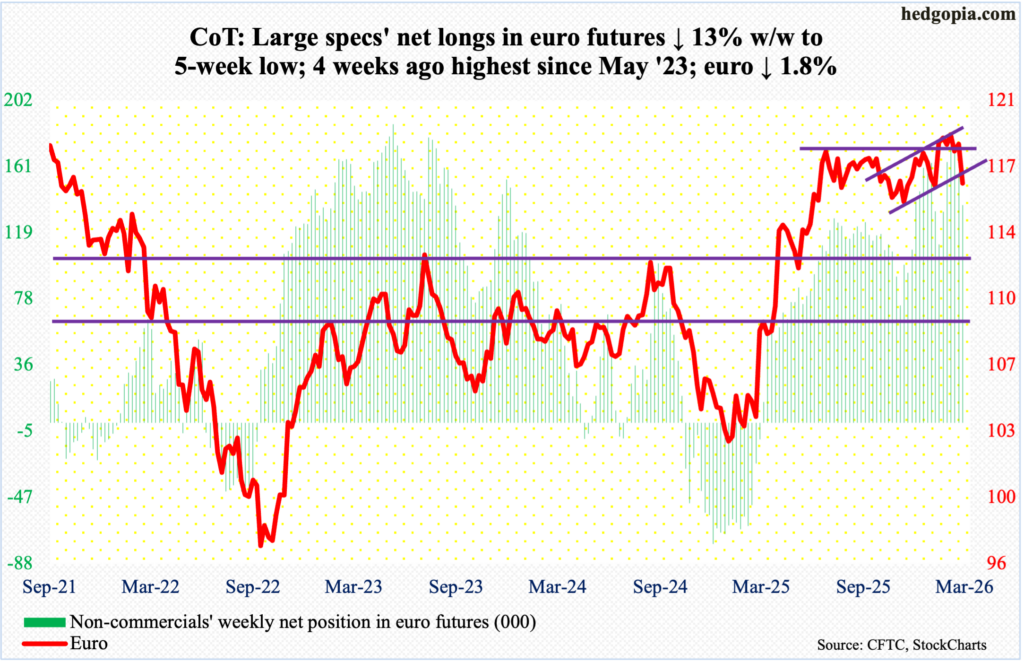
Both January and February produced a monthly spinning top, with the former a very large one. On 27 January, the euro tagged a four-and-a-half-year high $1.208 and reversed lower. In January last year, the euro bottomed at $1.018.
Heading into this week, the currency essentially straddled $1.18, or just north of it, since at least last June. This was compromised this week, as the euro declined 1.8 percent to $1.161. Both the 50- and 200-day were breached ($1.176 and $1.168 respectively). Once last November’s low $1.147 gives way, euro bears will begin to eye $1.11-$1.12.
Gold: Currently net long 160.1k, up 968.
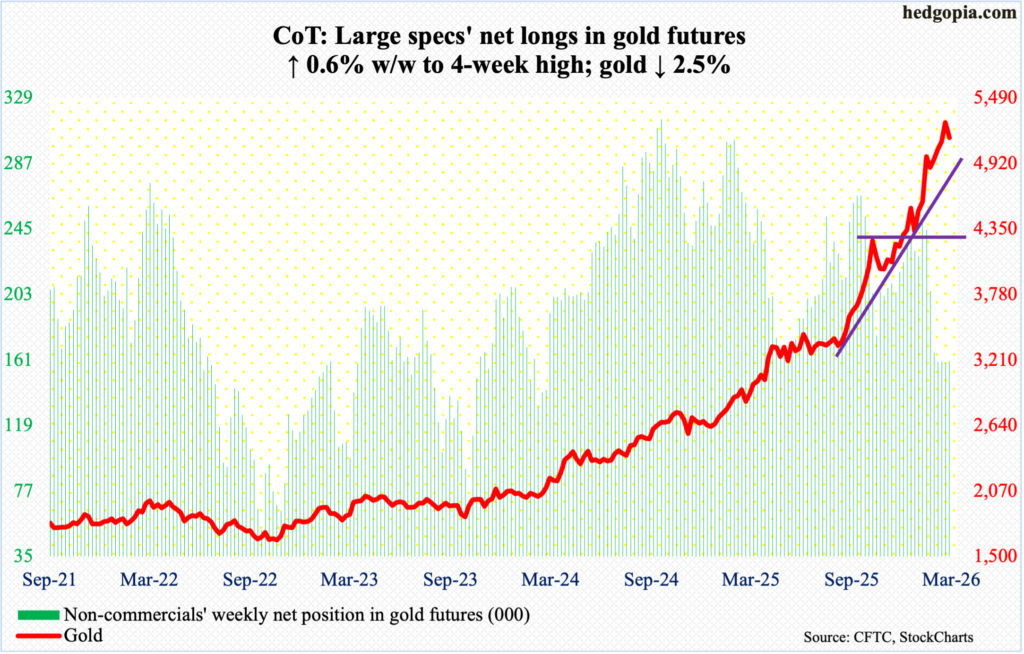
In February, gold’s monthly RSI hit just under 97. That is how extended momentum is. Last Friday, the metric closed at 90 and needs to go a lot lower to unwind the overbought condition it is in. March is young, and the metal is down 2.5 percent to $5,144/ounce. If this weakness holds for the rest of the month, this would be the first monthly drop in eight months; in fact, over 29 months, there have only been five down months. In October 2023, gold bottomed at $1,810.
This week’s high of $5,419 represents a lower high versus the record $5,608 posted on 29 January. Right after that high, gold bugs were forced to defend horizontal support at $4,370s. In due course, they will be asked to repeat that feat. When that happens, the 50-day ($4,856), which is sharply rising, will have been lost. A loss of $4,370s will open the door to the next layer of support at $3,900, and then $3,440s.
Nasdaq (mini): Currently net long 2.4k, down 8.4k.
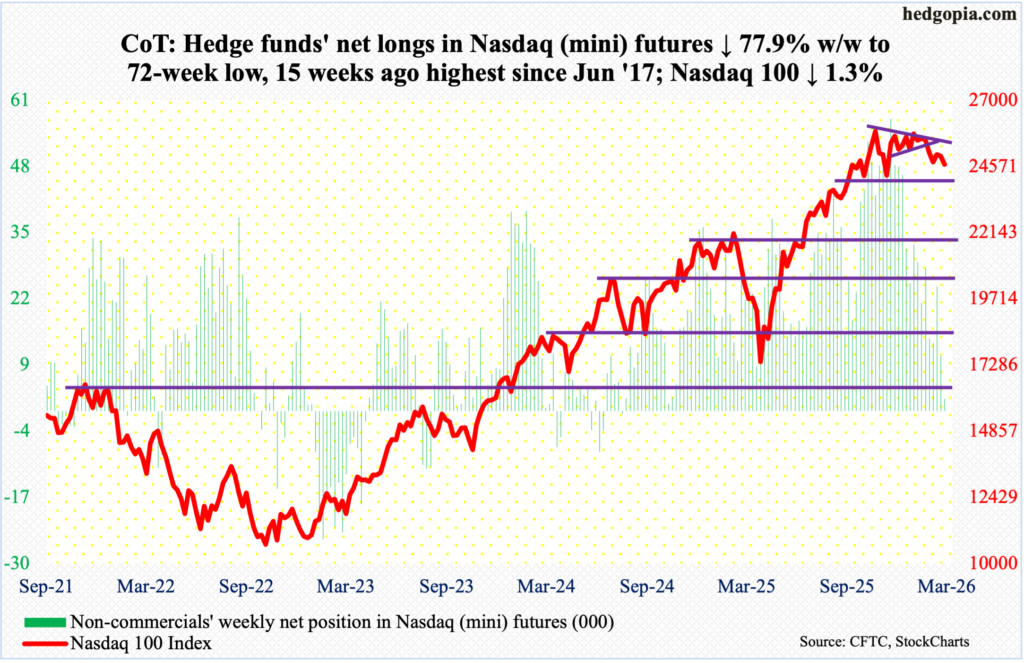
The Nasdaq 100 fell as low as 24316 on Tuesday, breaching straight-line support at 24500, but managed to rally enough to avoid that breakdown, but not enough to prevent a weekly drop of 1.3 percent to 24643.
For the second week in a row, a weekly spinning top showed up on the weekly. Tech bulls have been on the receiving end since 28 January when the Nasdaq 100 came within 17 points of the all-time high 26182 recorded on 29 October.
The Nasdaq 100 has been under the 50-day (25288) since 3 February. Earlier, it shot up 58 percent between the intraday low of 16542 on 9 April and the October high. A symmetrical triangle from that high broke to the downside five weeks ago.
The 200-day at 24195 is within earshot, and a test seems imminent.
Russell 2000 mini-index: Currently net short 6.8k, up 3.9k.
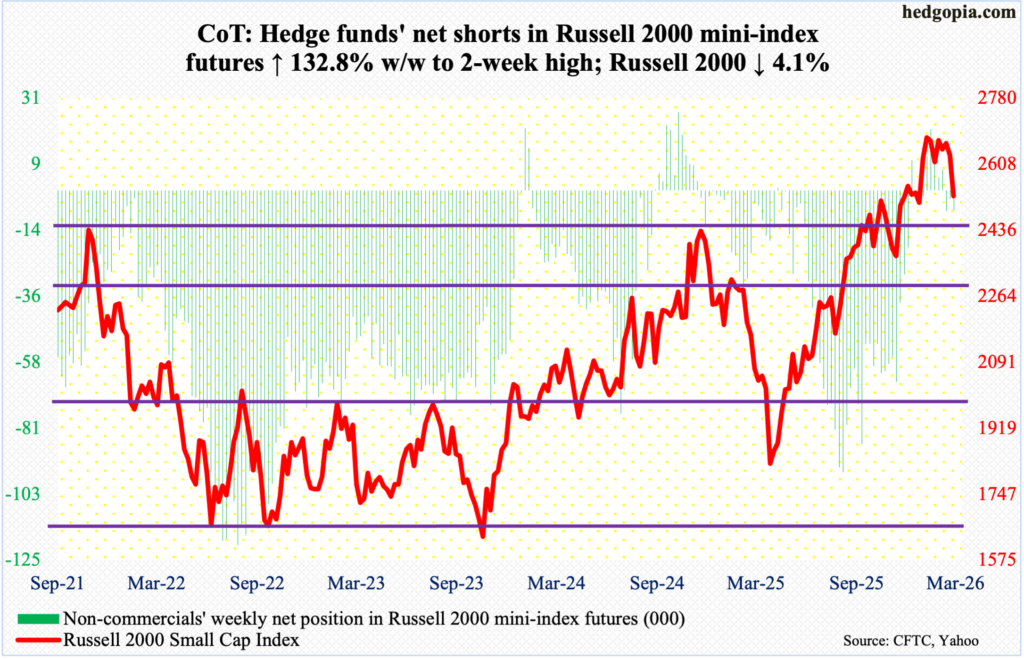
The Russell 2000 tumbled 4.1 percent this week to 2525. This follows three weekly spinning tops in a row, coupled with a series of lower highs since it reached a record 2735 on 22 January. Heading into this week, the small cap index had gone sideways for eight consecutive weeks since breaking out of 2540s, followed by a successful breakout retest four weeks ago. This week’s retest was not a success, although the breach is not definitive.
Next week will be key. Further weakness will meaningfully raise the probability that the index is eventually headed for a test of 2460s. In November 2024, the index retreated after ticking 2466. Three years before that, in November 2021, it rose to 2459 and then went the other way. Last September, those highs were surpassed, but not before a stretched bull-bear tug of war followed around those highs.
US Dollar Index: Currently net short 5k, up 3.2k.
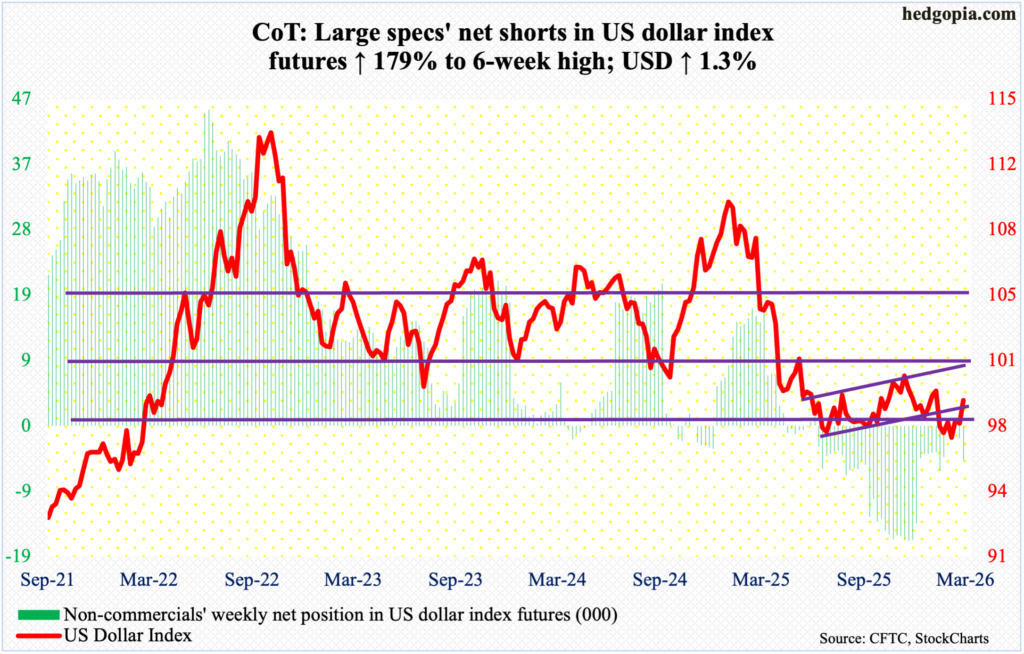
The US dollar index finally managed to rally back above 98, which provided stiff resistance in three of the prior four weeks. This week, it added 1.3 percent to 98.87, although dollar bulls were unable to hang on to Tuesday’s intraday high of 99.68.
In January last year, after a three-plus-month rally, the US dollar index reversed hard at 110.18, subsequently reaching 96.38 in June and successfully testing that low with a lower low 96.22 in September. On 27 January, another lower low 95.55 was ticked, and that was embraced by the bulls, ending the week with a weekly dragonfly doji.
The daily is overbought. Should the US dollar index come under pressure, and should bulls show up and defend 98, then it will be easy to eye resistance just north of 100, which goes back more than a decade.
VIX: Currently net short 55.7k, up 880.
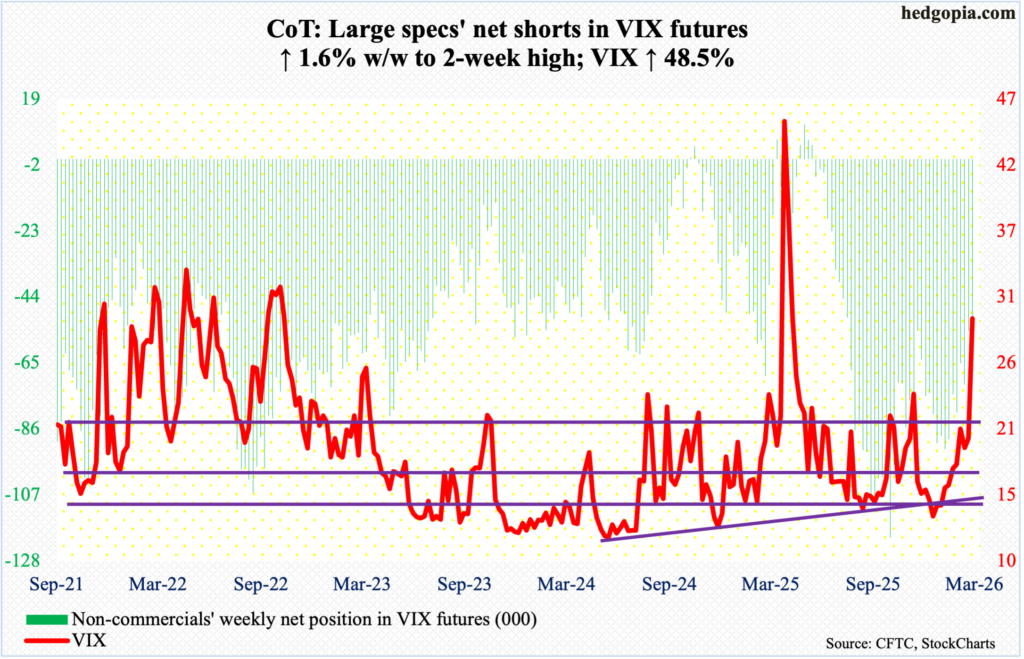
In March 2020, VIX tagged 85.47, which was the highest print since the October 2008 record of 89.53, and retreated. In the subsequent six years, there have been several lower highs – 65.73 in August 2024, 60.13 last April and the latest 29.93 last Friday. Friday’s high also feebly took out the highs from last October and November.
This week, VIX surged 9.63 points to 29.49. This follows persistent defense of a rising trendline from Christmas Eve when it ticked 13.38 intraday. If the latest momentum continues, VIX can rally toward mid- to high-50s and still post a lower high versus last April’s.
The point is, VIX can rally a lot in the right circumstances. That said, it just had an excellent week. In the past, VIX has tended to peak with a spike reversal, in which case it spikes and reverses hard to leave behind a large wick on the candle.
Thanks for reading!
