
Following futures positions of non-commercials are as of April 21, 2026.
10-year note: Currently net short 791k, down 9.4k.
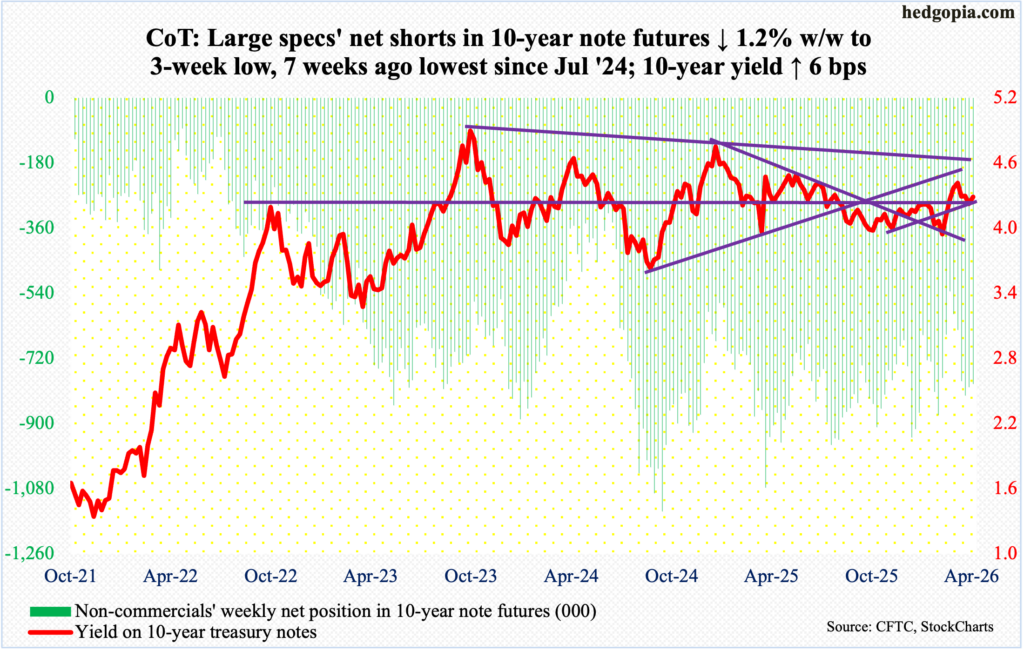
The FOMC (Federal Open Market Committee) meets next week. Five more scheduled meetings remain after this for this year. The fed funds rate is expected to be left unchanged at a range of 350 basis points to 375 basis points. In fact, futures traders are not currently pricing in a cut until September next year.
If things move according to plan, this will be Federal Reserve Chair Jerome Powell’s last meeting, as he retires at the end of May, although he has the option of staying on as governor until 2028. Kevin Warsh, tapped to replace Powell, was at the Senate Banking Committee early this week. A major hurdle to his confirmation came on Friday as the Department of Justice dropped its criminal investigation into Powell over Fed headquarters renovation costs. Republican Senator Thom Tillis had said he would hold up the vote until the DoJ probe was withdrawn. Previously, Powell had said he would keep his governor’s job until the investigation was resolved; next Wednesday, he for sure will be quizzed on this by the press.
So, presently, markets would be more interested in what Warsh says than in what Powell says. Interestingly, pre-Warsh Senate appearance, a tiny percentage of futures traders – in low single digits – had their money on a 25-basis-point hike by next April’s meeting; this is now all but gone. The March dot plot continued to project two 25-basis-point cuts this year. After the spike in energy prices post-Iran war, this is looking too optimistic. President Donald Trump has been calling for lower rates, and at this week’s Senate hearing, Warsh said he would not be Trump’s “sock puppet,” although, truth be told, that is what any other nominee would say pre-confirmation. More importantly, it seems Warsh is not in favor of the dot plot or future guidance, and he expressed firm commitment to fighting inflation. As Fed governor between February 2006 and March 2011, he heavily leaned on the hawkish side. Early indications are that he will continue that legacy as Fed chairman.
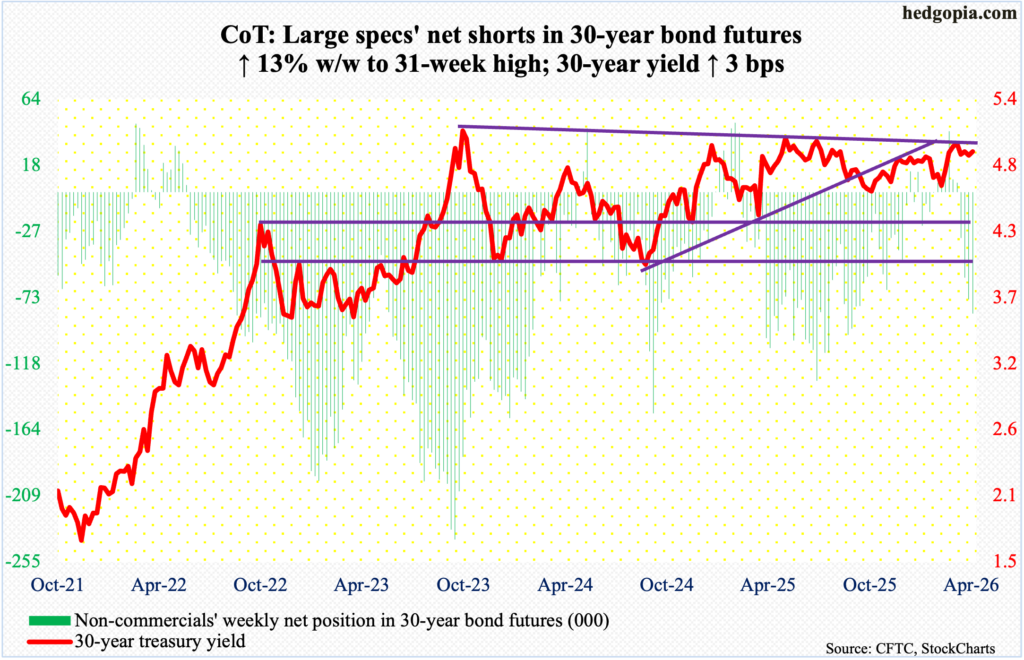
30-year bond: Currently net short 83.8k, up 9.7k.
Major US economic releases for next week are as follows.
The S&P Case-Shiller home price index (February) is on schedule for Tuesday. Nationally in January, home prices eked out a gain of 0.9 percent from a year ago. This was the slowest year-over-year appreciation in 31 months. Two years ago, prices were rising north of six percent.
Durable goods orders (March) and housing starts (February and March) will be out Wednesday.
February orders for non-defense capital goods ex-aircraft – proxy for business capex plans – grew 0.7 percent month over month to a seasonally adjusted annual rate of $79.5 billion, which set a fresh record.
Housing starts in January jumped 7.2 percent m/m to 1.49 million units (SAAR) – an 11-month high.
Thursday brings the employment cost index (1Q26), GDP (1Q26, first estimate) and personal income/spending (March).
In the fourth quarter last year, private-industry total compensation rose at an annual rate of 3.4 percent, which was the slowest pace in 18 quarters; in 2Q22, comp grew at a 38-year high 5.5 percent.
Real GDP barely grew in the December quarter last year, up only 0.5 percent. This was quite a deceleration from the 4.4-percent pace from the September quarter.
In the 12 months to February, headline and core PCE (personal consumption expenditures) respectively rose 2.8 percent and three percent. In April last year, they respectively increased 2.3 percent and 2.6 percent, with the latter particularly the lowest since March 2021.
WTI crude oil: Currently net long 151.3k, down 26.2k.
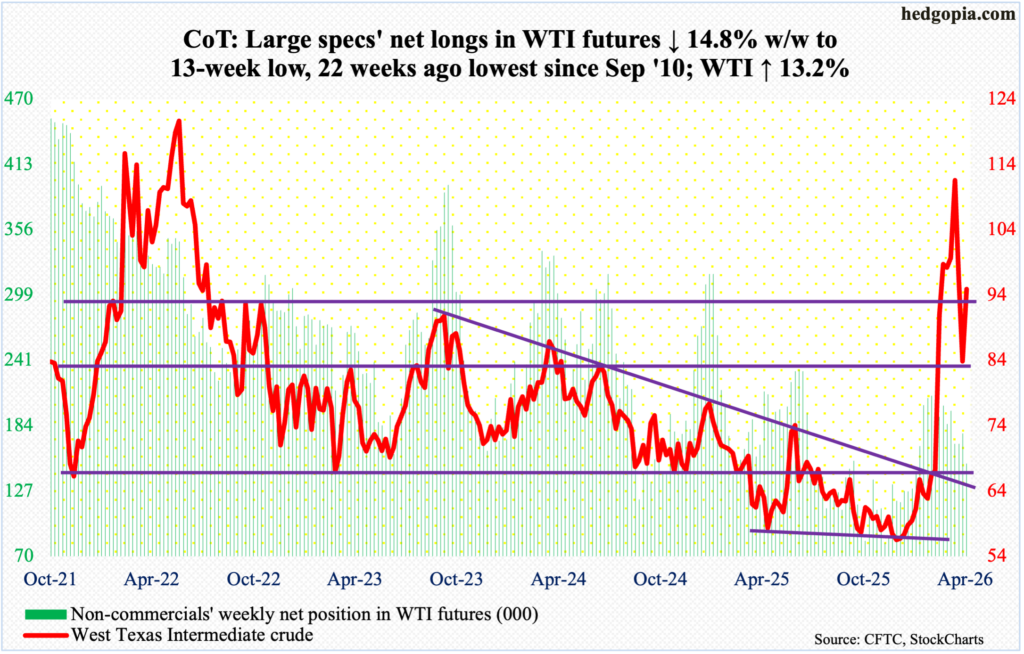
Last Friday, West Texas Intermediate crude breached the 50-day by a big margin tagging $80.56 intraday but only to rally to close just underneath the average (now $87.28). This week, oil bulls again defended the average in the first couple of sessions, finishing the week up 13.2 percent to $94.88/barrel.
The bullish action in the last six sessions precedes an intraday reversal at $117.63 on the 7th this month, which just fell short of the four-year high $119.48 ticked on March 9.
Earlier, on February 27 – a day before Israel and the US attacked Iran – the crude tagged $64.85 intraday before exploding higher in the subsequent sessions. This week, longs were able to reclaim horizontal support at $91-$92.
There is currently a tussle between the daily and weekly conditions; depending on which one prevails, WTI can go either way. In a scenario the daily wins out, bulls have a shot at $100-plus; else, they will be forced to defend $91-$92.
In the meantime, as per the EIA, US crude production in the week to April 17 dropped 11,000 barrels per day week over week to 13.585 million b/d; output registered a record 13.862 mb/d in the week to November 7 last year. Crude imports increased 787,000 b/d to 6.1 mb/d. As did crude inventory, which grew 1.9 million barrels to 465.7 million barrels. Stocks of gasoline and distillates respectively declined 4.6 million barrels and 3.4 million barrels to 228.4 million barrels and 108.1 million barrels. Refinery utilization decreased five-tenths of a percentage point to 89.1 percent.
E-mini S&P 500: Currently net short 110.1k, down 5.7k.
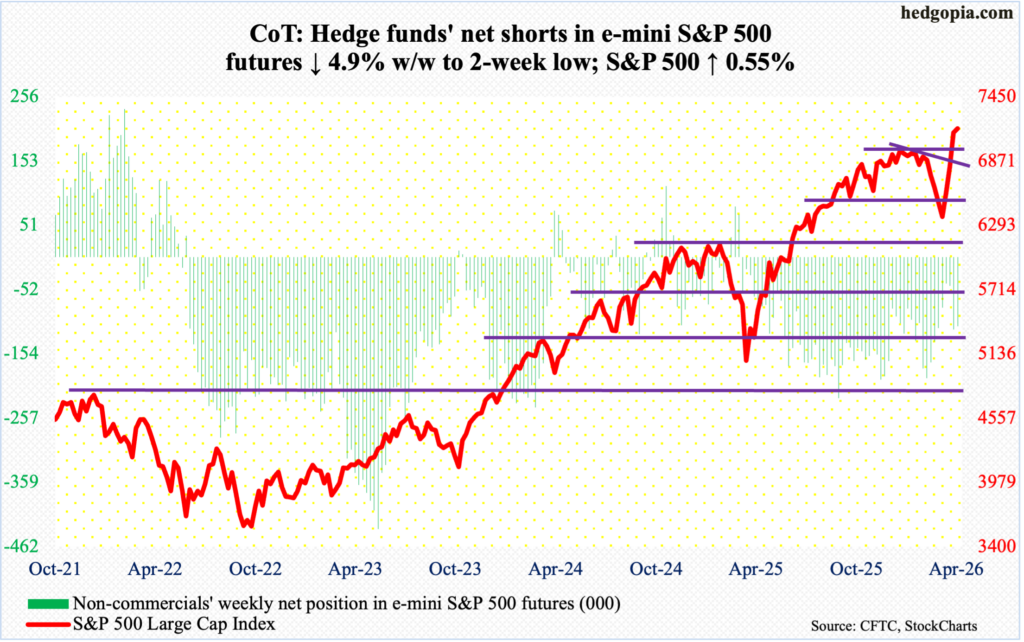
The S&P 500 rallied 0.6 percent this week to make it a fourth consecutive weekly gain. The large cap index bottomed at 6317 on March 30 and finished this week at 7165, with an intraday high of 7169 on Friday.
Prior to this, the S&P 500 declined 9.8 percent from 7002, which was a prior peak reached on January 29. That high was taken out last week. A successful breakout retest nearly occurred this week, with Tuesday and Thursday respectively drawing buying interest at 7050 and 7047; these lows also represent gap-up support, filling a gap from last Friday.
The daily conditions particularly are grossly overbought, yet momentum remains with the bulls. In the near term, there is support at 7130s, followed by the aforementioned breakout retest just north of 7000.
Euro: Currently net long 41.3k, up 15.3k.
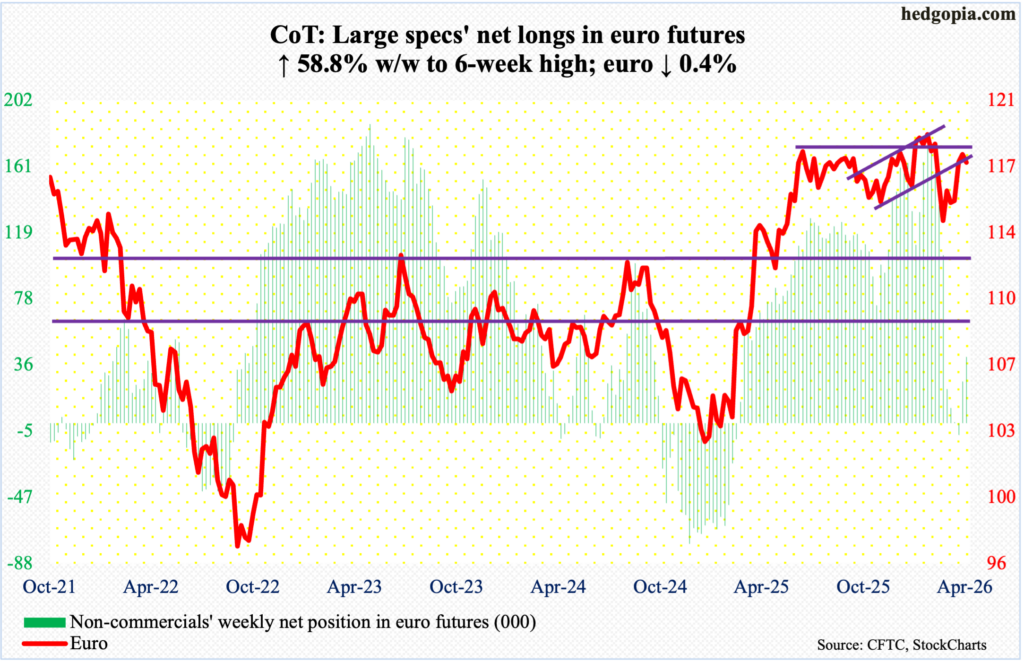
For a year now, the euro has played ping pong between $1.14 and $1.18, with a four-and-a-half-year high of $1.2083 on January 27. On March 13, it bottomed at $1.141. In January last year, the currency bottomed at $1.018.
Last Friday, the euro was rejected after tagging $1.185. This week, it dropped 0.4 percent to $1.172, closing just above the 200-day at $1.168 and the 50-day at $1.166. This is a place where euro bulls will need to step up, as several indicators such as the daily RSI have also approached the median. If the bears prevail, they have a shot at $1.15s.
Gold: Currently net long 162.5k, up 6.2k.
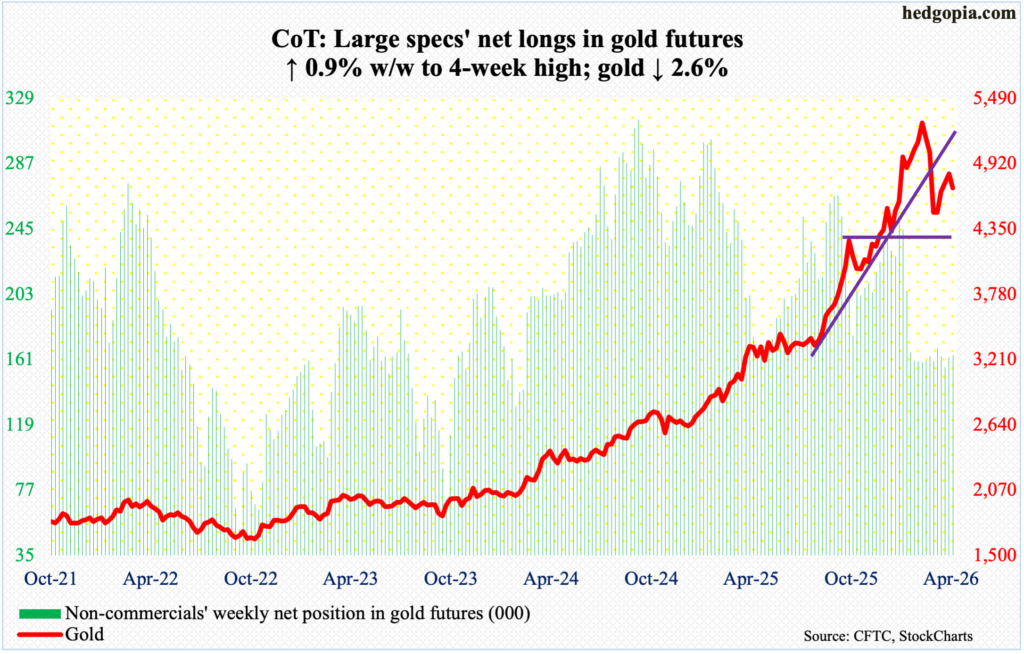
Gold ended its run of four weekly gains in succession, closing this week lower 2.6 percent to $4,709/ounce. Last Friday, rally attempts were repelled at the 50-day (now $4,870) as the metal ticked $4,892 intraday.
Earlier on March 23, gold bottomed at $4,099 intraday to find support just above the 200-day (now $4,227); this essentially was a test of horizontal support at $4,370s. The yellow metal’s all-time high was registered on January 29 at $5,608. Gold has made lower highs since.
Even as the metal remains sandwiched between the 50- and 200-day, its daily Bollinger bands are beginning to tighten. If past is prelude, when this happens, a sharp move follows – either up or down. Having just been denied at the 50-day, the path of least resistance is toward the 200-day in due course. Before $4,370s get tested, there is important straight-line support at $4,540s.
Nasdaq (mini): Currently net long 9.4k, down 1.4k.
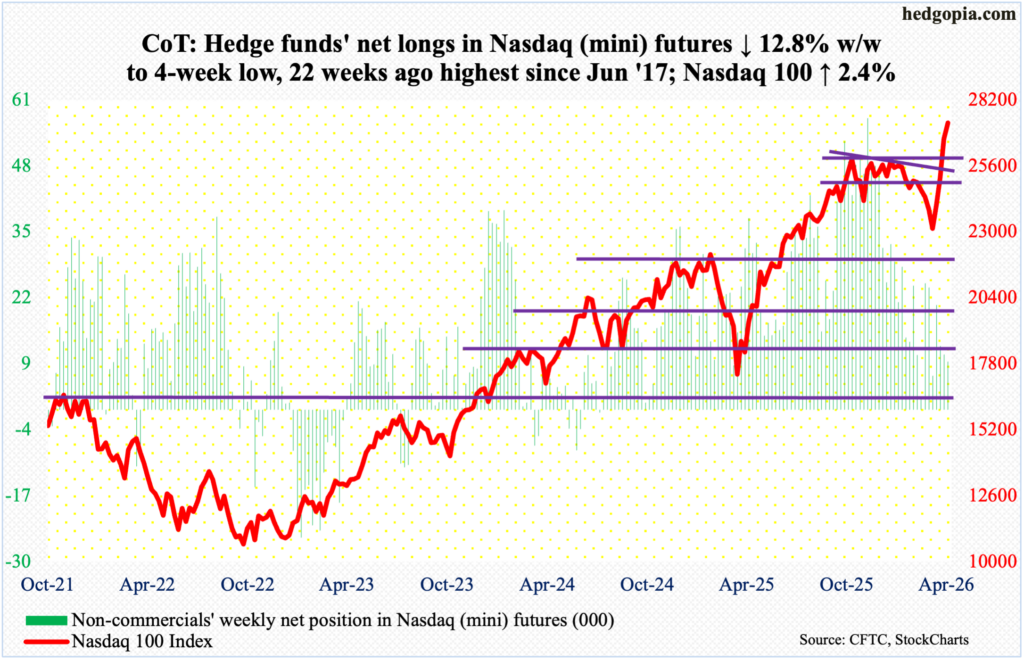
Big Tech’s crazy run continues. Bottoming at 22,841 on March 30, the Nasdaq 100 closed this week at 27304, up 2.4 percent. This was the fourth up week in a row. Earlier, the tech-heavy index began to unravel on January 28 after the bulls were rejected 17 points short of the October 29 high of 26182. Bears who were sniffing a double top are now being forced to cover their shorts. Those highs were taken out last week, with further gains this week coming as it does ahead of next week’s crucial set of earnings.
Next Wednesday, Microsoft (MSFT), Google parent Alphabet (GOOG), Amazon (AMZN) and Facebook parent Meta (META), report their March-quarter results, while Apple’s (AAPL) comes out Thursday. Combined, they sport a market cap of $15 trillion. The Nasdaq 100 is weighted by market cap, so these results, making up five of the Magnificent 7, will matter a lot, particularly when the stocks have rallied so much post-March 30 lows. A lot is baked in.
This week, breakout retest at 26100s nearly took place, with both Monday and Tuesday drawing bids just north of 26400.
Russell 2000 mini-index: Currently net short 15.9k, up 6.6k.
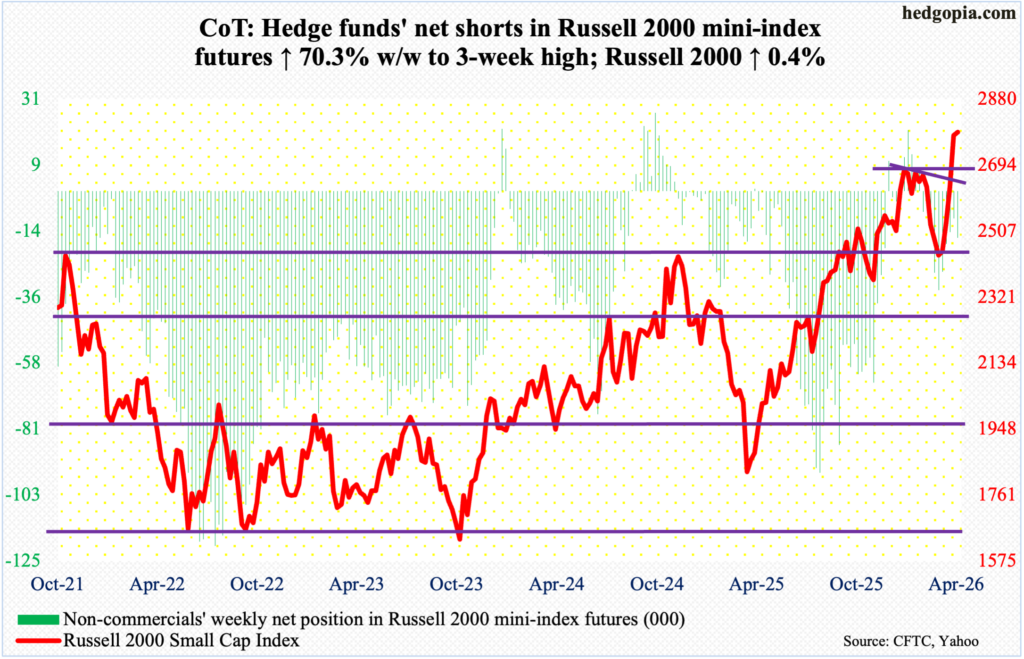
Arguably, both bulls and bears had their share of momentum this week, with the former posting a fresh intraday high of 2819 and the latter forcing a close much lower than that. The Russell 2000 finished up 0.4 percent to 2787, ending with a weekly spinning top. This was the fifth weekly advance in a row.
From the bulls’ perspective, they were able to pull off a successful breakout retest at 2730s, as Thursday’s intraday weakness to 2742 was bought. On January 27, the small cap index had peaked at 2735, before posting a series of lower highs. This trendline resistance was taken care of last week, coming on the heels of the prior week’s breakout at 2540s, which had stood like a rock for four successive weeks.
But the fact that the week ended in a spinning top can throw a monkey wrench in the bullish momentum. As things stand, bulls deserve the benefit of the doubt so long as 2730s remain intact.
US Dollar Index: Currently net long 5k, down 187.
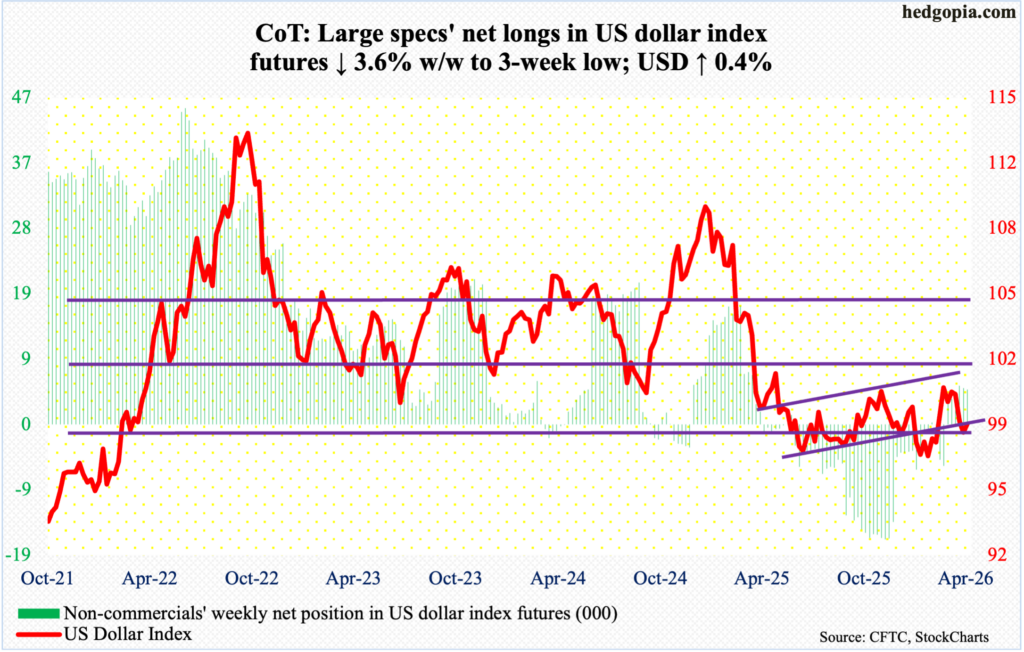
The US dollar index reclaimed the 200-day (98.54) intra-week but was denied at the 50-day (98.88) on both Thursday and Friday, with intraday tags of 98.94 and 98.92 respectively. When it was all said and done, the index closed at 98.52 – essentially at the 200-day – up 0.4 percent for the week. This was the first weekly gain in four weeks.
Earlier, after unsuccessfully trying for five weeks to reclaim 100, including March 30 when an intraday high of 100.64 was hit intraday, dollar bulls threw up their hands in the week before. Resistance just north of 100 goes back more than a decade, and it was lost last April.
In January last year, after a three-plus-month rally, the US dollar index reversed hard at 110.18, subsequently reaching 96.38 in June and successfully testing that low with a lower low 96.22 in September. On 27 January this year, another lower low 95.55 was ticked, and that drew bids. A positive momentum thereof seems to have run its course – at least for now.
The daily RSI seems to want to turn lower at the median. The April 17 low of 97.63 is in focus.
VIX: Currently net short 27.3k, up 3k.
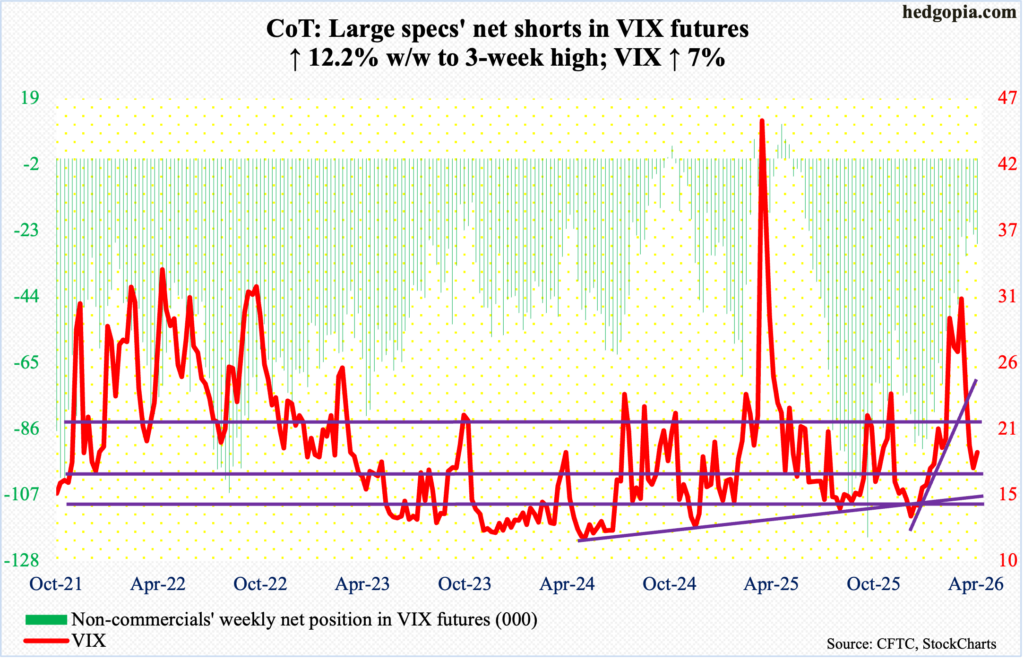
This week, both VIX and the S&P 500 rallied, with the former adding 1.23 points to 18.71. This does not happen that often, as the two tend to move in opposite directions.
The week began with VIX rallying above the 200-day (18.24). The 50-day lies above at 22.51, with the volatility index tagging 21.56 intraday Thursday. Other than that, VIX hung out just above the 200-day all week.
Concurrently, elsewhere in the options market, investor optimism is building feverishly, as can be seen in the CBOE equity-only put-to-call ratio, which for 13 consecutive sessions has produced readings of 0.50s or lower, six of them in the 0.40s. The 10-day average closed just below 0.5 for three consecutive sessions through Friday. This has not happened in four years.
Thanks for reading!
