
Following futures positions of non-commercials are as of May 5, 2026.
10-year note: Currently net short 815.3k, down 23.9k.
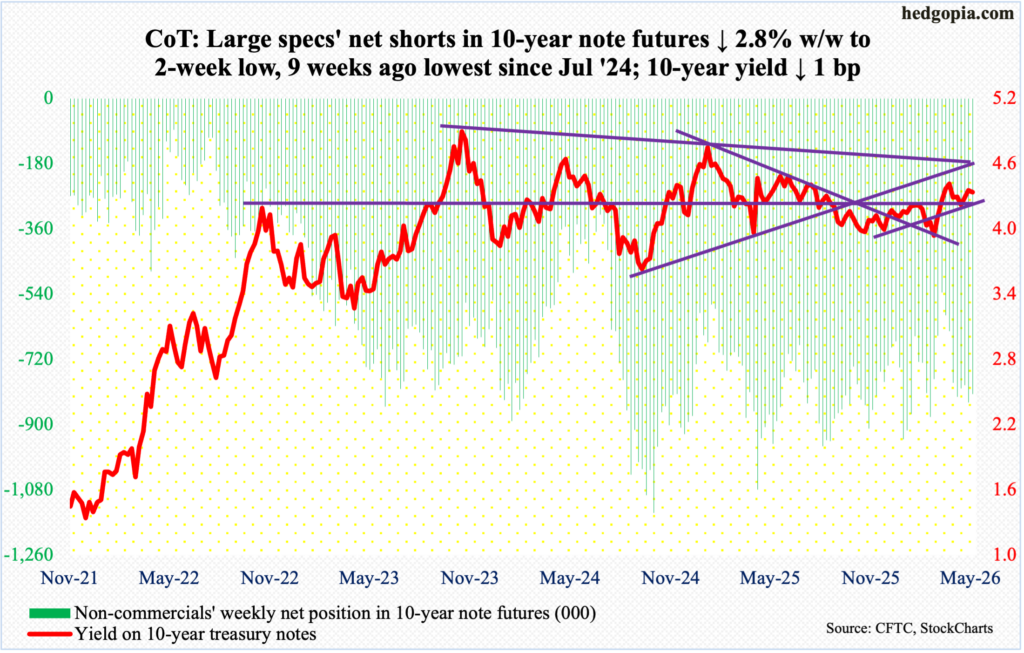
The 10-year treasury yield began the week with an intraday tag of 4.46 percent on Monday, closing lower a basis point to 4.36 percent for the week. Monday’s was a lower high versus 4.48 percent set on March 27. Rates, in fact, have made lower highs ever since they peaked in October 2023 at five percent, followed by 4.81 percent in January last year.
If past is prelude, after posting a lower high, the 10-year has proceeded to come under downward pressure. The all-important horizontal support at 4.20s is just underneath, with the 50-day moving average at 4.29 percent and the 200-day at 4.19 percent.
In the futures market, non-commercials remain heavily net short 10-year note futures, betting on higher yields (price and yield are inversely related). If bond bulls (on price) succeed in breaking the 4.20s support, then these futures traders will likely come under pressure to cover at least some of their shorts, which can push yields even lower.
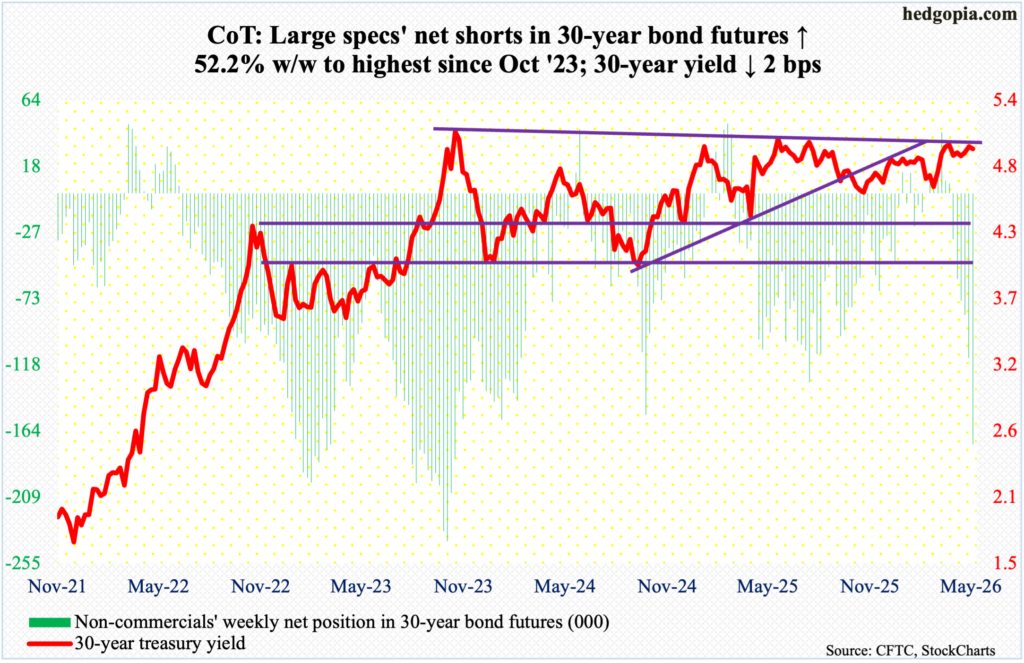
30-year bond: Currently net short 172.9k, up 59.3k.
Major US economic releases for next week are as follows.
Existing home sales (April) are on deck for Monday. March sales declined 3.6 percent month over month to a seasonally adjusted annual rate of 3.98 million units, matching the low of last June.
The NFIB optimism index (April) and the consumer price index (April) will be out Tuesday.
Small-business optimism decreased three points m/m in March to 95.8, matching the reading of April last year.
In the 12 months to March, headline and core CPI increased 3.3 percent and 2.6 percent, which respectively set a 23- and three-month high.
The producer price index (April) is scheduled for Wednesday. From a year ago, headline and core wholesale prices in March rose four percent and 3.6 percent respectively.
Thursday brings retail sales (April). In March, sales strengthened 1.7 percent m/m to $752.1 billion (SAAR) – a fresh record.
Industrial production/capacity utilization (April) and the NAHB housing market index (May) will be published Friday.
Capacity utilization fell 0.6 percent m/m in March to 75.7 percent – a two-month low.
Homebuilder sentiment in April dropped four points m/m to a seven-month low 34.
WTI crude oil: Currently net long 144.7k, down 7.5k.
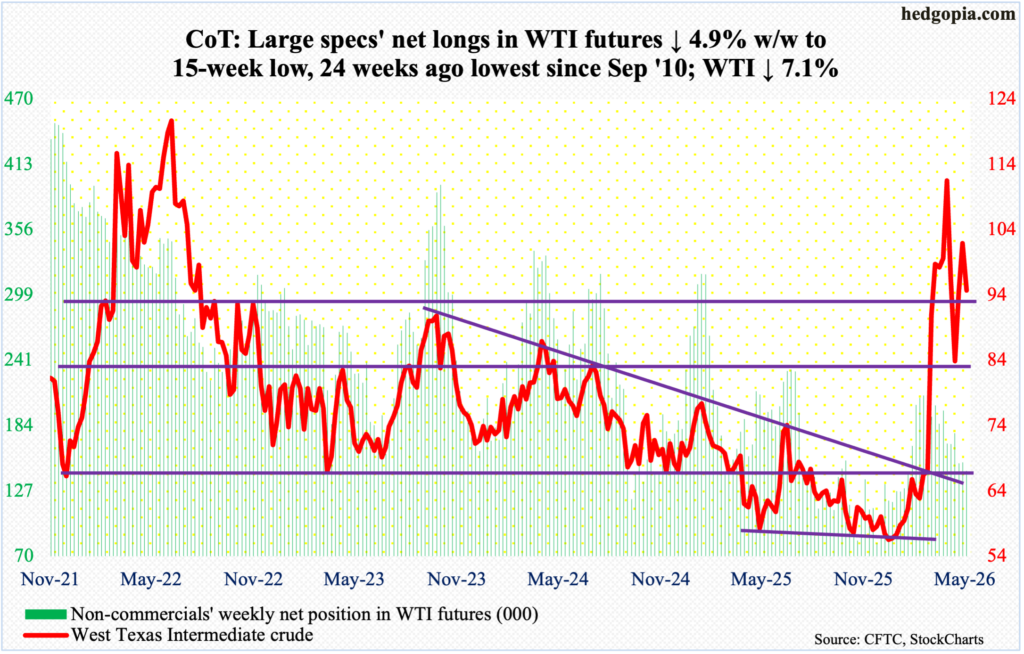
Under selling pressure in four out of five sessions, West Texas Intermediate crude gave back 7.1 percent this week to $94.72/barrel, with a high of $107.46 on Monday and a low of $88.66 on Wednesday. This was another lower high since the crude peaked intraday at $119.48 on March 9, followed by $117.63 on April 7.
On both Wednesday and Thursday, WTI was pushed under the 50-day but managed to close above the average in both sessions. By the end of the week, it finished just above the average ($94.36). Technical odds favor a breach in the sessions ahead. There is horizontal support at $91-$92, followed by $86-$87.
In the meantime, as per the EIA, US crude production in the week to May 1 decreased 13,000 barrels per day week over week to 13.573 million b/d; output registered a record 13.862 mb/d in the week to November 7 last year. Crude imports, too, dropped, down 273,000 b/d to 5.5 mb/d. As did stocks of crude, gasoline, and distillates, which respectively declined 2.3 million barrels, 2.5 million barrels and 1.3 million barrels to 457.2 million barrels, 219.8 million barrels and 102.3 million barrels. Refinery utilization rose five-tenths of a percentage point to 90.1 percent.
E-mini S&P 500: Currently net short 103.9k, up 2.4k.
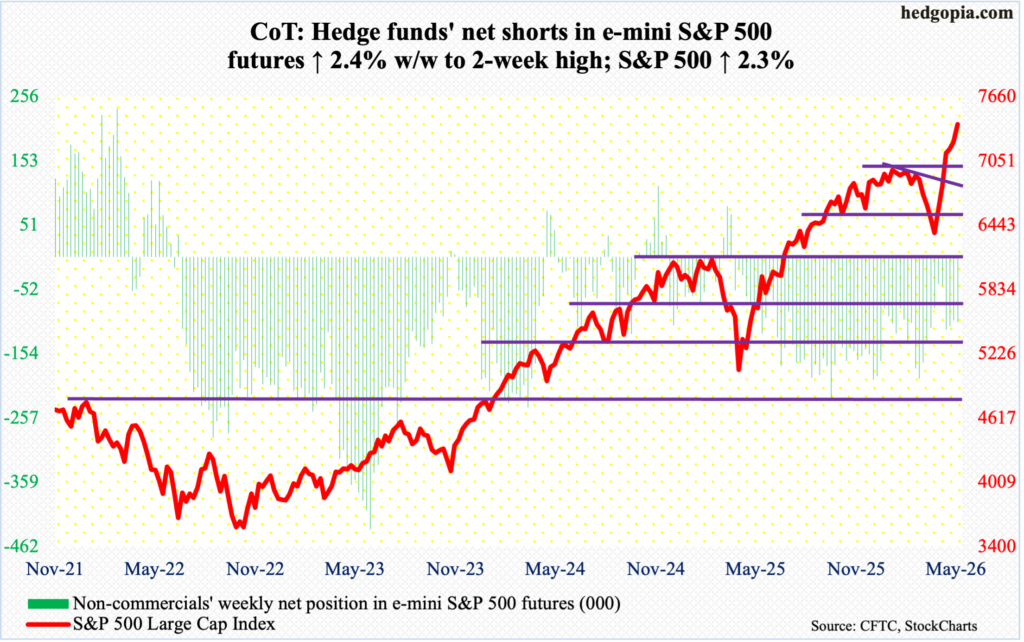
Last Friday’s shooting star amounted to nothing as far as equity bears are concerned. Monday’s intraday dip to 7174 was bought; when it was all said and done, the week rallied 2.3 percent to 7399, with Friday’s intraday high of 7402.
This was the sixth up week in a row. The S&P 500 earlier bottomed at 6317 on March 30. Through Friday’s fresh high, it is now up 17.1 percent from the March low, more than erasing the loss of 9.8 percent from 7002, which was the prior peak reached on January 29.
Technically, the large cap index remains deeply overbought – particularly on the daily. That said, positive momentum is yet to break. Bulls are managing to defend support. For bears to get any traction, they would have to first recapture 7270s and then 7140s, followed by the all-important breakout retest just north of 7000.
Euro: Currently net long 32.2k, down 3.5k.
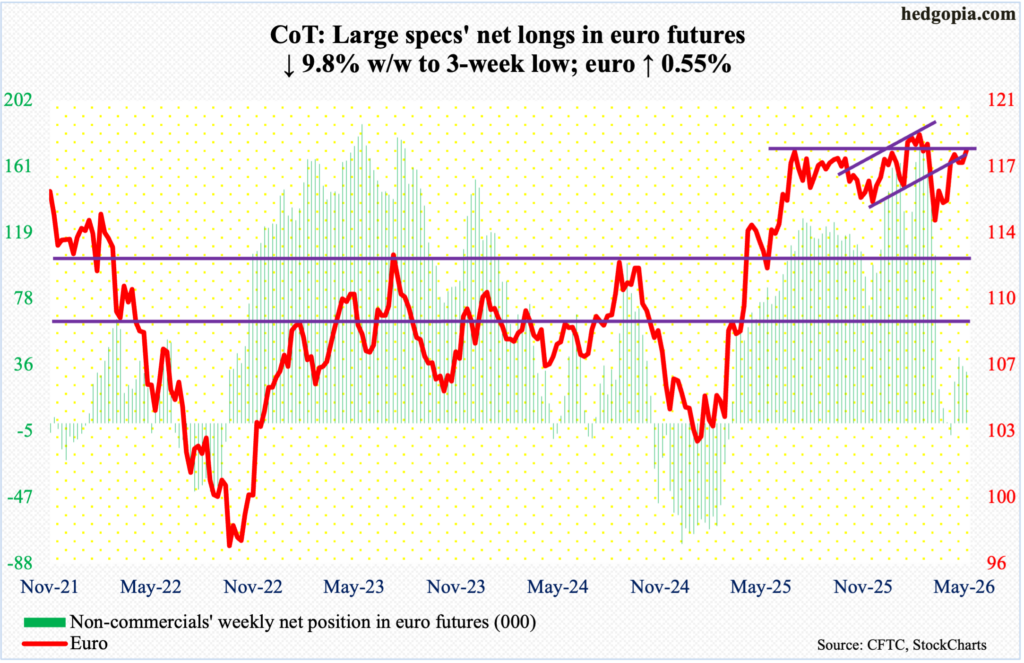
After defending the 200-day ($1.168) in the first two sessions, euro bulls rallied the currency 0.6 percent this week to $1.179, with a weekly high of $1.18 on Wednesday.
On April 17, the euro was rejected after tagging $1.185. For a year now, it has played ping pong between $1.14 and $1.18, with a four-and-a-half-year high $1.2083 posted on January 27. On March 13, it bottomed at $1.141. In January last year, the currency bottomed at $1.018.
This week’s gains follow a weekly spinning top back-to-back. Odds favor more strength ahead. Concurrently, the daily RSI (59.28) loitered just above the median for two weeks before turning up.
Gold: Currently net long 163.3k, up 3.7k.
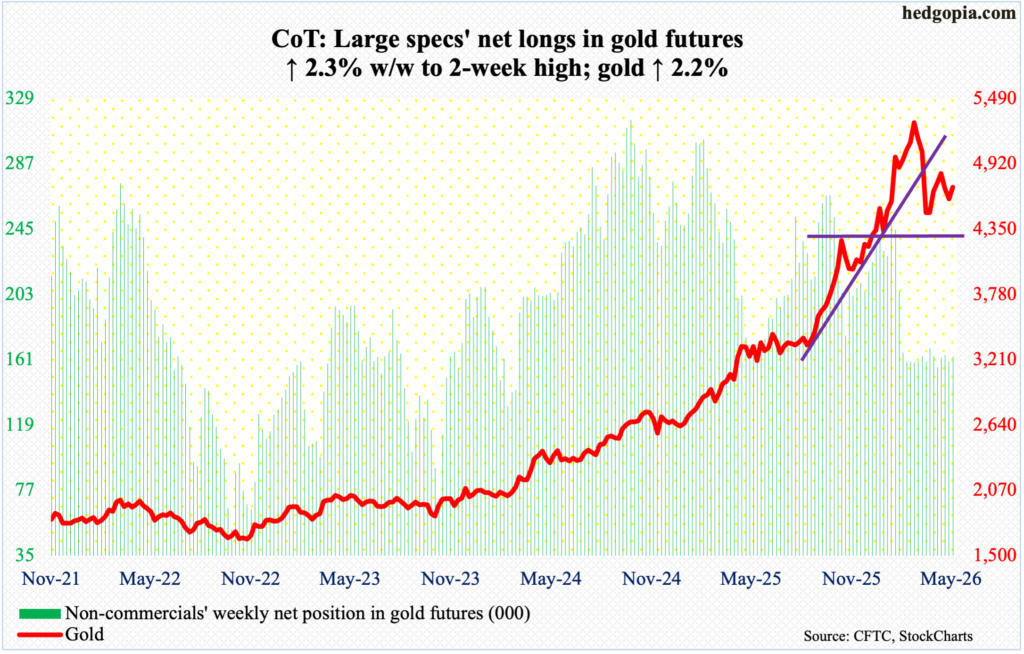
Gold acts like it just does not know which way it wants to go. It has been caught between the 50- and 200-day ($4,782 and $4,290 respectively) since dropping out of the former on March 18; three trading sessions later on the 23rd, it bottomed at $4,099 just above the latter.
Earlier, the metal’s all-time high was registered on January 29 at $5,608, before making lower highs, including $5,419 on March 2 and $4,892 on April 17.
This week, gold kind of went after the 50-day with a high of $4,765 on Thursday but to no avail, although it ended the week up 2.2 percent to $4,715/ounce. Assuming gold bugs succeed in reclaiming the 50-day, last month’s high (4,892) is worth a watch.
Nasdaq (mini): Currently net long 1.2k, up 3.5k.
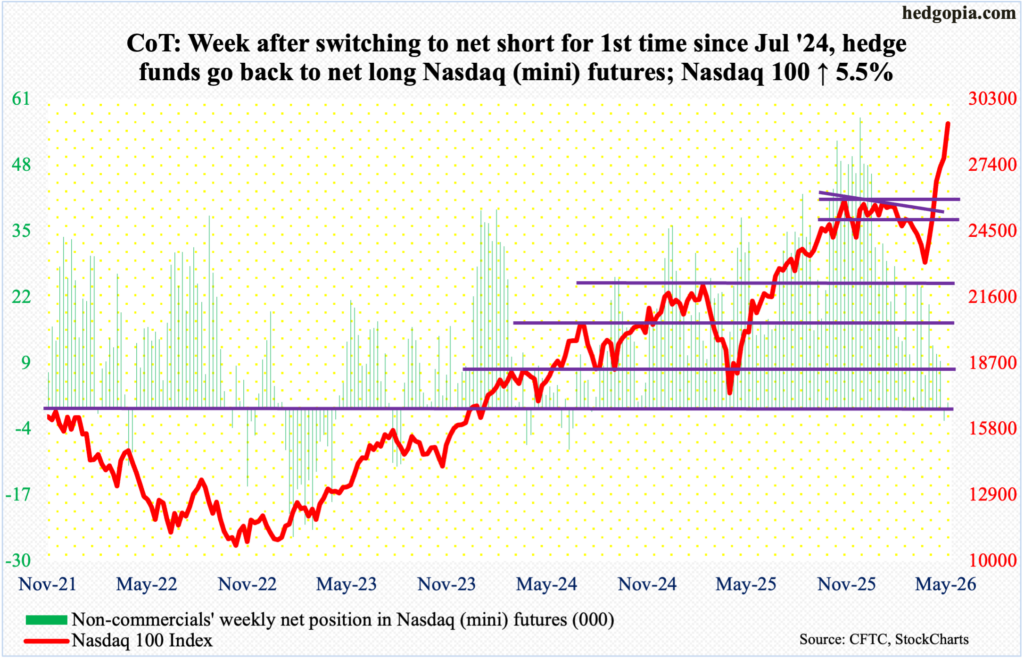
Going into this week, the Nasdaq 100 had already rallied for five consecutive weeks. It still managed to add another 5.5 percent this week to 29235, closing at session high for a bullish marubozu candle. All in all, from the intraday low 22841 on March 30, the tech-heavy index is now up 28 percent. This, in fact, pales in comparison to the 57-percent surge made by SMH (VanEck Semiconductor ETF).
As ridiculous as these gains look, there are no signs of distribution yet – thus far anyway. Of import, the weekly RSI (74.22) just entered the 70s; in the recent past, anytime this has happened, some kind of digestion has followed. For whatever it is worth, the daily RSI closed the week at 82.59! This is froth territory.
Russell 2000 mini-index: Currently net short 9.1k, down 7.9k.
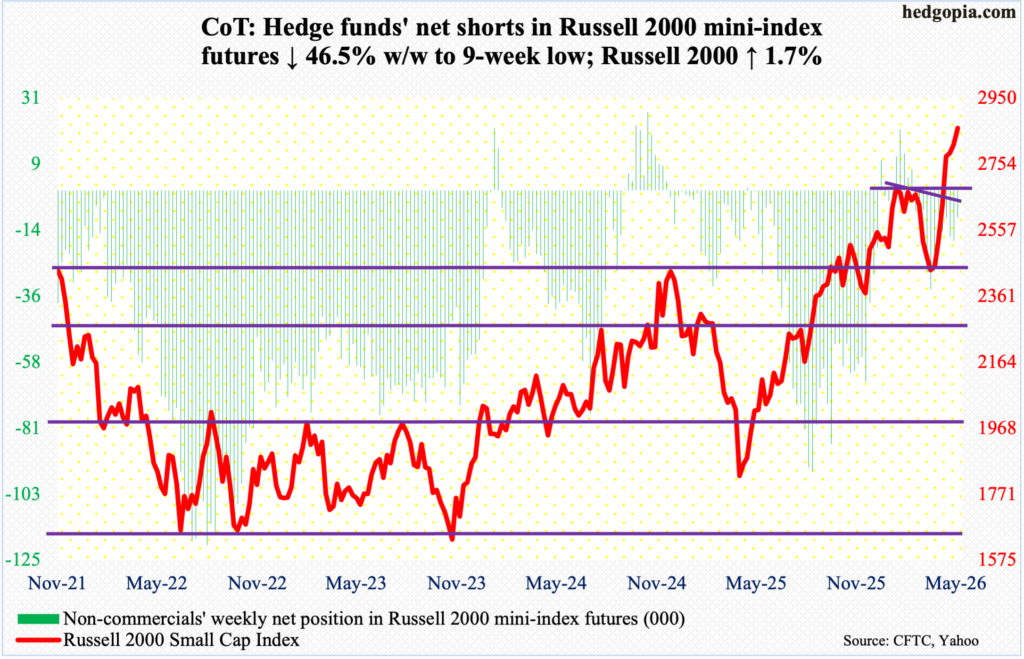
Small-cap bears this week were unable to cash in on a couple of potentially bearish weekly candles. Going into the week, the Russell 2000 had rallied for five consecutive weeks, although it gave off signs of fatigue in the last two, with last week forming a hanging man and the week before a spinning top. Bulls instead rallied the index 1.7 percent this week to 2861 to negate the two candles; Wednesday, the index rallied as high as 2889.
This preceded a successful breakout retest at 2730s last week. On January 27, the Russell 2000 peaked at 2735, before posting a series of lower highs. This trendline resistance was taken care of three weeks ago, coming on the heels of a breakout at 2540s in the week before that.
As things stand, longs deserve the benefit of the doubt so long as 2730s remain intact.
US Dollar Index: Currently net long 693, down 3.8k.
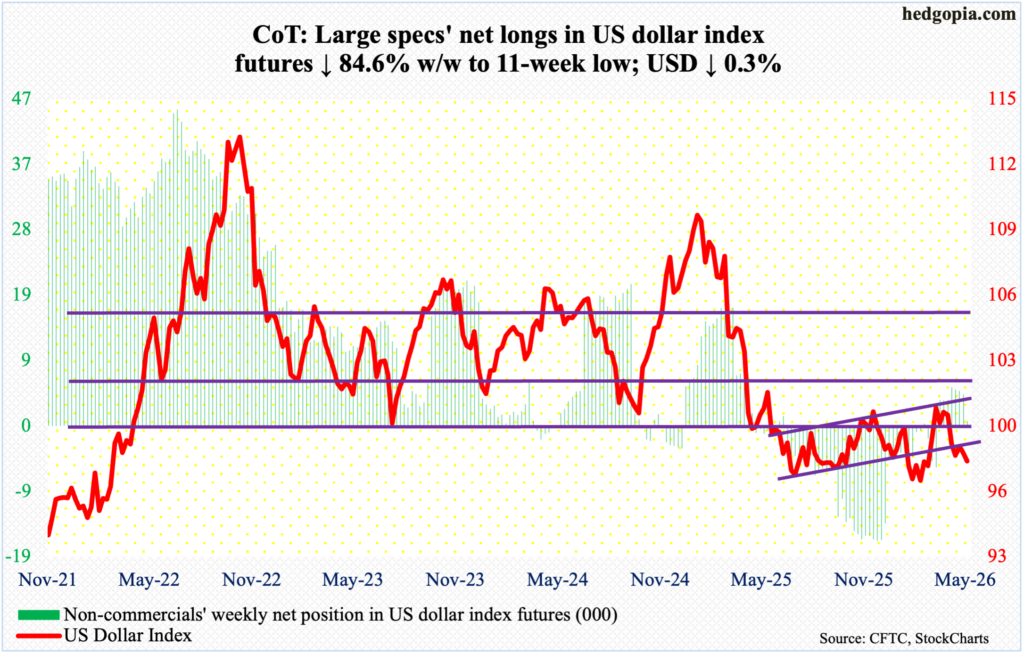
The US dollar index is perilously close to breaking support at 97.70s, having declined 0.3 percent this week to 97.84. As a matter of fact, it tagged 97.63 intraday Wednesday before bids showed up to close the session at 98.02. Both Monday and Tuesday, the index was rejected at the 200-day (98.53).
Earlier, after unsuccessfully trying for five weeks to reclaim 100, including March 30 when an intraday high of 100.64 was hit intraday, dollar bulls gave up five weeks ago. Resistance just north of 100 goes back more than a decade, and the level was lost in April last year.
In January last year, after a three-plus-month rally, the US dollar index reversed hard at 110.18, subsequently reaching 96.38 in June and successfully testing that low with a lower low 96.22 in September. On 27 January this year, another lower low 95.55 was ticked, and that drew bids. The positive momentum resulting out of that low hit the wall at 100.
Odds favor the bears right here and now.
VIX: Currently net short 24.7k, down 3.2k.
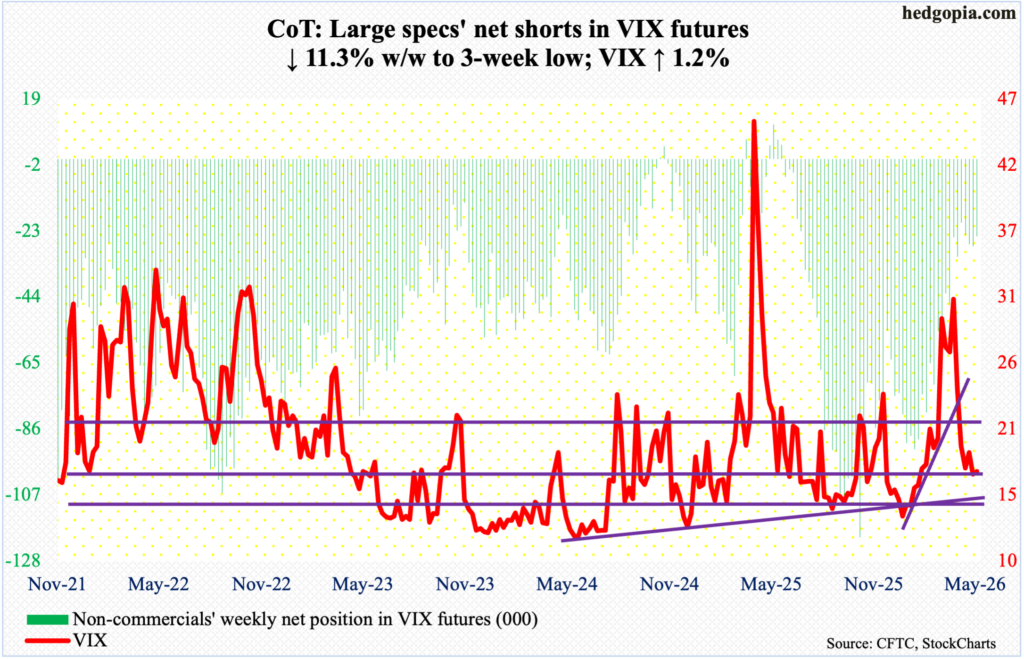
It was one of those weeks when both VIX and the S&P 500 ended the week in the green, with the volatility index rising 0.20 points to 17.19. On Wednesday, VIX ticked 16.18 intraday. Since April 17, it has found support just under 17, which volatility bulls cannot afford to lose at this point; in the event this supports gets breached in the sessions ahead, the possibility of a 14 handle cannot be denied. And this will have happened at a time of maximum complacency already.
The CBOE equity-only put-to-call ratio has produced readings of 0.50s or lower, nine of them in the 0.40s for 23 consecutive sessions. The 21-day average of the ratio came in at 0.503 on Friday, with Thursday’s 0.501 the lowest print since December 2021.
Thanks for reading!
