
Following futures positions of non-commercials are as of June 23, 2026.
10-year note: Currently net short 835.3k, down 75.8k.
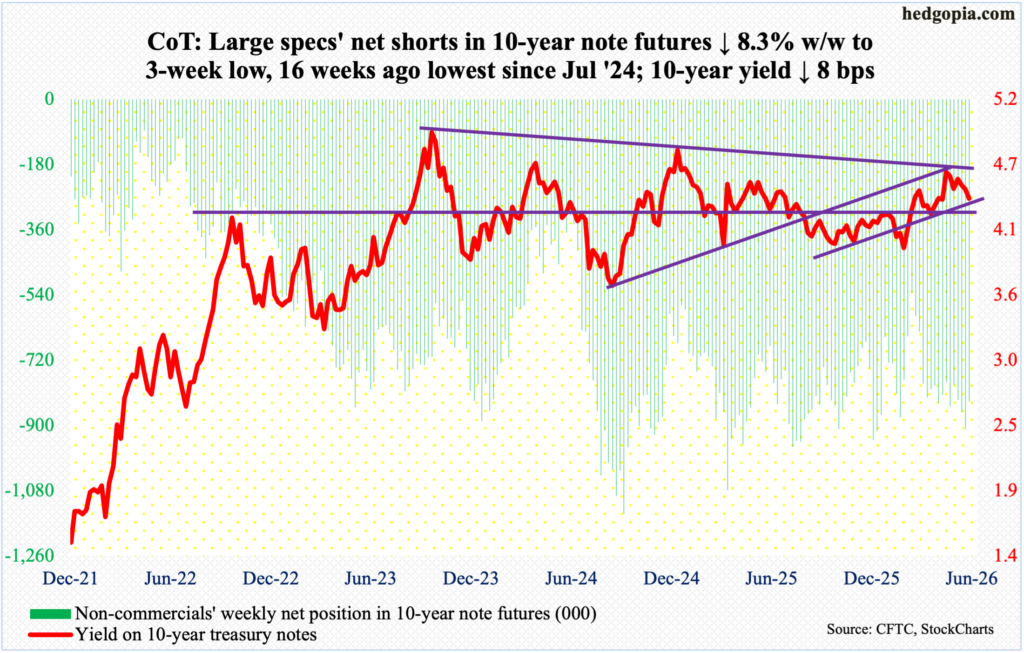
Eight days after newly appointed Federal Reserve Chairman Kevin Warsh sounded tough on inflation came May’s PCE (personal consumption expenditures) report, and it was anything but well behaved. As last week’s FOMC meeting unwound, Warsh’s post-meeting comments “this committee will deliver price stability” drew a lot of attention in the marketplace. This was as good a signal as any that the central bank for now was putting more emphasis on inflation than on jobs. This was validated this Thursday.
In the 12 months to May, headline and core PCE respectively grew 4.1 percent and 3.4 percent, which represented the highest annual increase since April and October 2023. It can be argued that the rise in inflation in recent months is largely driven by the war in Iran, putting upward pressure on oil prices. But it is also true that headline and core PCE respectively bottomed in April last year at 2.3 percent and 2.6 percent. Iran was only attacked in February this year. This raises risks that price pressures were already building in the system. Other macro data support this line of thinking – from GDP to jobs to business capex.
Further, equities have rallied massively since the lows of April last year, not to mention the immense wealth created in the crypto land the past several years, although the latter has come under pressure in recent months.
With all this as a background, the Warsh-led Fed is right to shift attention to inflation right here and now. For five years now, PCE inflation has missed the Fed’s two percent target.
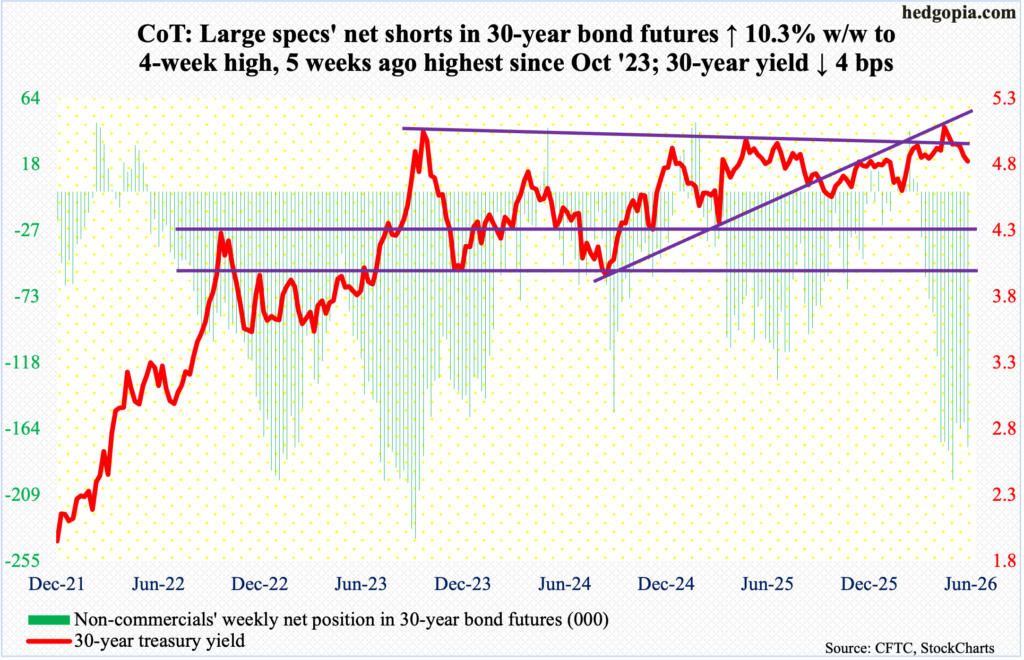
30-year bond: Currently net short 176k, up 16.5k.
Major US economic releases for next week are as follows.
The S&P Cotality Case-Shiller home price index (April) and job openings (JOLTs, May) are due out Tuesday.
From a year ago in March, home prices nationally decelerated to growth of 0.7 percent. This was the slowest pace of year-over-over appreciation in 33 months.
Non-farm job openings jumped 731,000 month over month in April to 7.62 million – a 23-month high. Last December, openings reached a 63-week low 6.55 million. Openings hit an all-time high 12.3 million in March 2022.
Wednesday brings the ISM manufacturing index (June). In May, manufacturing activity increased 1.3 percentage points m/m to 54 percent. this represented the fifth straight month of expansion following a 10-month contraction.
Payrolls (June) and factory orders (May) are scheduled for Thursday.
The economy created 172,000 non-farm jobs m/m in May, for a five-month average this year of 114,000, versus a puny 10,000 in 2025.
April orders for non-defense capital goods ex-aircraft – proxy for business capex plans – jumped 1.6 percent m/m to a seasonally adjusted annual rate of $84 billion, which set a fresh high; from a year ago, orders surged 10.5 percent.
WTI crude oil: Currently net long 132.1k, down 14.4k.
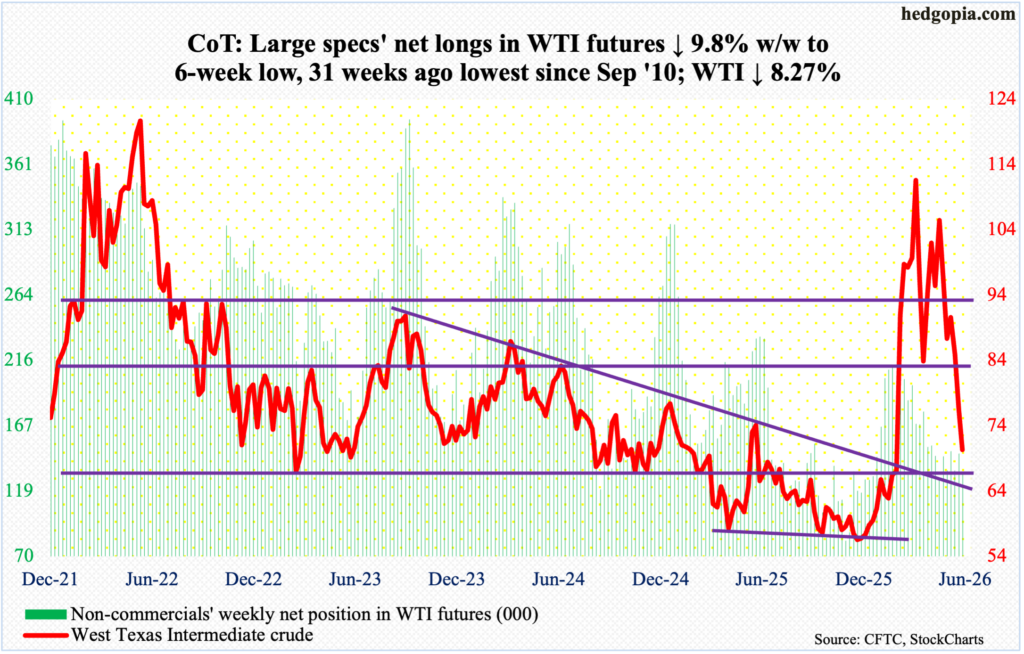
West Texas Intermediate crude just completed a round trip. On February 27, it closed at $67.02, with a session high of $67.83 and a low of $64.85. That was the day before the U.S. and Israel launched an attack on Iran. On Friday, the crude ticked $68.56 intraday before closing at $70.27/barrel, down 8.3 percent for the week. In between, reacting to the Middle East conflict, WTI surged all the way to $119.48, which was hit on March 9. From that four-year high, the crude made one after another lower high, and it has now been down for three weeks in a row, and in five out of six.
This week, WTI also breached the 200-day moving average ($73.82), but odds favor it begins to stabilize around here rather than start another leg lower. Things are way oversold particularly on the daily. Immediate horizontal resistance lies at high-$70s.
In the meantime, as per the EIA, US crude production in the week to June 19 increased 13,000 barrels per day week over week to 13.819 million b/d; output registered a record 13.862 mb/d in the week to November 7 last year. Crude imports, too, rose 436,000 b/d to 5.6 mb/d. As did stocks of gasoline and distillates, which respectively grew 2.1 million barrels and 3.1 million barrels to 216.3 million barrels and 106.1 million barrels; crude inventory, however, declined 6.1 million barrels to 412.1 million barrels. Refinery utilization dropped six-tenths of a percentage point to 96.1 percent.
E-mini S&P 500: Currently net short 35.4k, down 158.5k.
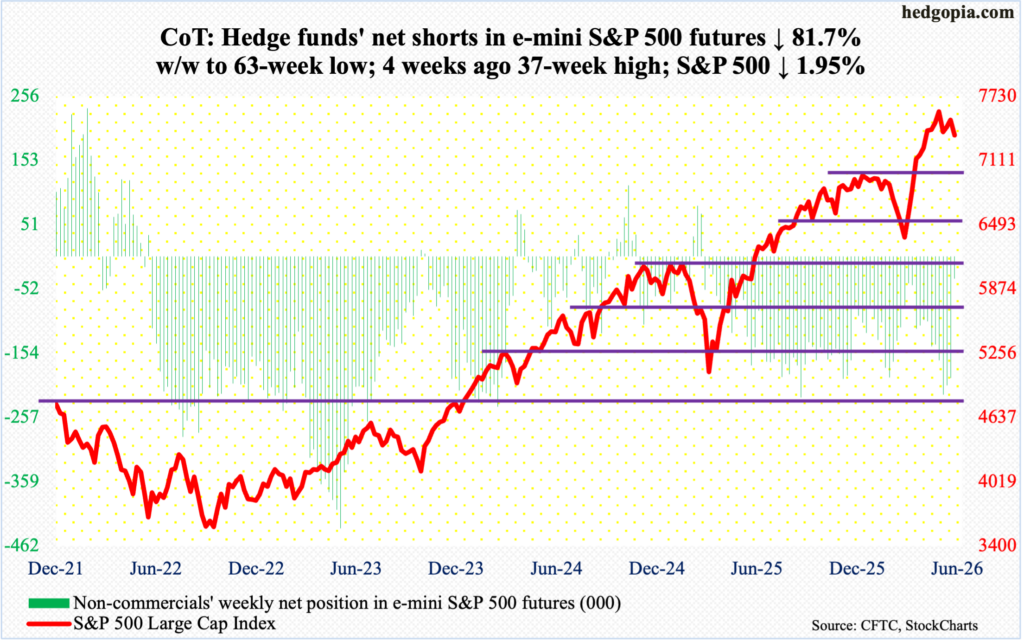
Until this week, the S&P 500 had closed above the 50-day (7363) since April 8. The streak ended Friday as the large cap index closed at 7354, down 1.95 percent for the week. This was a second down week in four, with the first occurring four weeks ago even as a fresh intraday high of 7621 was hit. Since that record print, action has been dominated by a series of lower highs. This week, that trendline resistance attracted sellers on Monday, with each of the five sessions finishing in the red. By Friday, the 50-day (7363) yielded, but not by a whole lot.
The index has come under selling pressure of late, although the current weekly overbought conditions can continue to unwind. In this scenario, a crucial breakout retest does not occur until 7000, or just south of it.
In the meantime, non-commercials, as of Tuesday, massively reduced net shorts to a 63-week low; that was the session the cash just about closed at the 50-day. These traders perhaps covered expecting the index to bounce but it did not; they are likely to come under pressure to add to bearish positions should the average continue to fail to attract longs.
Euro: Currently net long 30.2k, down 4.2k.
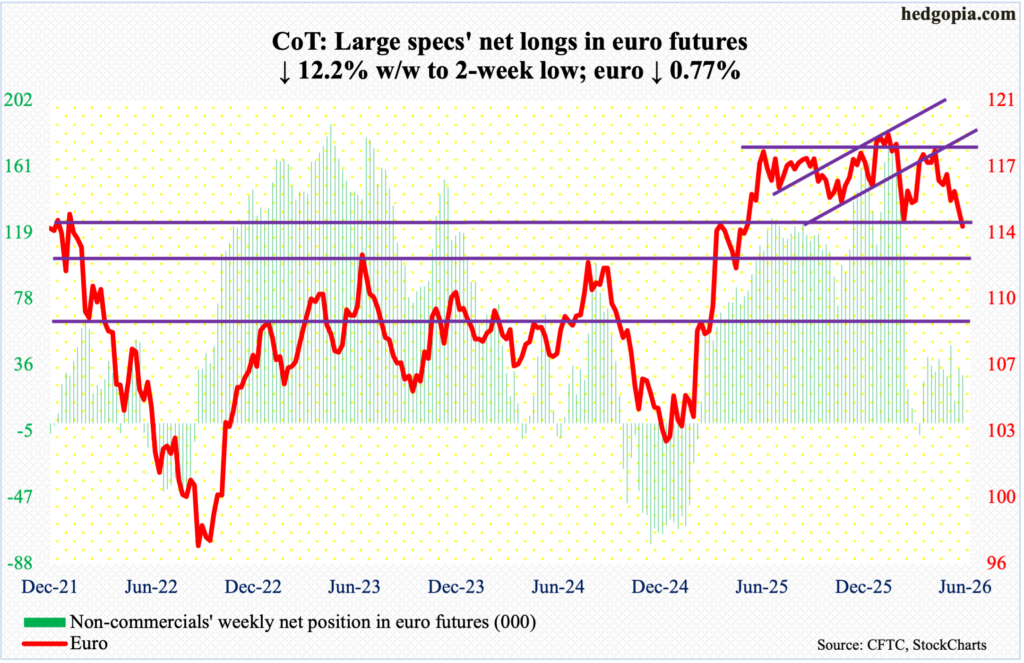
For more than a year, the euro played ping pong between $1.14 and $1.18. Along the way, it tagged a four-and-a-half-year high $1.2083 on January 27, while ticking $1.141 on March 13. That low was breached this week, as the currency gave back 0.8 percent to $1.138.
That said, Wednesday’s low $1.132 was bought, although euro bulls struggled to keep Friday’s intraday high $1.144. This is the level to watch for now. The daily – grossly oversold – is itching to move higher, and $1.140s is where the first layer of resistance lies.
Gold: Currently net long 181.3k, up 1.1k.
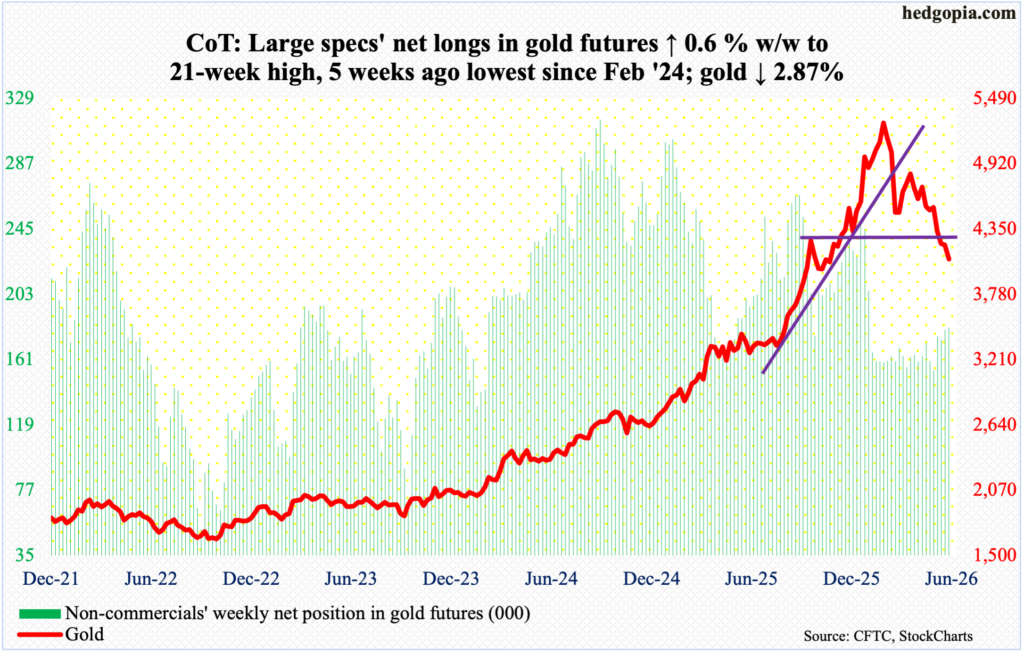
Last week, $4,370s drew selling pressure nearly all week, helping form a weekly gravestone doji. This week, there was more selling, as gold lost 2.9 percent to $4,089/ounce, for a weekly spinning top.
The yellow metal has come a long way on the downside since peaking at $5,608 on January 29, before proceeding to make a series of lower highs. In October 2023, gold bottomed at $1,810, and at $3,312 last August, meaning gold bugs are still sitting on tons of gains; they must hope gold stabilizes soon, and it may very well as the daily conditions are way oversold. Failure to do so will expose the metal to a test of horizontal support at $3,430s.
Nasdaq (mini): Currently net short 9.1k, up 236.
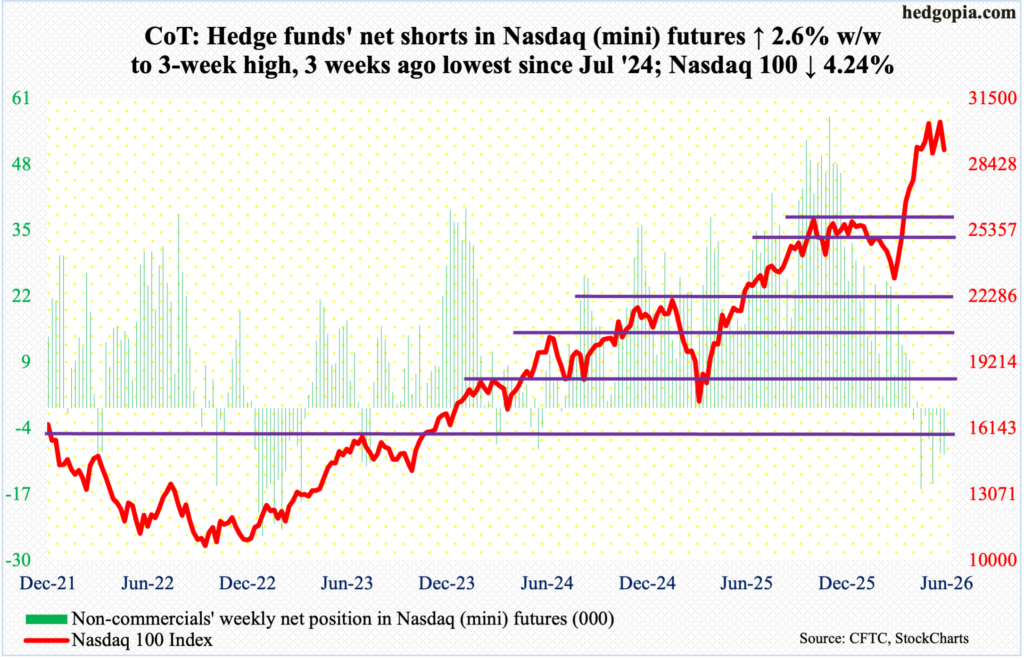
On the 3rd this month, the Nasdaq 100 reached a fresh intraday high of 30762, with heavy resistance at 30600s, which the bears used as an opportunity to go short as soon as the week got underway; Monday, the tech-heavy index ticked 30643 intraday, and sellers showed up, with more joining their ranks on Tuesday with a gap-down. By Friday, the 50-day (28881) was tested intraday to close the session at 29118, down 4.2 percent for the week. The drop may look harsh on the surface but is miniscule considering a 34.7-percent surge from March 30 when the index bottomed at 22841.
Eventually, a major breakout retest at 26100s is a matter of when not if.
Russell 2000 mini-index: Currently net short 26.8k, up 6.6k.
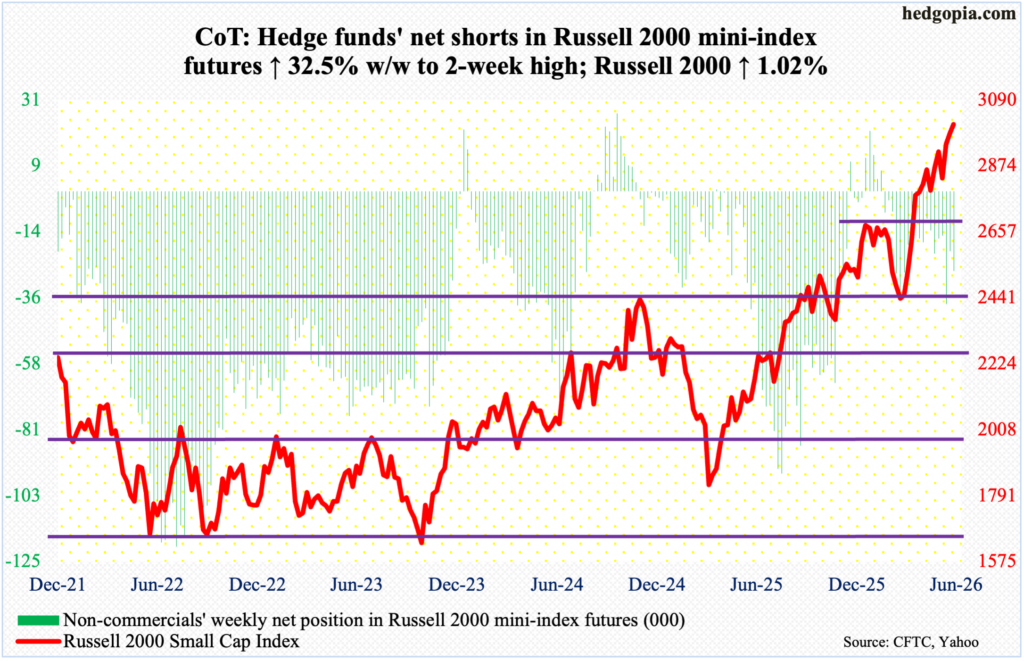
The Russell 2000 bucked the trend this week, rallying one percent to 3010, with a fresh intraday high of 3034 on Thursday. This was the third up week in a row, and fifth in last six.
With each push higher, the small cap index has hammered out levels that can act as support. Having just experienced a mini breakout at 2940s, there were bids waiting on Tuesday at 2951. Earlier, 2880s similarly stopped rally attempts for a few weeks before a breakout occurred.
In the very near term, 2970s is worth watching.
US Dollar Index: Currently net long 12.9k, down 269.
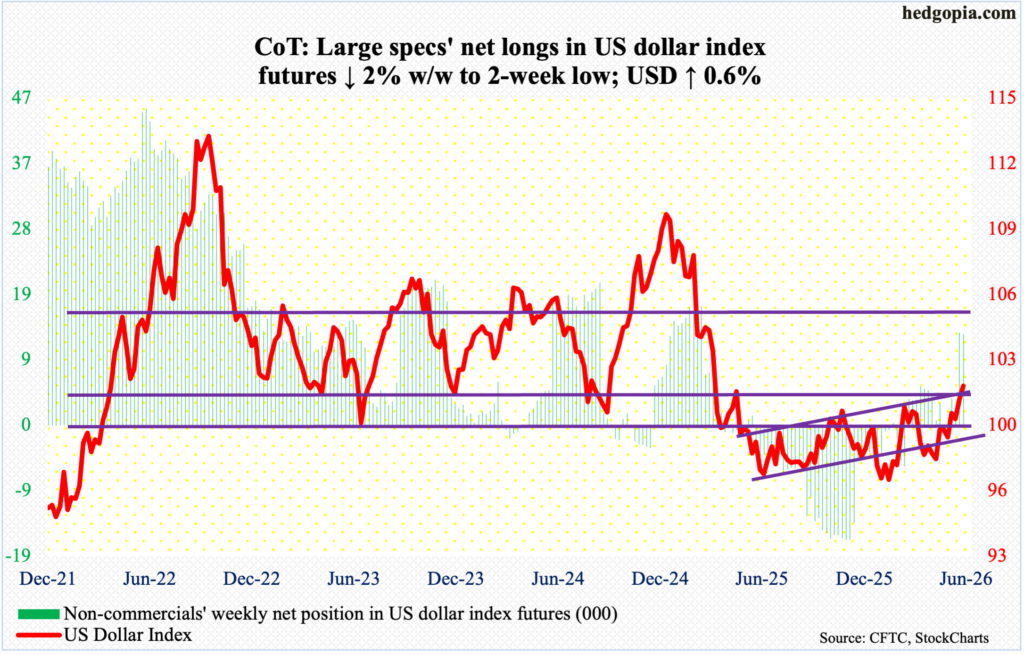
Last week, as of the 16th, non-commercials took net longs to a 15-month high; a week later, they continue to have elevated exposure. Their decision was probably influenced by how the US dollar index has behaved in recent weeks.
Dollar bulls found footing just under 98 for several weeks in April and May, followed by the recapturing of both the 50- and 200-day (99.30 and 98.84 respectively). This Wednesday, the index ticked 101.80, which was the highest level in 13 months, before closing the week 0.6 percent to 101.37, past 100.
The significance of 100 goes back more than a decade, and the level was lost in April last year. More recently, after unsuccessfully trying for five weeks to reclaim 100, including March 31 when an intraday high of 100.64 was hit intraday, longs gave up trying 12 weeks ago. Fast forward to now, dollar bulls have managed to reclaim the level.
The daily needs to sell off to unwind the overbought condition it is in. As that happens, how the index acts at 100 will decide its fate for some time to come. Thus far, bulls deserve the benefit of the doubt.
VIX: Currently net short 66.8k, up 35.
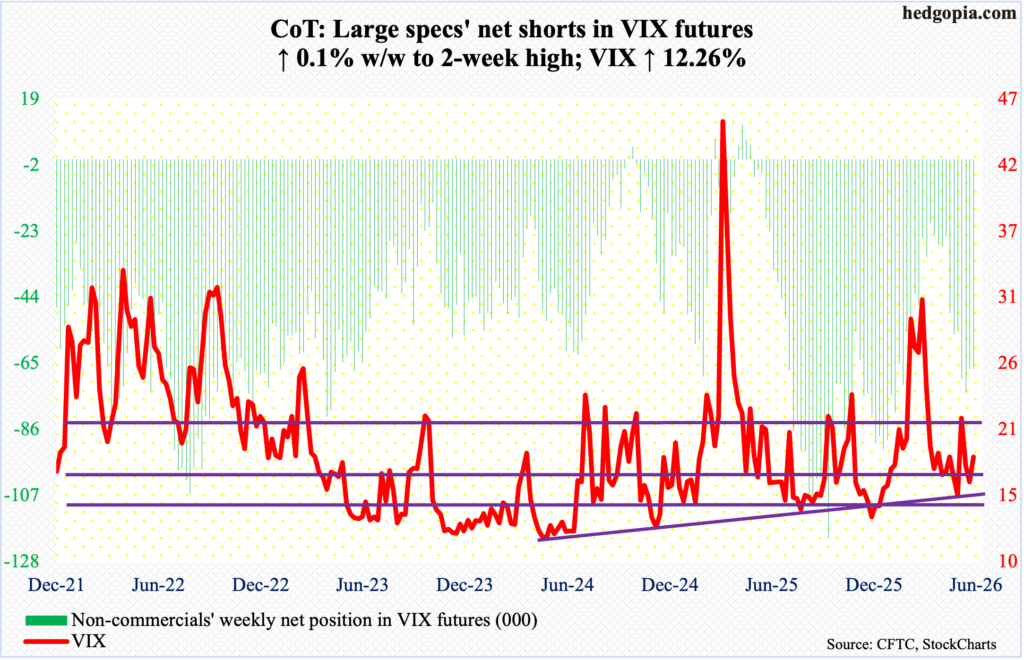
VIX rallied a couple of points this week to 18.41, but volatility bulls’ inability to hang on to Friday’s gains likely suggests weakness in sessions to come. Throughout the week, VIX hugged the 50- and 200-day (17.81 and 18.62 respectively), with Friday’s intraday high 20.72 squandered by the bulls.
Should volatility decide to take a rest, there is important horizontal support at 16.
Thanks for reading!
