
Following futures positions of non-commercials are as of July 7, 2026.
10-year note: Currently net short 814.3k, up 5.4k.
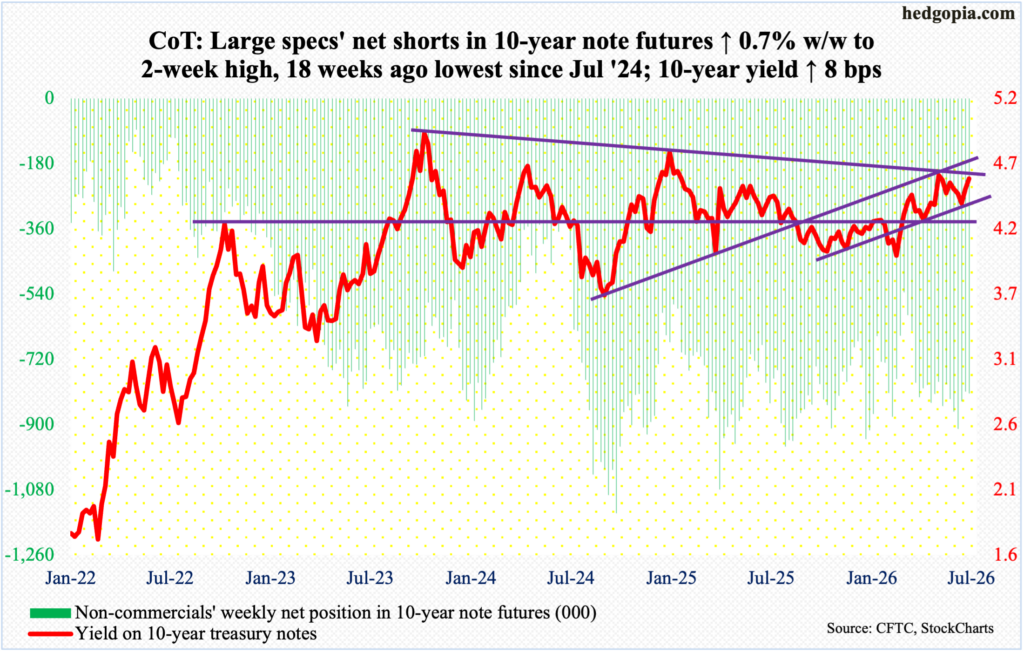
The CME’s FedWatch tool is back at forecasting two 25-basis-point hikes by next March. The fed funds rate has been left unchanged at a range of 350 basis points to 375 basis points since last December when the benchmark rates were reduced by 25 basis points; this preceded a cut of similar magnitude in September and October. Earlier, rates reached a cycle high 525 basis points to 550 basis points in July 2023, followed by cumulative cuts of 100 basis points over three meetings in 2024. Fast forward to now, and these traders expect the first hike as soon as September, followed by the next one in March.
To be fair, these expectations have been all over the place. Until just a few months ago, futures traders were betting that there would be at least two cuts this year. Hindsight is 20/20, those expectations were way out of line. Risks similarly are rising – now to the other side. Right here and now, it is probably safer to take the other side of expectations of two hikes in the next nine months.
Yes, inflation remains elevated, but it has been that way for a while now, remaining above the Federal Reserve’s stated goal of two percent for five years. And, in last month’s FOMC meeting, newly appointed Chairman Kevin Warsh emphasized that “this committee will deliver price stability.” Then, at the ECB Forum on Central Banking two weeks ago, he maintained his hawkish posture saying inflation remains too elevated. But he is likely to face opposition within the FOMC if he continues to lean heavily to the hawkish side.
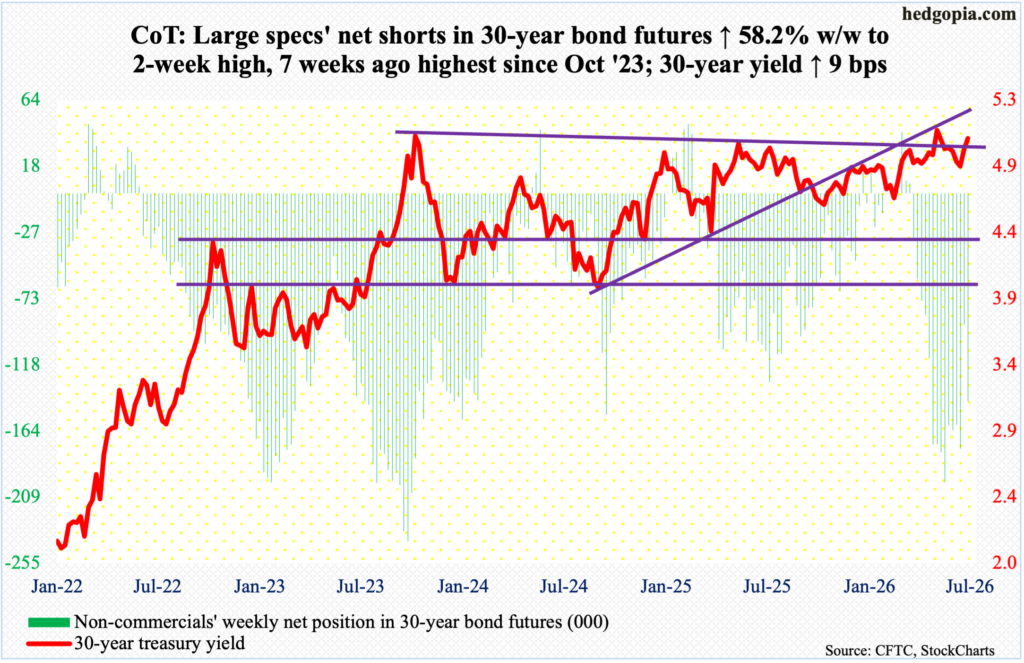
30-year bond: Currently net short 143.6k, up 52.8k.
Major US economic releases for next week are as follows.
The NFIB small business optimism index (June) and the consumer price index (June) are scheduled for Tuesday.
Small-business job openings in May tumbled five points month over month to 29. This was the lowest reading in six years.
In the 12 months to May, headline and core consumer prices increased 4.3 percent and 2.9 percent respectively. This was the fastest pace in 37 and seven months, in that order.
The producer price index (June) will be out Wednesday. From a year ago, headline and core wholesale prices in May jumped 6.5 percent and 5.1 percent respectively.
Thursday brings retail sales (June) and the NAHB housing market index (July).
Retail sales rose 0.9 percent m/m in May to a seasonally adjusted annual rate of $763.7 billion – a record.
Homebuilder confidence in June shrank two points m/m to 35, which set a two-month low.
Housing starts (June), industrial production/capacity utilization (June) and the University of Michigan’s consumer sentiment index (July, preliminary) will be published Friday.
May housing starts plummeted 15.6 percent m/m to a six-year low 1.18 million units (SAAR). Starts were 1.52 million as recently as March.
Capacity utilization in May edged up 0.05 percent m/m to 76.2 percent, which set a 10-month high.
In June, consumer sentiment bounced 4.7 points m/m to 49.5 from May’s record low 44.8.
WTI crude oil: Currently net long 85k, down 32.4k.
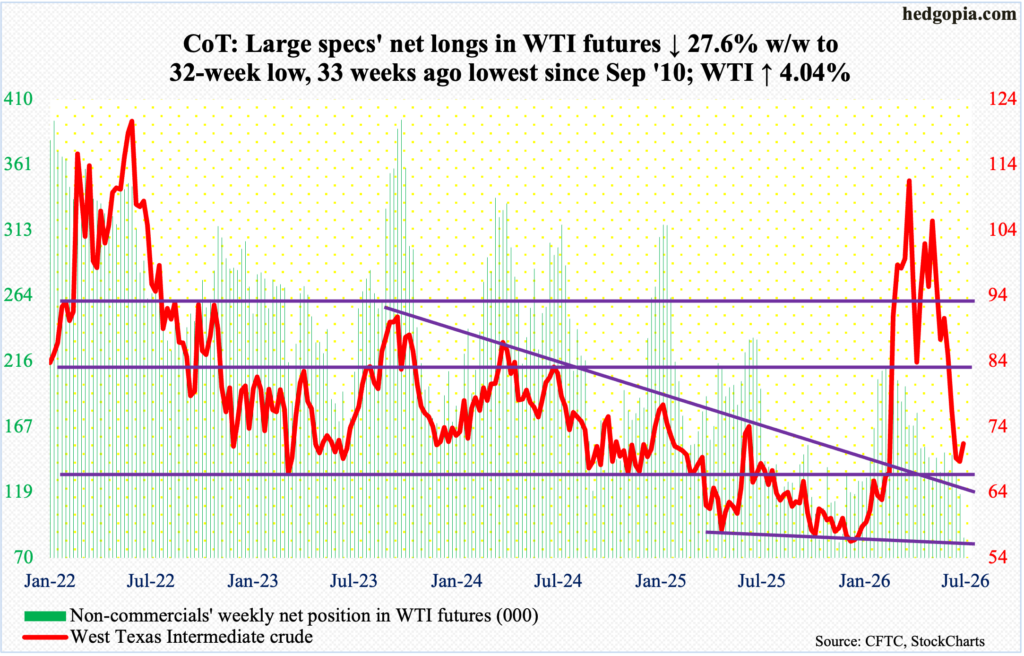
On February 27, West Texas Intermediate crude closed at $67.02, with a session high of $67.83 and a low of $64.85. That was the day before the U.S. and Israel launched a military attack on Iran. On March 2, markets reacted to this geopolitical development by gapping up. That gap was filled last week with an intraday low of $67.04 six sessions ago.
This week, the crude rallied four percent to $71.46/barrel. This was the first up week in five – and second in eight. In between, WTI surged all the way to $119.48 by March 9 – a four-year high. Since then, the crude made a series of lower highs, followed by the loss of the 50- and 200-day moving averages ($87.69 and $74.14 respectively) in May and June respectively.
This week, the 200-day was recaptured intraday Wednesday with a high of $76.08 but only to lose it by close; bulls’ attempt Thursday to reclaim the average again met with disappointment. WTI found support where it could possibly have, but it at the same time is struggling to regain momentum even in the face of adverse headlines coming out of the Middle East. This week, the International Energy Agency also said world oil demand was set to decline by one million barrels per day this year; this would be the first annual drop since the Covid-19 pandemic in 2020.
If oil bulls succeed in retaking the 200-day in the sessions ahead, immediate horizontal resistance lies at high-$70s; else, they may have to regroup at/near the most recent lows.
In the meantime, as per the EIA, US crude production in the week to July 3 grew 50,000 b/d week over week to 13.860 mb/d, just 2,000 short of the record 13.862 mb/d posted in the week to November 7 last year. Crude imports, too, rose 350,000 b/d to 5.63 mb/d. As did crude inventory, which increased three million barrels to 411.4 million barrels; stocks of gasoline and distillates went the other way, declining 1.9 million barrels and five million barrels respectively to 212.1 million barrels and 103.6 million barrels. Refinery utilization dropped eight-tenths of a percentage point to 95.8 percent.
E-mini S&P 500: Currently net short 42.9k, up 5.3k.
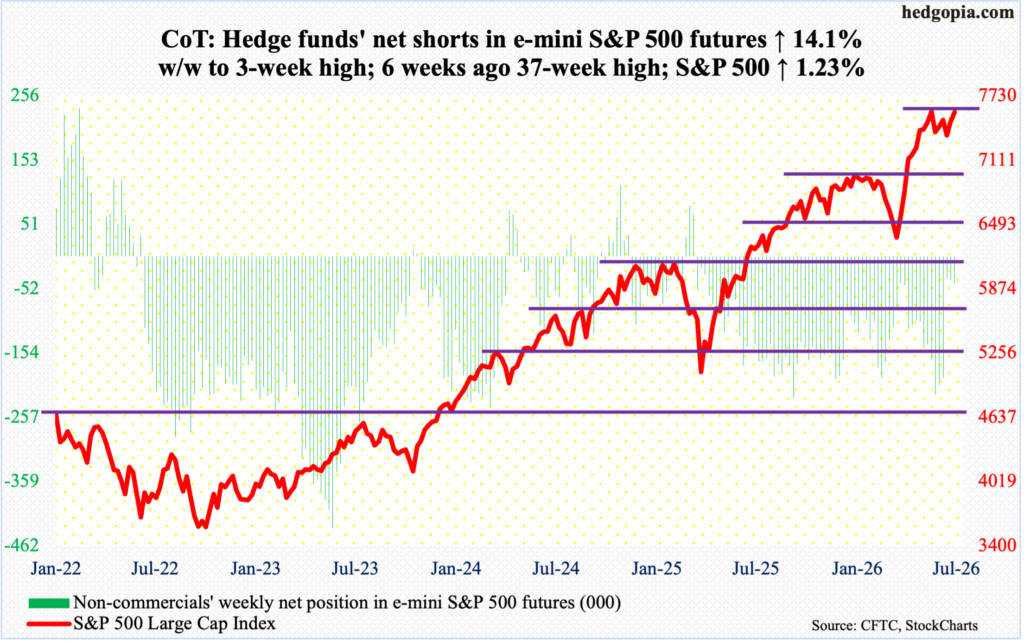
As the June-quarter earnings season begins this week with the major banks and brokers printing their numbers, the S&P 500 has rallied to a juncture where the odds probably favor the bulls more than the bears.
On a weekly basis, the large cap index has rallied back-to-back, with a rise of 1.2 percent this week to 7575; on Wednesday, the 50-day (7433) was successfully tested, with a bullish hammer right on the average. This was the third time in the past month that the index gravitated toward the average, and bids showed up. The S&P 500 peaked on June 2 at 7621. This was followed by a test of the 50-day a week later; this occurred again in the fourth week of June.
As bulls seem reluctant to give up the 50-day just yet, they also managed this week to push the S&P 500 past a falling trendline from the June 2 peak. A test of that peak, and hopefully for the bulls a breakout, looks imminent.
Euro: Currently net short 16.2k, up 17.3k.
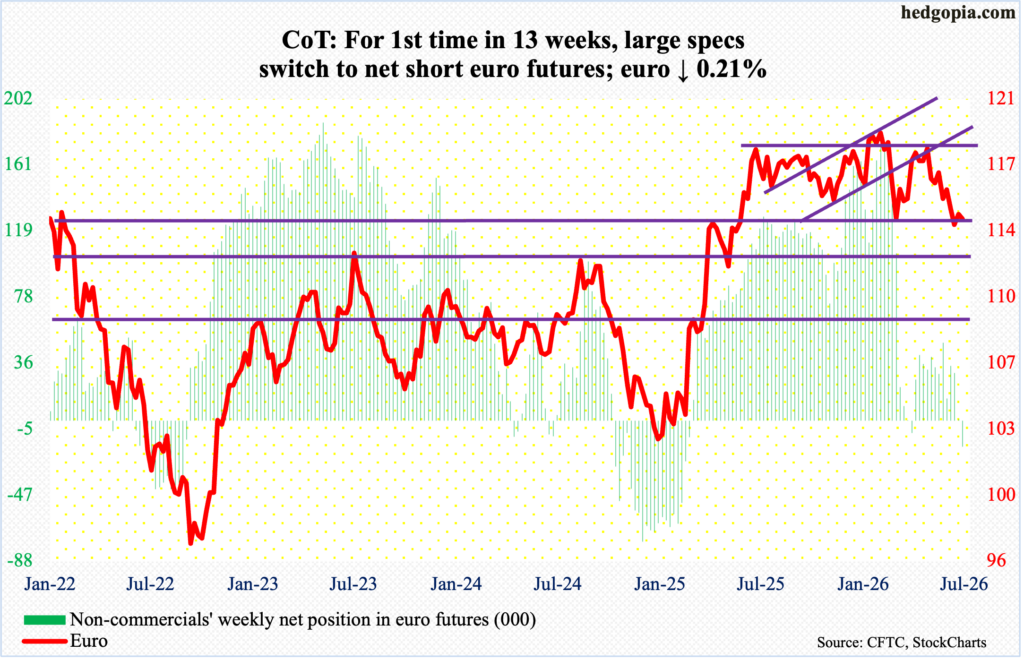
For more than a year, the euro played ping pong between $1.14 and $1.18. Along the way, it tagged a four-and-a-half-year high $1.208 on January 27, while ticking $1.141 on March 13; that low was breached on June 23, with $1.132 tagged in the next session. The rally that followed, however, is meeting with resistance at $1.147s, including this Friday’s intraday high of $1.146; the week ended down 0.2 percent to $1.141.
Non-commercials are convinced the currency has hit the wall. They have switched to net short, following 12 weeks of net longs in a row. They may have a point right here and now, unless the weekly, which has now been pushed into oversold territory, exerts control.
Gold: Currently net long 194.2k, up 227.
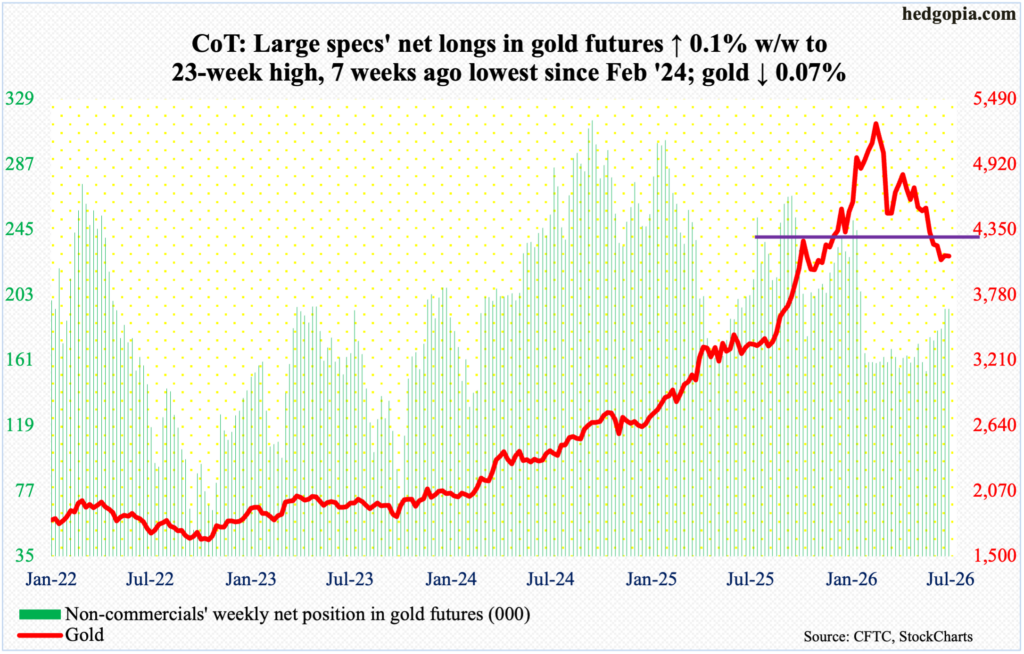
Six weeks ago, gold bugs failed to defend horizontal support at $4,370s. This was preceded by an intraday peak at $5,608 on January 29, followed by a series of lower highs. In October 2023, gold bottomed at $1,810, and at $3,312 last August.
This week, gold was essentially flat at down 0.1 percent to $4,120/ounce. This was the fifth down week in six; in the last 12, there have only been three positive weeks.
That said, bulls should like the fact that bids did show up last week just above lateral support at $3,900, with buying pressure evident in the recent weekly candles. If the momentum continues, then they can have a go at the broken $4,370s, which this time around also lines up with the 50-day at $4,371; the 200-day lies above at $4,472.
Nasdaq (mini): Currently net long 2.1k, up 9.7k.
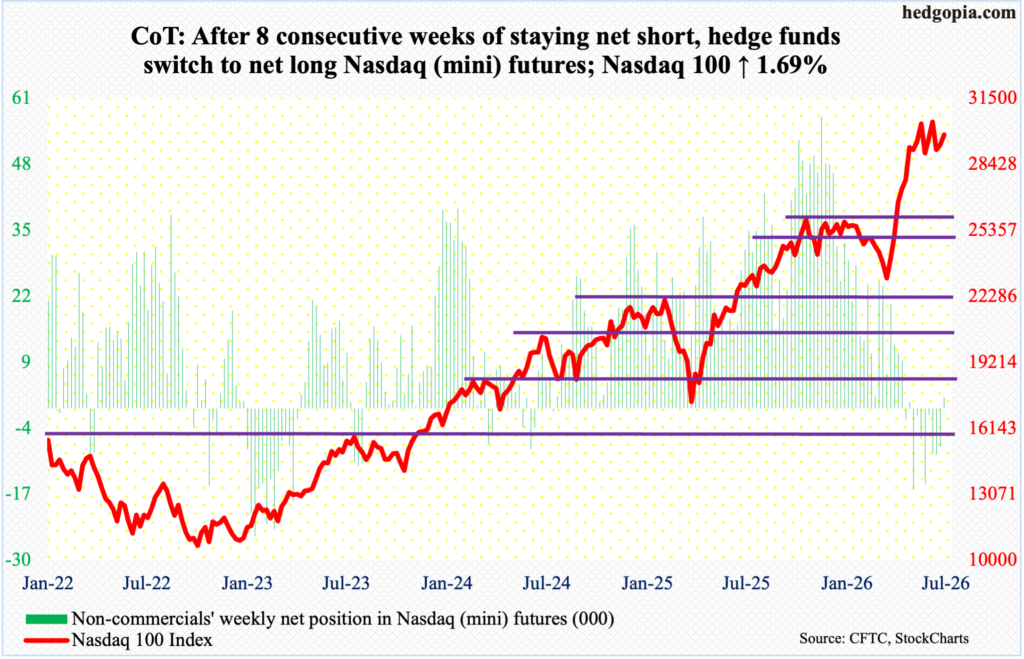
Daily Bollinger bands are tightening on the Nasdaq 100. When this happens, this tends to precede a sharp move – either up or down. The major tech companies do not report until later this month. Ahead of this, the tech-heavy index has refused to yield the 50-day, which was breached on a closing basis on both Tuesday and Wednesday this week but was reclaimed by Thursday. For the week, the index added 1.7 percent to 29825 with a bullish weekly hammer.
The index has essentially gone sideways for several weeks. On June 3, the Nasdaq 100 reached a fresh intraday high of 30762, with heavy resistance at 30600s. The recent sideways move follows a 34.7-percent surge from March 30 when the index bottomed at 22841.
As things stand, 30600s will decide if tech bulls can prolong the most recent momentum. As far as non-commercials are concerned; they are voting with their money, having just switched to net long.
Russell 2000 mini-index: Currently net short 31k, up 5.4k.
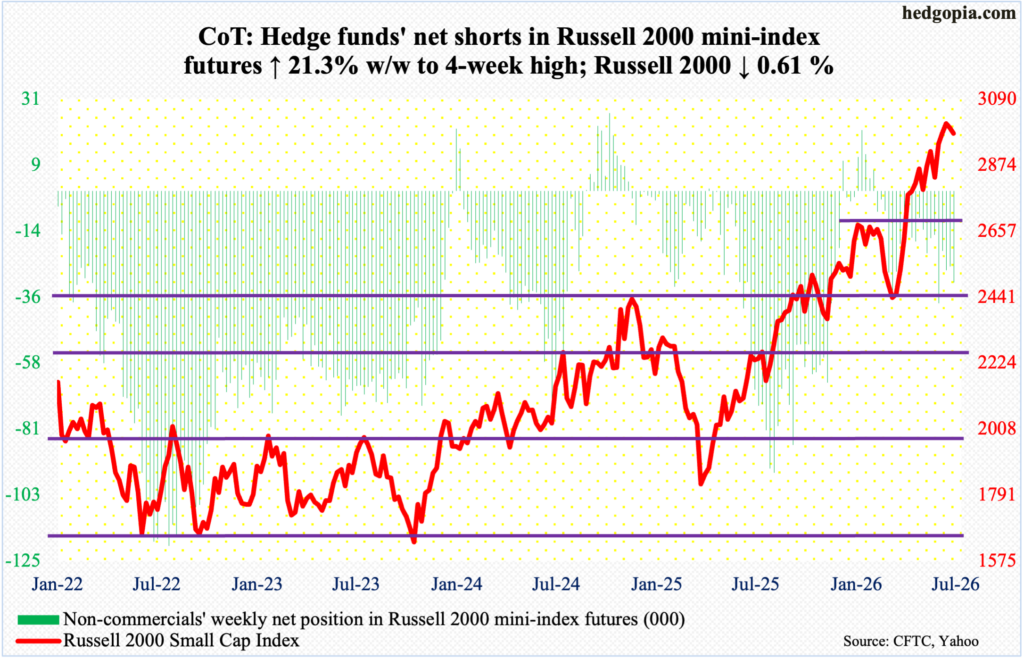
While large-cap indices like the Nasdaq 100 have been consolidating their three-month gains, the Russell 2000 was posting a new high until last week, when it ticked 3047 on the 1st this month. On March 30, the small cap index bottomed at 2405. Between then and now, the Russell 2000 has taken care of one after another resistance, with the nearest horizontal support at 2940s, followed by 2880s.
This week, the Russell 2000 shed 0.6 percent to 2978, with a high of 3024 on Monday and a low of 2927 on Wednesday. That low arguably tested the afore-mentioned support at 2940s – or maybe not, time will tell.
The weekly in particular seems to be itching to go lower. Should things evolve this way in the sessions ahead, bulls must defend 2880s; else, bears will be eyeing 2720s.
US Dollar Index: Currently net long 13.3k, up 253.
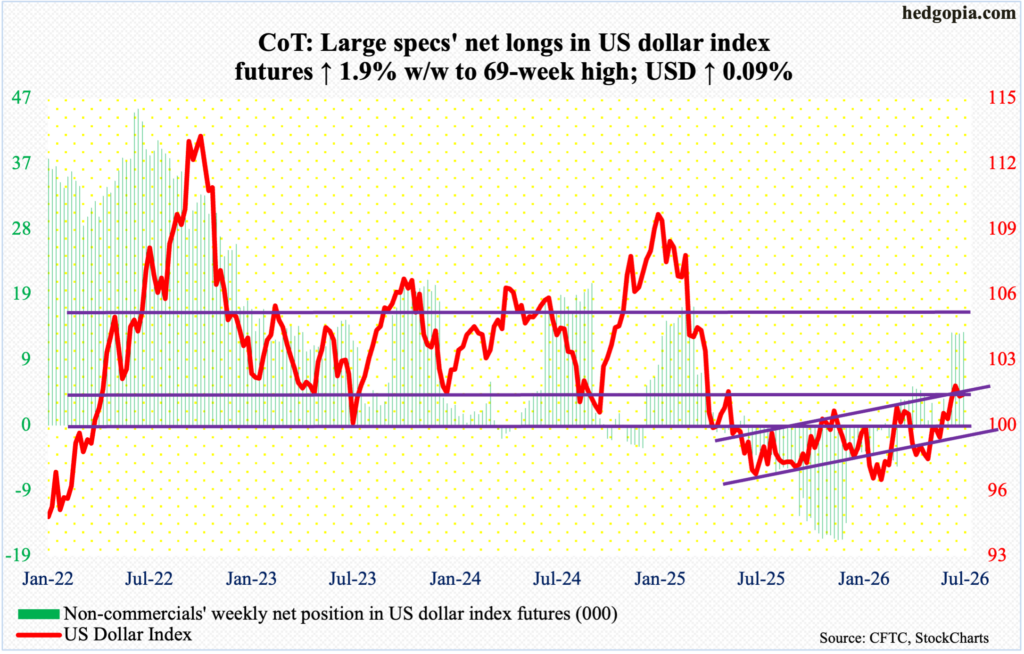
Non-commercials have been very bullish in the last four weeks, with net longs at a 69-week high in the latest week. Their aggressive posture coincides with a breakout in the US dollar index four weeks ago, closing at 100.76.
The significance of 100 goes back more than a decade, and the level was lost in April last year. More recently, after unsuccessfully trying for five weeks to reclaim 100, including March 31 when an intraday high of 100.64 was hit intraday, longs gave up trying 14 weeks ago. Then, four weeks ago, 100 was reclaimed. On June 24, the US dollar index tagged 101.80, before, dollar bears hope, running out of steam.
This week, the index added 0.1 percent to 100.96 – still above 100 but with rising risks that the weekly begins to unwind the overbought condition it is in.
VIX: Currently net short 64.1k, up 5.6k.
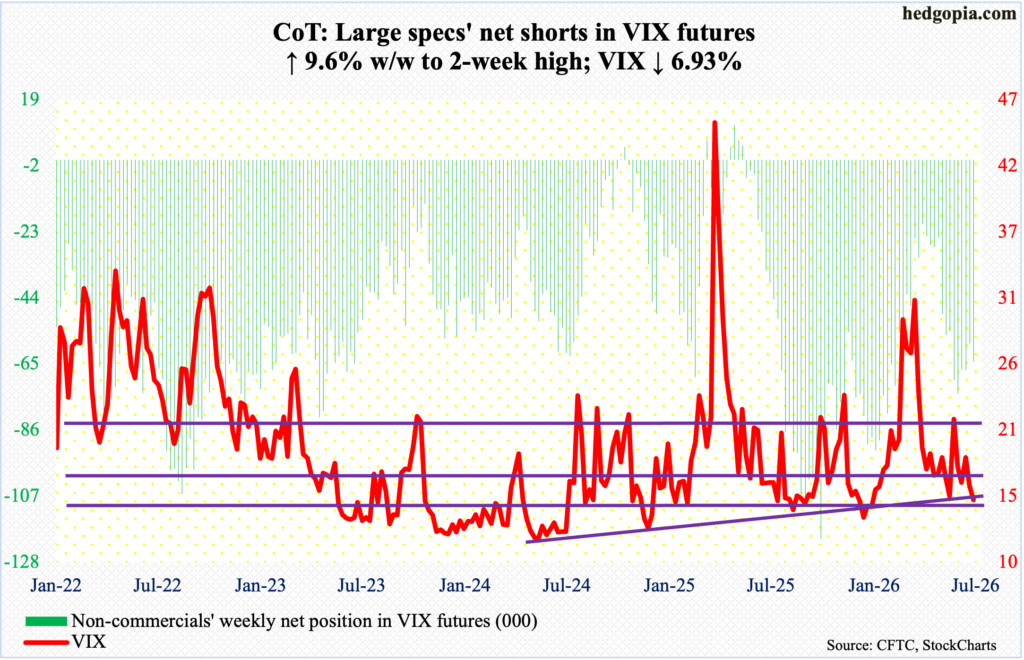
Volatility bulls had a great opportunity to reclaim both the 50- and 200-day (17.41 and 18.66 respectively) on Wednesday with a session high 18.91, but VIX instead reversed to close at 16.90. By Friday, the volatility index closed at 15.03, down 1.12 points for the week; the session low 14.96 was the first time VIX broke 15 to the downside. Immediately ahead, the risk is toward the lower side of 14.
Thanks for reading!
