
Following futures positions of non-commercials are as of August 4, 2026.
10-year note: Currently net short 979.2k, up 103.1k.
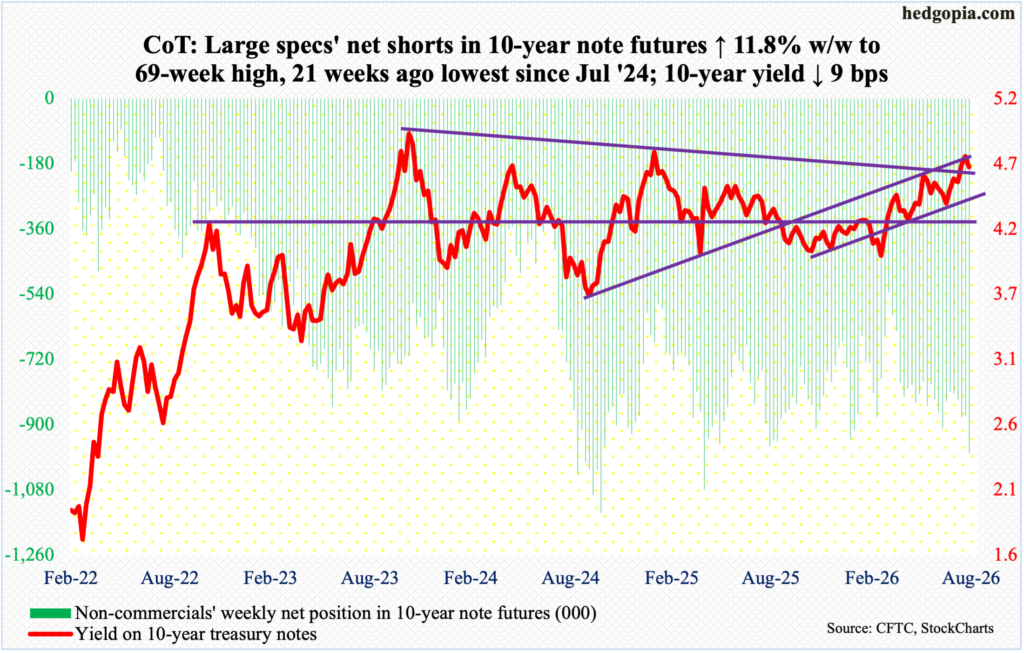
Newly appointed Federal Reserve Chairman Kevin Warsh must be heaving a sigh of relief.
As head of the central bank starting May 22, he chaired his 2nd FOMC meeting last week. On both occasions, he has come across as someone hellbent on breaking the back of inflation, which has remained above the Fed’s stated goal of two percent for five years. During his first FOMC meeting in June, Warsh uttered “this committee will deliver price stability”. In last week’s meeting during which the fed funds rate was left unchanged at a rate of 3.5 percent to 3.75 percent, there were three dissents.
The benchmark rates have been left unchanged since last December when they were reduced by 25 basis points; this preceded a cut of similar magnitude in September and October. Earlier, rates reached a cycle high 5.25 percent to 5.50 percent in July 2023, followed by cumulative cuts of 100 basis points over three meetings in 2024.
Until just a few months ago, the consensus was for continued easing – by at least two 25-basis-point cuts this year. Things gradually began to tilt hawkish as stubbornly high inflation readings persisted, even as the jobs picture relatively held firm. At the CME, futures traders were heavily betting on a quarter-point hike in September (15-16).
Come Friday and July’s jobs report, the interest-rate outlook was quickly turned on its head. The economy lost 23,000 non-farm jobs last month, while May and June were downwardly revised by a combined 103,000; immediately after the news, September rate-hike odds dropped to less than 40 percent at one time (currently 44 percent) from 58 percent going into the report.
Friday’s jobs report has taken a September hike off the table for now, but FOMC doves can hardly rest assured. Between now and the September meeting, there are three inflation reports – CPI for July and August, and PCE for July – and August’s jobs report. If there is any certainty in the interim, it is that things will be volatile.
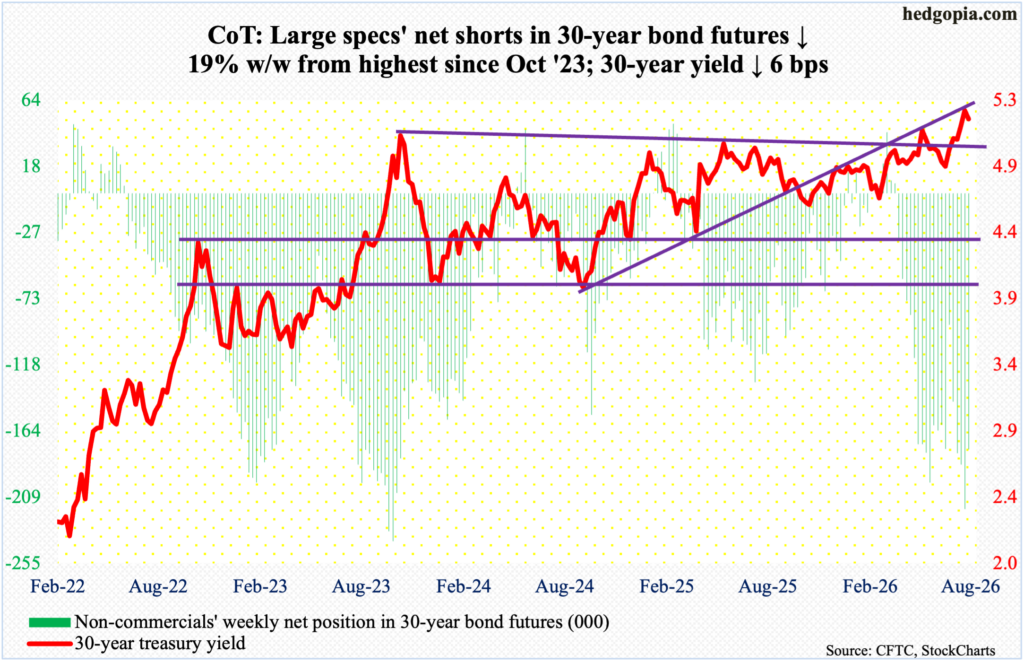
30-year bond: Currently net short 176.3k, down 41.2k.
Major US economic releases for next week are as follows.
The NFIB small business optimism index (July) and existing home sales (July) are on tap for Tuesday.
Small-business job openings rose three points month over month in June to 32 – a two-month high. May’s reading of 29 was a six-year low.
Sales of existing homes in June were down 2.4 percent m/m to a seasonally adjusted annual rate of 4.09 million units – a two-month low.
Wednesday brings the consumer price index (July). For the 12 months ended in June, headline and core CPI increased 3.5 percent and 2.6 percent, in that order. May’s pace of 4.3 percent and 2.9 percent respectively set 37- and eight-month highs.
The producer price index (July) is due to come out on Thursday. From a year ago, headline and core wholesale prices in June jumped 5.5 percent and 5.1 percent respectively.
Retail sales (July) and University of Michigan’s consumer sentiment index (August, preliminary) are scheduled for Friday.
June retail sales inched up 0.2 percent m/m to $768.6 billion (SAAR) – a record.
In July, consumer sentiment jumped 5.7 points m/m to 55.2. May’s 44.8 recorded a new low.
WTI crude oil: Currently net long 114.9k, down 9.2k.
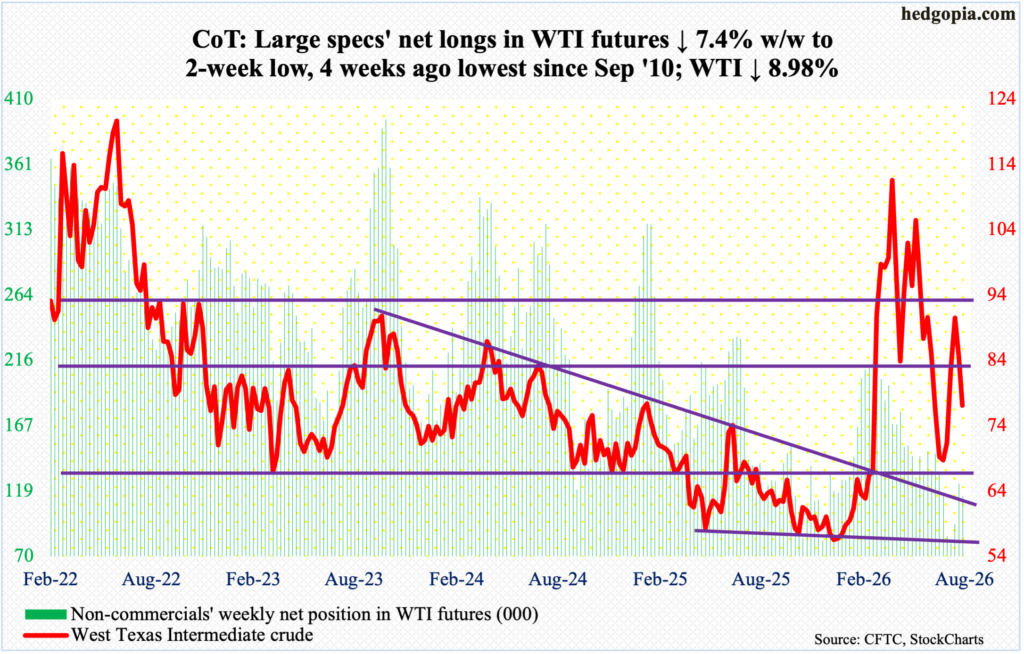
West Texas Intermediate crude fell for the second week running, down nine percent this week to $77.07/barrel. This preceded three up weeks in a row after bottoming at $67.04 on July 2. That bottom filled a gap from March 2 when the crude gapped up reacting to the February 28 U.S. and Israel military attack on Iran. On February 27, WTI closed at $67.02, with a session high of $67.83 and a low of $64.85.
The July 23 high of $93.50 represents a series of lower highs after WTI peaked at $119.48 on March 9. This week, Tuesday’s high $82.33 would have reclaimed the 50-day moving average ($80.43) but only for selling to pick up steam. The crude is currently just above the 200-day ($76.20).
Selling of late has driven WTI into oversold territory on the daily. If oil bulls cannot defend the 200-day in the sessions ahead, bears will be eyeing the early-July low.
In the meantime, as per the EIA, US crude production in the week to July 31 increased 8,000 barrels per day week over week to 13.804 million b/d; in the week to July 10, production of 13.861 mb/d was only 1,000 short of the record 13.862 mb/d posted in the week to November 7 last year. Crude imports grew 515,000 b/d to 6.2 mb/d. As did crude inventory which rose 2.5 million barrels to 407 million barrels; stocks of gasoline and distillates respectively were down 1.6 million barrels and 3.5 million barrels to 209.7 million barrels and 107.2 million barrels. Refinery utilization dropped seven-tenths of a percentage point to 96.5 percent.
E-mini S&P 500: Currently net short 27.3k, up 10.1k.
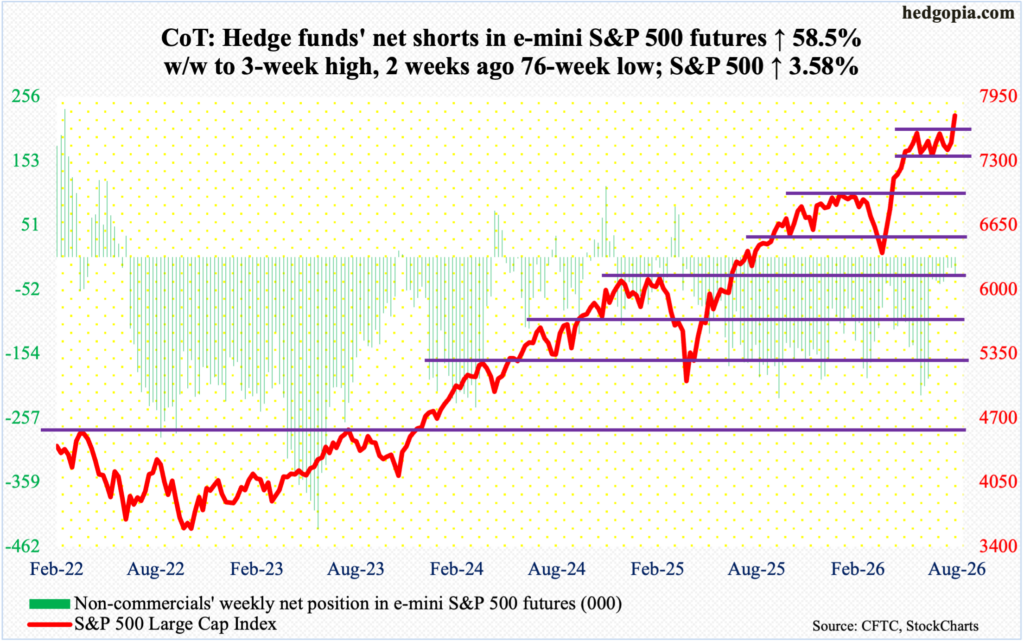
The suppressed energy captured in the narrow Bollinger bands was resolved with a sharp move higher, as the S&P 500 shot up 3.6 percent this week to 7758. The large cap index had been in consolidation mode for a couple of months since it peaked at 7621 on June 2; the subsequent drop bottomed at 7238 a week after that on the 9th, with bids showing up at 7300s.
This week’s action to a new high preceded a false pennant breakdown a couple of weeks ago. With the fresh breakout, the ball now is decidedly in the bulls’ court; using a measured-move approach, they can target just north of 7900, the case for which gets bolstered should near-term possible weakness to a breakout retest of 7600 gets defended.
Euro: Currently net short 58.1k, down 14.4k.
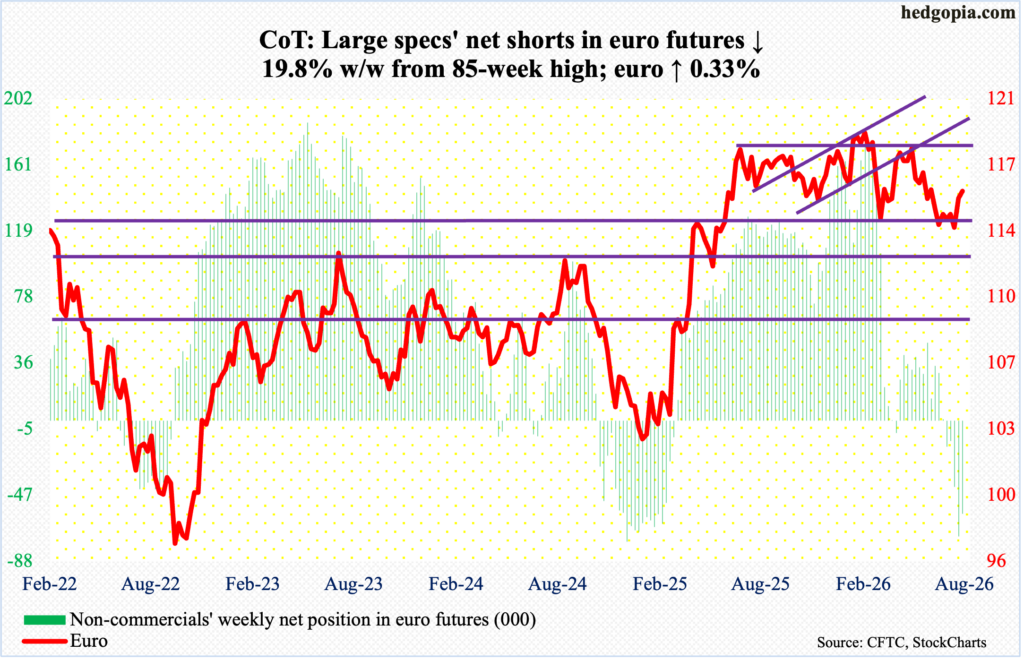
In the wake of last week’s emphatic 1.4-percent gain, the euro trudged higher this week by 0.3 percent to $1.156.
Last week, bulls finally succeeded in taking out $1.147s, which stood like a rock for five consecutive weeks; this also meant a successful defense of one-plus-year range support.
For more than a year, the currency vacillated between $1.14 and $1.18, marked by a four-and-a-half-year high of $1.208 posted on January 27, followed by a low of $1.141 on March 13. A declining trendline from the January high was broken this week, albeit only by a little.
As things stand, positive momentum is stuck in the mud as the weekly RSI is right at the median, even as several daily indicators are overbought. One possibility is the euro rallies to the 200-day ($1.163) and fails.
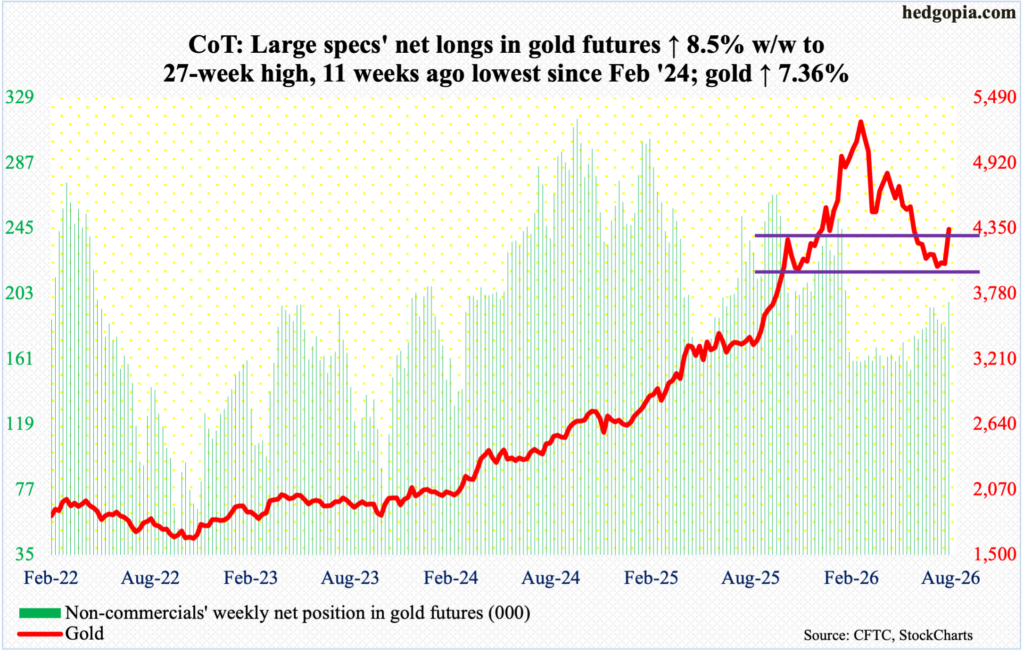
Gold: Currently net long 197.6k, up 15.6k.
Better late than never!
Gold bugs finally put their foot down at what was turning out to be crucial support. Going into this week, gold went sideways just above horizontal support at $3,900-$4,000 for six consecutive weeks. This followed a downward trend starting January 29 when the metal peaked at $5,608. Earlier, it bottomed at $1,810 in October 2023, and at $3,312 last August.
This week, Monday’s low $4,019 was never revisited, as gold rallied in four of the five sessions, jumping 7.4 percent to $4,341/ounce – past the 50-day ($4,167). A rally to test the 200-day ($4,482) would mean gold bulls would have recaptured $4,370s, where resistance goes back to last October; Friday’s high was $4,372.
Having thwarted a possible breach of crucial support, bulls deserve the benefit of the doubt.
Nasdaq (mini): Currently net short 14.6k, up 19.6k.
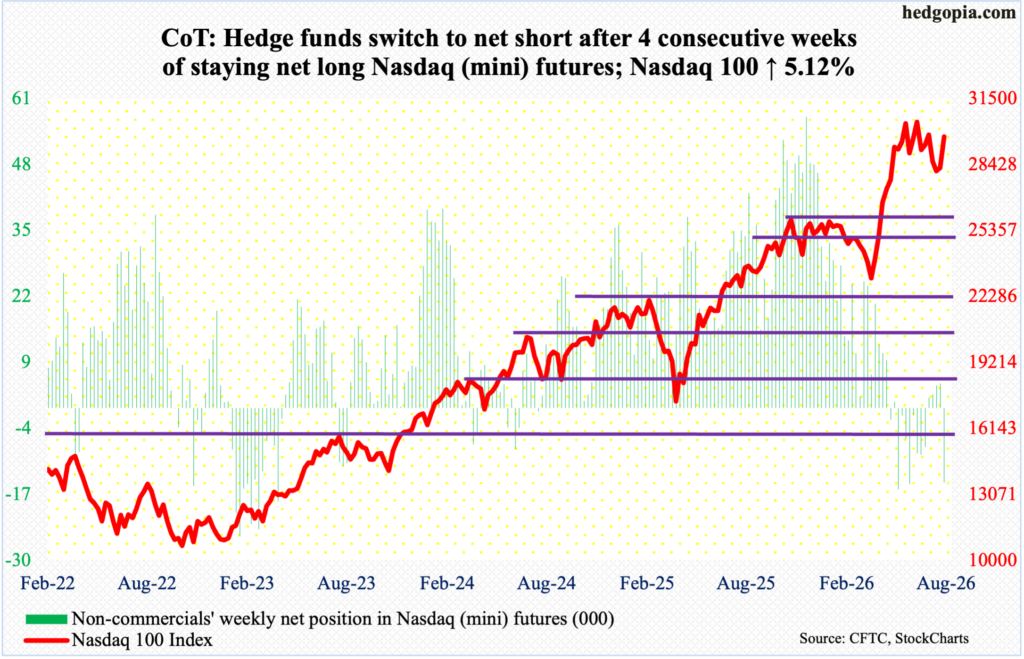
Bullish momentum was so strong this week that tech bulls reclaimed not only horizontal resistance at 28500s but also the 50-day (29369). When it was all said and done, the Nasdaq 100 jumped 5.1 percent this week to 29722. Unlike the S&P 500 that broke out to a new high this week, the Nasdaq 100 is still 3.5 percent from the June 3 peak of 30762. This week’s jump follows a 11.7-percent tumble from that high through the July 29 low of 27176.
In the right circumstances for tech bulls, trendline resistance from the June 3 peak will be tested at 30000.
Russell 2000 mini-index: Currently net short 34.7k, up 18.5k.
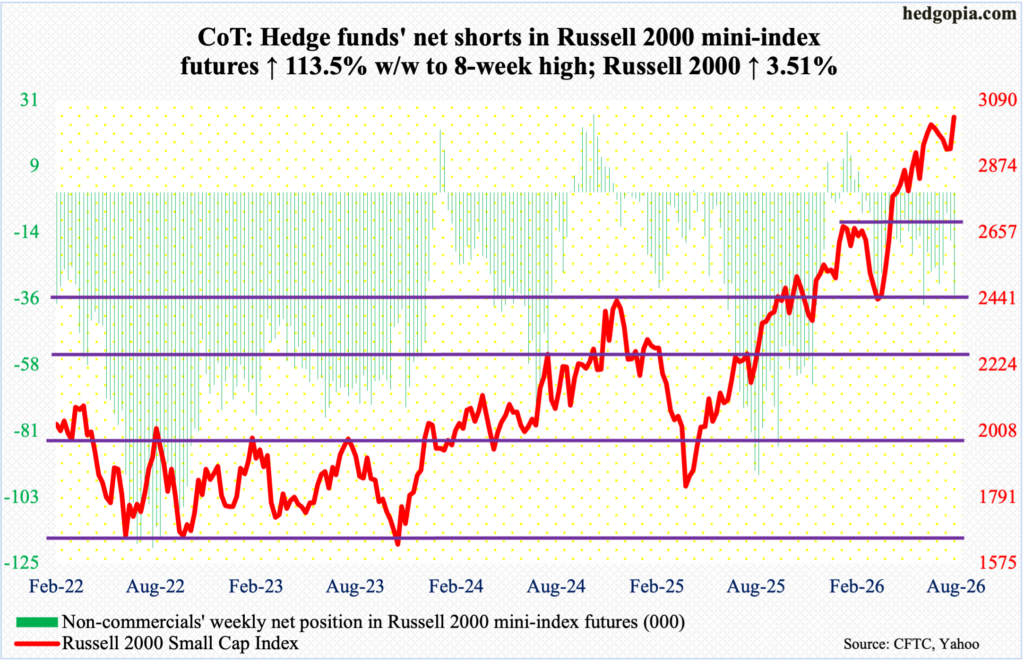
The Russell 2000 is itching for a breakout. This week, the small cap index added 3.5 percent to 3034, with Wednesday’s intraday high of 3049 slightly edging past the prior high of 3047 from July 1.
This week’s price action follows four consecutive down weeks after the early-July peak concurrent with last week’s defense of horizontal support at 2880s. As things stand, a breakout is the path of least resistance.
US Dollar Index: Currently net long 22.5k, up 5.3k.
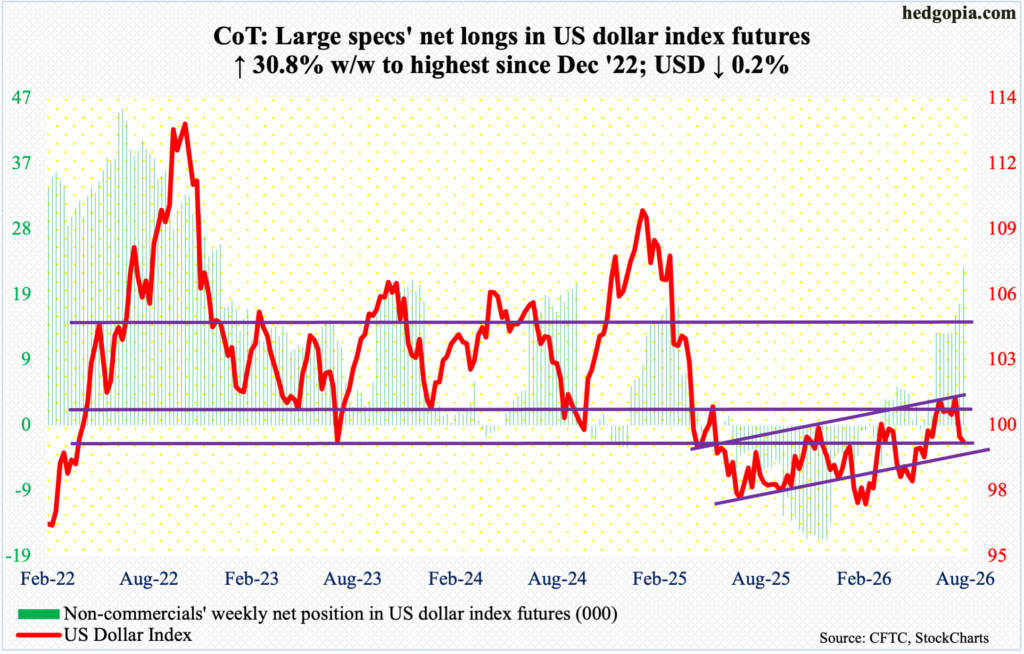
Last week, after continuous struggle to get past 101-102 for six weeks in a row, the US dollar index suffered a breakdown of sorts losing 1.6 percent. This week, it continued to lose ground, but only mildly, down 0.2 percent to 99.60.
The 50-day (100.57) was breached last week, and the 200-day (99.18) is close by. This week’s close also puts the index right at trendline support from January 27 when it troughed at 95.55. Earlier, in January last year, after a three-plus-month rally, the US dollar index reversed hard at 110.18, subsequently reaching 96.38 in June and successfully testing that low with a lower low 96.22 in September, followed by the January low, of course.
Right here and now, the trendline support is a must-hold for the bulls.
VIX: Currently net short 61.1k, down 2.3k.
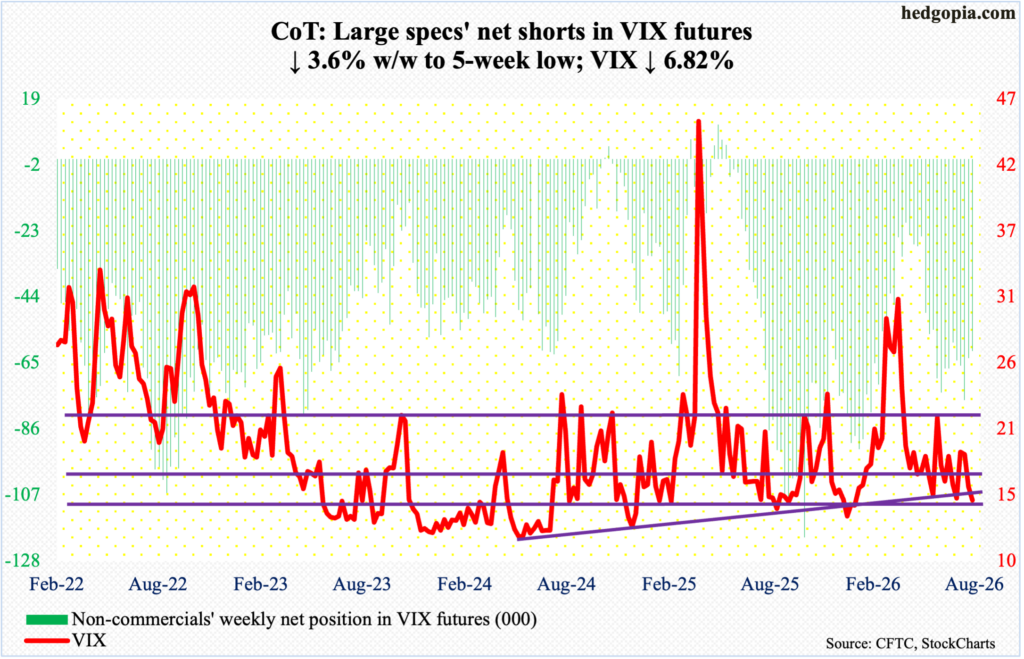
For the first time in seven months, VIX closed with a 14 handle, down 1.09 points this week to 14.90. This was the third down week in succession – and fifth in six.
Momentum is down, with the weekly RSI repeatedly failing to recapture the median for the past four months. This week, the metric closed at 44.39. Volatility bulls must sincerely hope that the low- to mid-40s support does not give way; this, however, also raises the odds that the support holds and VIX begins to reverse higher.
Thanks for reading!
