
Following futures positions of non-commercials are as of August 11, 2026.
10-year note: Currently net short 915.1k, down 64.2k.
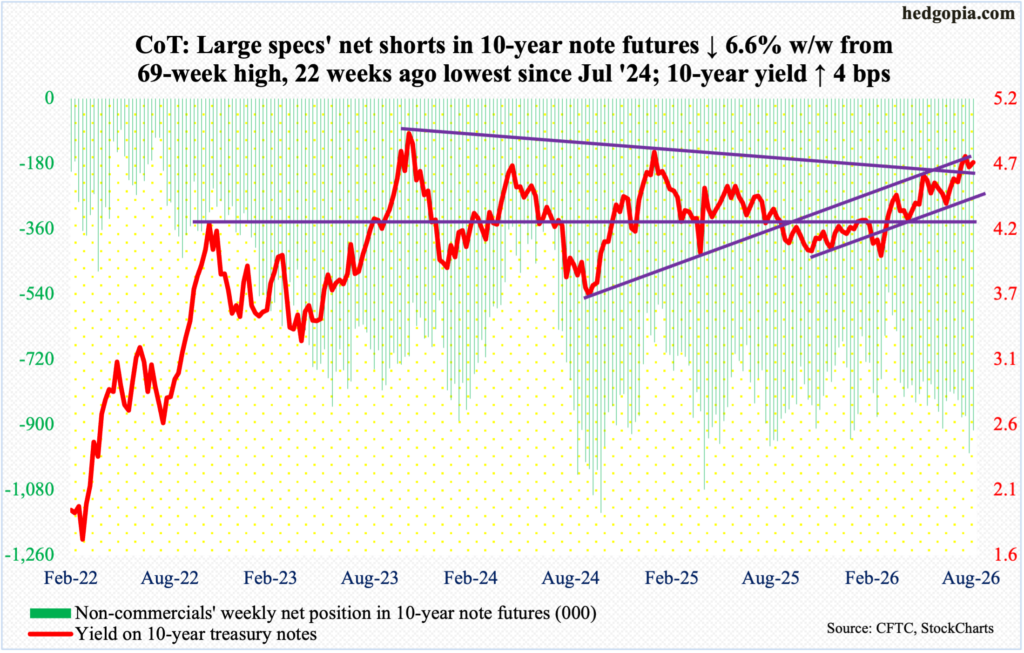
FOMC minutes for the July 28-29 meeting will be published on Wednesday. During the meeting, the fed funds rate was left unchanged at a range of 3.50 percent to 3.75 percent in a 9-3 vote, with the three dissenters being heads of the regional Fed – Beth Hammack (Cleveland), Lorie Logan (Dallas) and Neel Kashkari (Minneapolis).
The minutes can potentially throw more light on the reasons these three dissented, but at this moment much water has flown under the bridge, as several other data points have come along. The abysmal July jobs report that showed a loss of 23,000 non-farm jobs, versus expectations of an increase of 83,000, is front and center. One month does not make a trend but the fact remains that job growth has been in deceleration, with seven monthly losses since January last year – that is, out of 19.
The July jobs report strengthens the hands of FOMC doves – or at least that is how the markets are perceiving it. At the CME, the odds for a quarter-point hike in September (15-16) has dropped to 33 percent, from just under 60 percent going into the August 7 report. Concurrently, both the consumer price index and the producer price index for July did not surprise by exceeding expectations. The doves will obviously seek to hang their hat onto this more than the fact that inflation has been above the Federal Reserve’s stated goal of two percent for more than five years; in July, headline and core CPI respectively grew 3.4 and 2.5 percent from a year ago – a four- and five-month low.
The CME traders, in the meantime, have been all over the map in the last several months – from expectations for this year of at least two quarter-point cuts early this year to pricing in two hikes for a brief period several weeks ago to the current one hike by December, which was pushed up from September. Given these dynamics, right here and now, traders are likely to get tradable nuggets out of Chairman Kevin Warsh’s keynote address at the August 27-29 Jackson Hole Symposium more than next week’s FOMC minutes or the CME’s FedWatch tool.
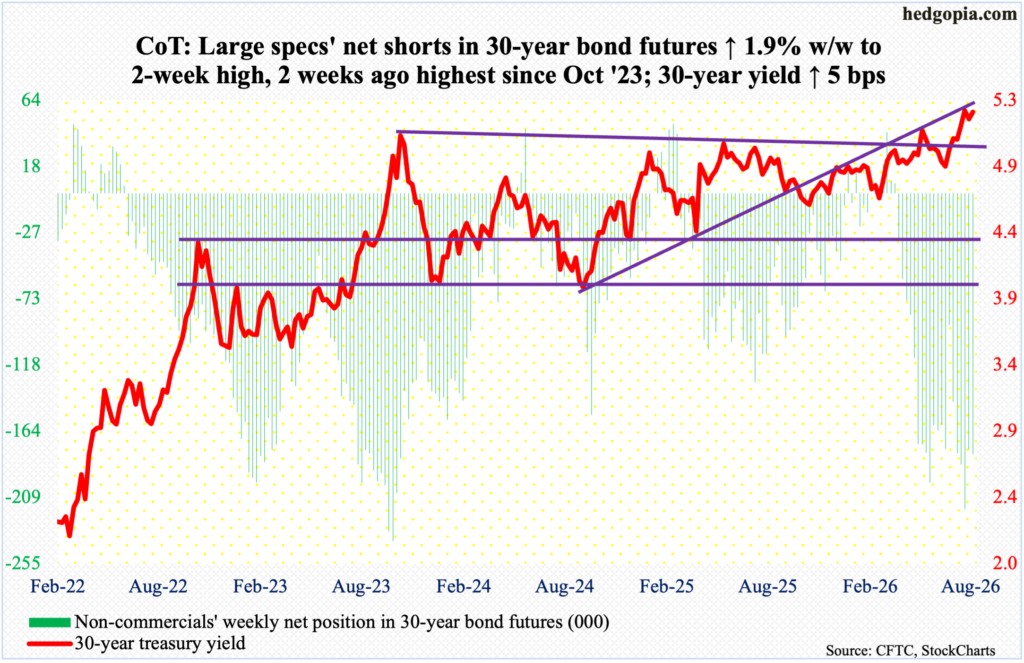
30-year bond: Currently net short 179.6k, up 3.3k.
Major US economic releases for next week are as follows.
The NAHB housing market index (August) is due out Monday. Homebuilder optimism in July dropped two points month over month to 34, matching April’s low.
Housing starts (July) and industrial production/capacity utilization (July) are scheduled for Tuesday.
June housing starts jumped 19 percent m/m to a seasonally adjusted annual rate of 1.43 million units – a three-month high. May’s 1.2 million registered a six-year low.
Capacity utilization edged lower 0.01 percent m/m in June to 76.1 percent, which set a two-month low.
WTI crude oil: Currently net long 92.9k, down 22.1k.
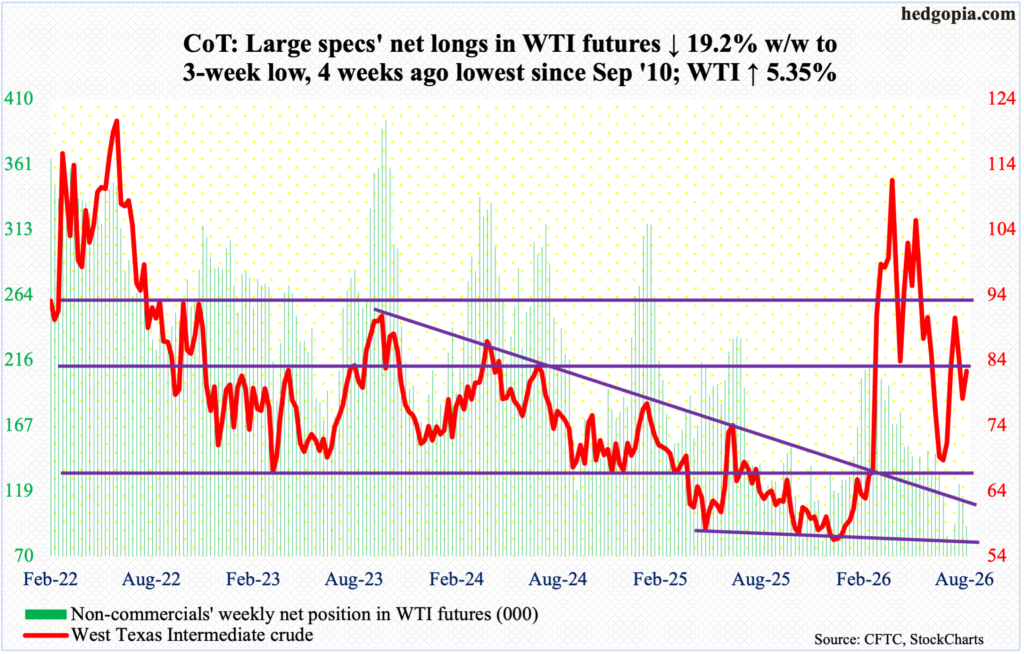
After having defended the 200-day moving average ($76.76) last week, West Texas Intermediate crude also reclaimed the 50-day ($79.53) this week, rallying 5.4 percent to $82.37/barrel.
This was the first up week in three. Earlier on July 23, the crude reached a four-year high $93.50 but only to get rejected at a falling trendline from March 9 when it peaked at $119.48. That resistance now gets tested at just south of $90, which is what oil bulls are probably eyeing for now; this is also where the daily upper Bollinger band ($90.88) lies.
In the meantime, as per the EIA, US crude production in the week to August 7 increased 1,000 barrels per day week over week to 13.805 million b/d; in the week to July 10, production of 13.861 mb/d was only 1,000 short of the record 13.862 mb/d posted in the week to November 7 last year. Crude imports grew 1.1 mb/d to 7.3 mb/d. As did crude inventory which shot up 17.4 million barrels to 424.4 million barrels; stocks of gasoline and distillates respectively were down 968,000 barrels and 10,000 barrels to 208.7 million barrels and 107.1 million barrels. Refinery utilization dropped three-tenths of a percentage point to 96.2 percent.
E-mini S&P 500: Currently net long 11.3k, up 38.5k.
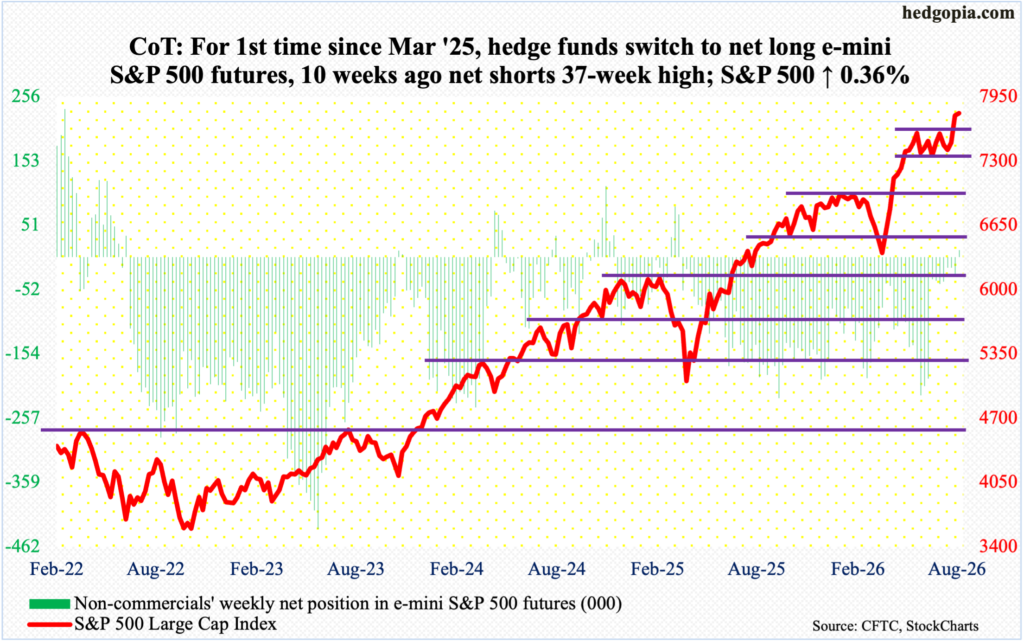
Equity bulls must be hoping non-commercials will not be jinxing the massive bull run in the S&P 500 since the March 30 low (6317). These traders just switched to net long e-mini S&P 500 futures. From the March low, the cash has jumped 23.7 percent through Thursday’s intraday high 7817. For the week, the large cap index rose 0.4 percent to 7786.
This is the first time since March last year that non-commercials have gotten net long. Back then, after 14 weeks of staying net short, these traders switched to net long early March. The cash, in a sideways mode for several weeks, began to come undone in late February and would not bottom until early April.
For a similar scenario to unfold this time around, the bears first need to reclaim near-term horizontal support at 7760s. After that lies crucial breakout retest at 7600. The S&P 500 consolidated for a couple of months after peaking at 7621 on June 2. This hurdle was taken care of last week with a clean breakout; as the index went sideways, there were bids showing up at 7300s. In a perfect scenario for the bulls, hence, longs have a shot at north of 7900, which is arrived at using a measured-move approach. Failing to do so will raise the odds of a 7600 retest in the not too distant future.
Euro: Currently net short 60k, up 1.9k.
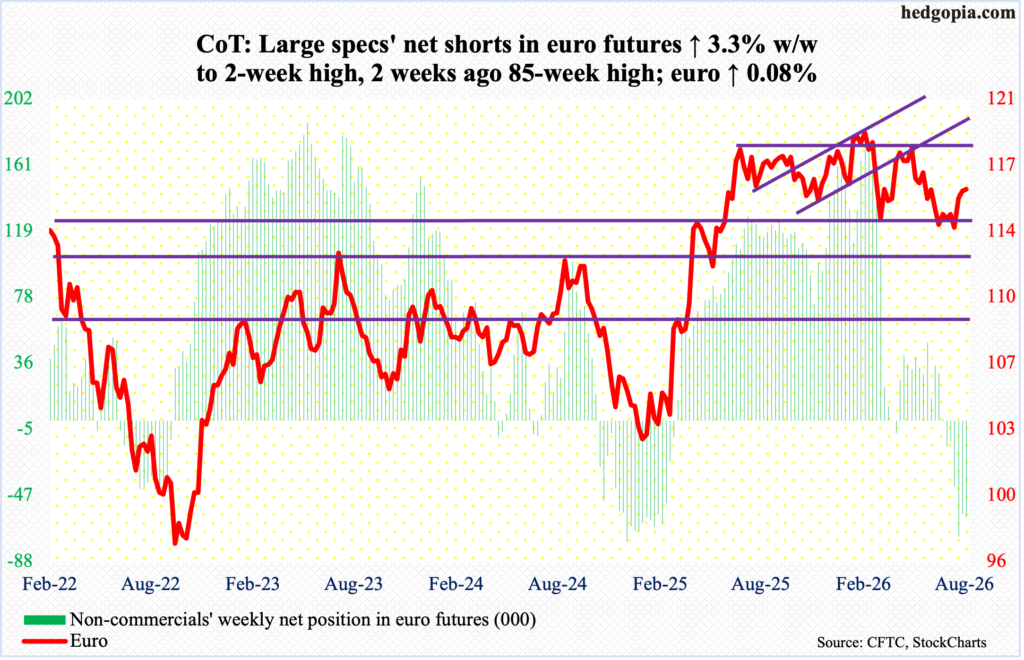
The euro has rallied for three weeks in a row, but not a whole lot of progress has been made in the last two. Three weeks ago when the currency broke out with a 1.4-percent gain, it finished at $1.152; this week, it closed at $1.157, up 0.1 percent. During that breakout, euro bulls finally succeeded in taking out $1.147s, which stood like a rock for five consecutive weeks; this also meant a successful defense of one-plus-year range support.
For more than a year, the euro went back and forth between $1.14 and $1.18, marked by a four-and-a-half-year high $1.208 posted on January 27, followed by a low of $1.141 on March 13. A declining trendline from the January high was broken last week, albeit only by a little.
The weekly has room to run. For now, though, if the euro manages to run toward the 200-day at $1.163, sellers are likely to show up, and the daily will get a chance to unwind the overbought condition it is in.
Gold: Currently net long 217.9k, up 20.3k.
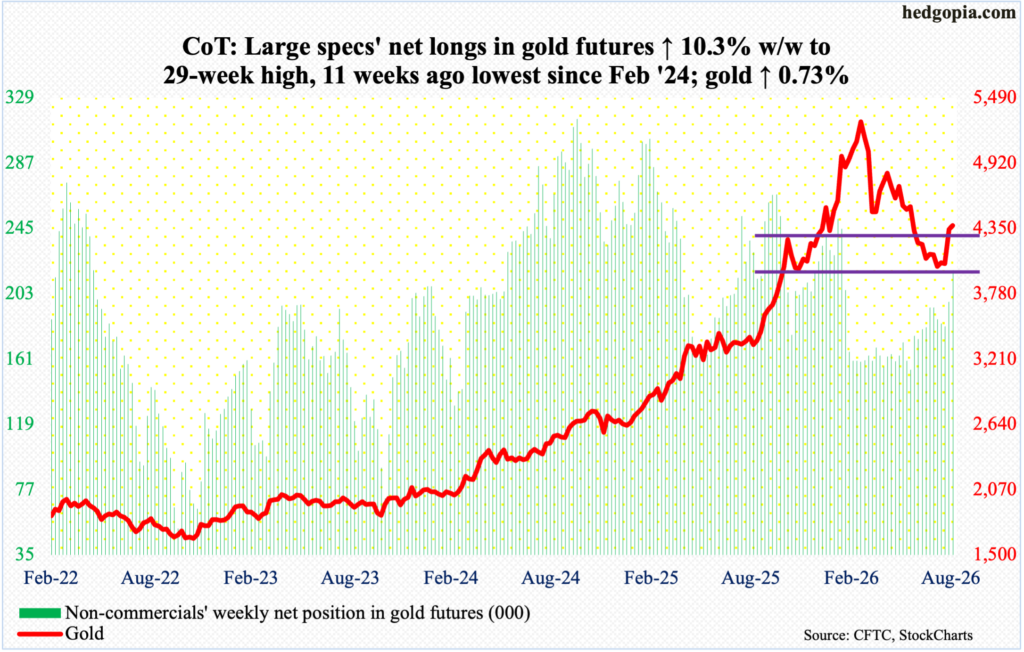
Gold added 0.7 percent this week to $4,375/ounce but it at the same time is struggling just under the 200-day at $4,489, with this week’s high of $4,450 posted on Thursday. Should that high hold, gold bugs would also have recaptured $4,370s, where resistance goes back to last October.
That said, longs deserve praise for having defended crucial horizontal support at $3,900-$4,000 for six consecutive weeks before the metal broke out last week; this followed a downward trend starting January 29 when gold peaked at $5,608. Earlier, it bottomed at $1,810 in October 2023, and at $3,312 last August.
As things stand, it is hard to imagine a clean takeout of the 200-day. The daily is extended, and a test of the 50-day at $4,156 is possible.
Nasdaq (mini): Currently net short 39.3k, up 24.7k.
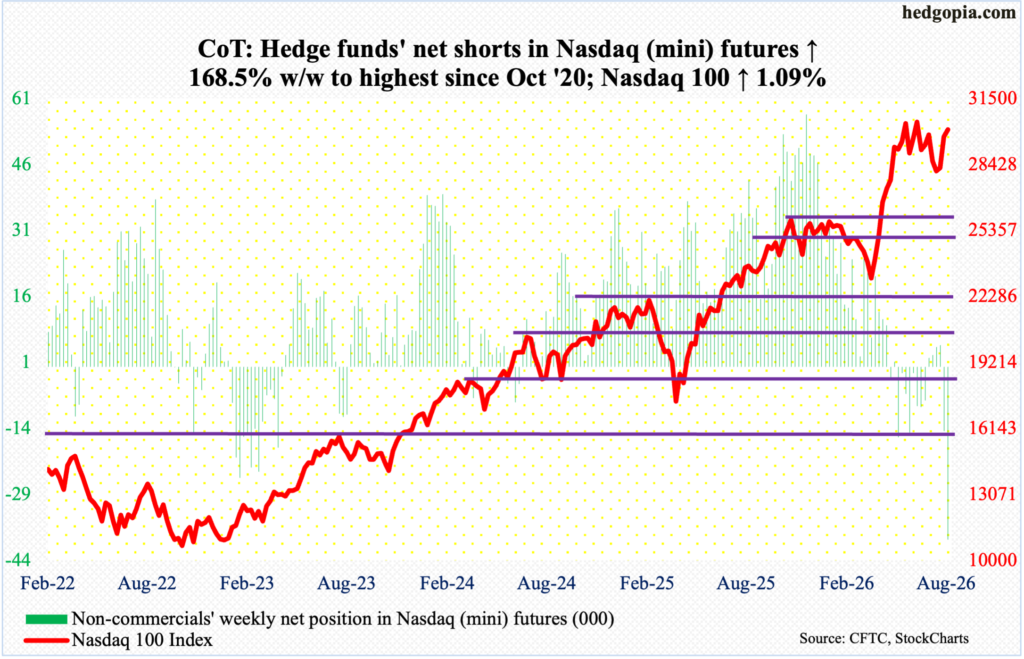
The Nasdaq 100 rallied 1.1 percent this week to 30046 but is underperforming in that it remains 2.4 percent under the June 3 peak of 30762. Peers like the S&P 500 and the Russell 2000 have already rallied to new highs.
If there is anything positive in this week’s action, it is that the tech-heavy index managed to push through a falling trendline from the early-June high; last week, on the 5th, the trendline resistance drew sellers.
Overall action remains lethargic, though. Non-commercials are not convinced this is going to change anytime soon, as they have accumulated net shorts that are the highest since October 2020.
Russell 2000 mini-index: Currently net short 42.3k, up 7.6k.
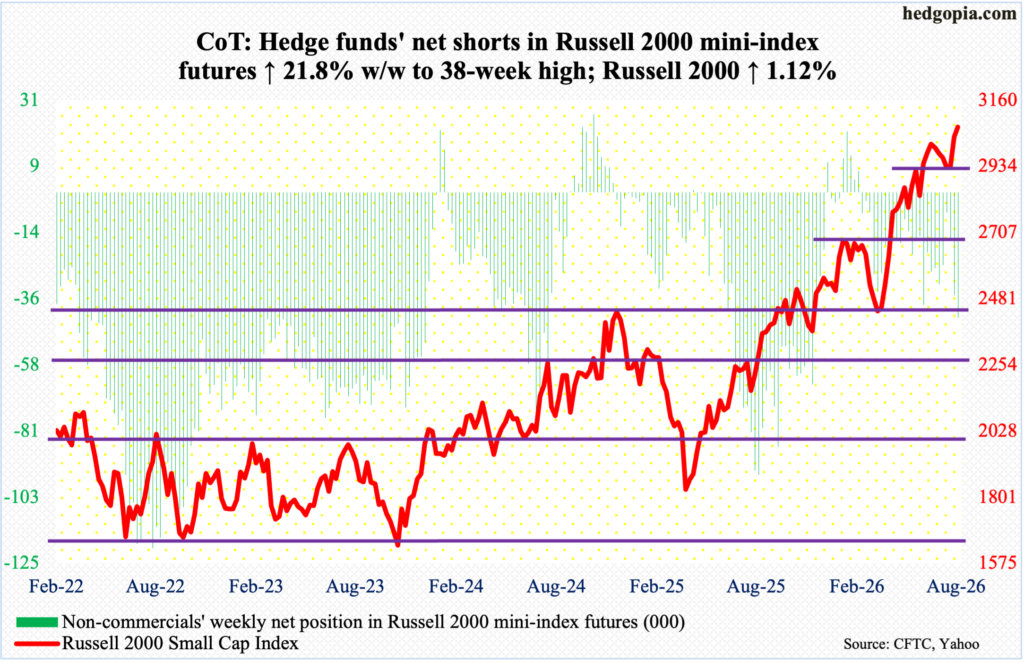
The Russell 2000 squeaked past resistance this week rallying 1.1 percent to 3068, which is a new closing high with an intraday high of 3070 tagged on Friday. This surpassed the prior high of 3049 set on the 5th this month as well as horizontal resistance at 3040s going back to early last month. As a matter of fact, since hitting 3047 on July 1, the small cap index was caught in a pattern of lower highs for four weeks before the downward trend was broken last week.
Ideally, next week, small-cap bulls would cherish if a drop to 3040s is widely embraced. A lack thereof can gradually open the door toward 2940s, and then 2880s, which both acted as decent resistance in the recent past.
US Dollar Index: Currently net long 21.4k, down 1.1k.
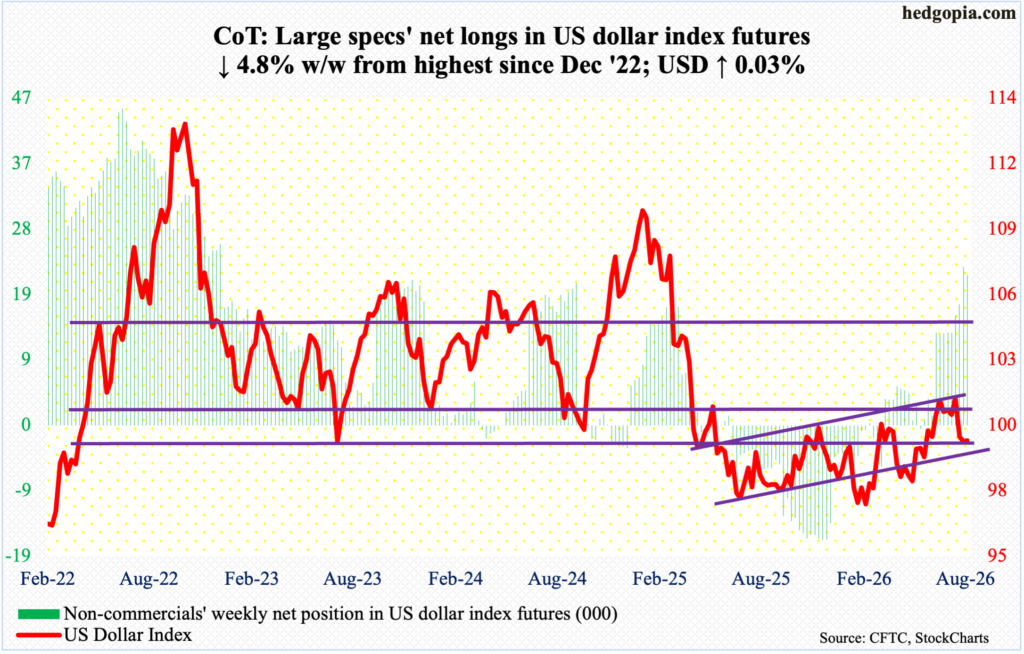
The US dollar index was essentially flat this week, up 0.03 percent to 99.64. A rising trendline from January 27 when it troughed at 95.55 has been breached, albeit by a very small amount.
Earlier, in January last year, after a three-plus-month rally, the US dollar index reversed hard at 110.18, subsequently reaching 96.38 in June and successfully testing that low with a lower low 96.22 in September, followed by the January low.
Most recently, after getting rejected at 101-102 for six weeks in a row, the index gave back 1.6 percent two weeks ago. The significance of 100 – or just north of it – goes back to March 2015, and the current bull-bear duel is for control of that. Bulls are on the defensive as we speak. Downward pressure can intensify should they decisively lose the January trendline support.
VIX: Currently net short 74.9k, up 13.8k.
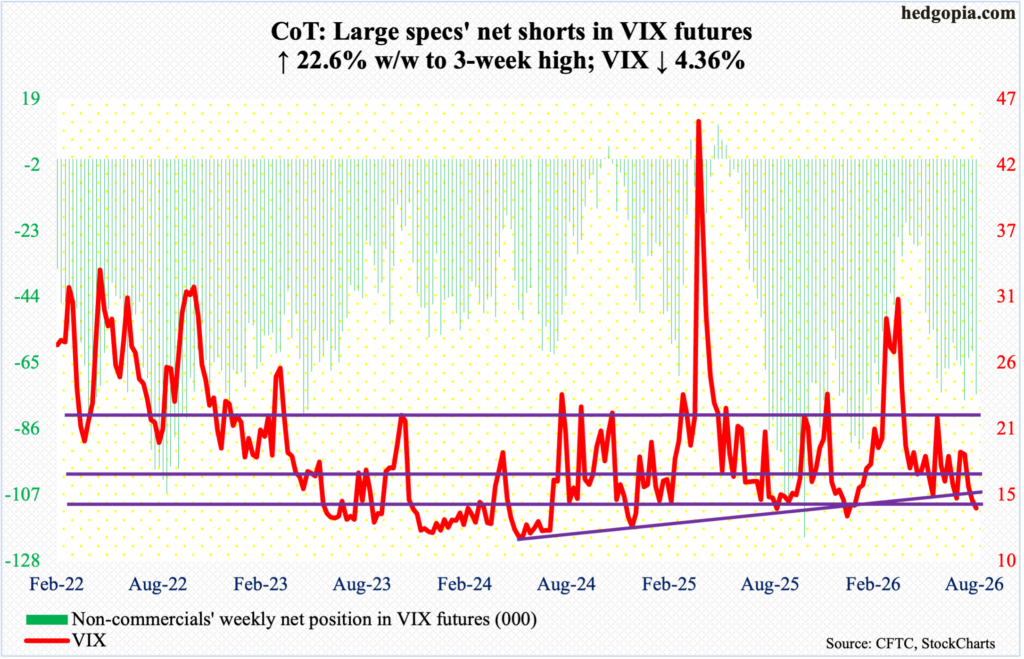
VIX came close to breaking the 14 handle. The volatility index dropped 0.65 points this week to 14.25, with a weekly low of 14.18 reached on Friday. This was the fourth weekly decline in a row. The last time it went sub-14 was last December.
For consolation, volatility bulls can point to the fact that the weekly RSI, which was persistently rejected at the median for several weeks, closed at 43.41; this support has not been broken for nearly three years now.
Thanks for reading!
