
Following futures positions of non-commercials are as of September 29, 2026.
10-year note: Currently net short 900.6k, up 88.9k.
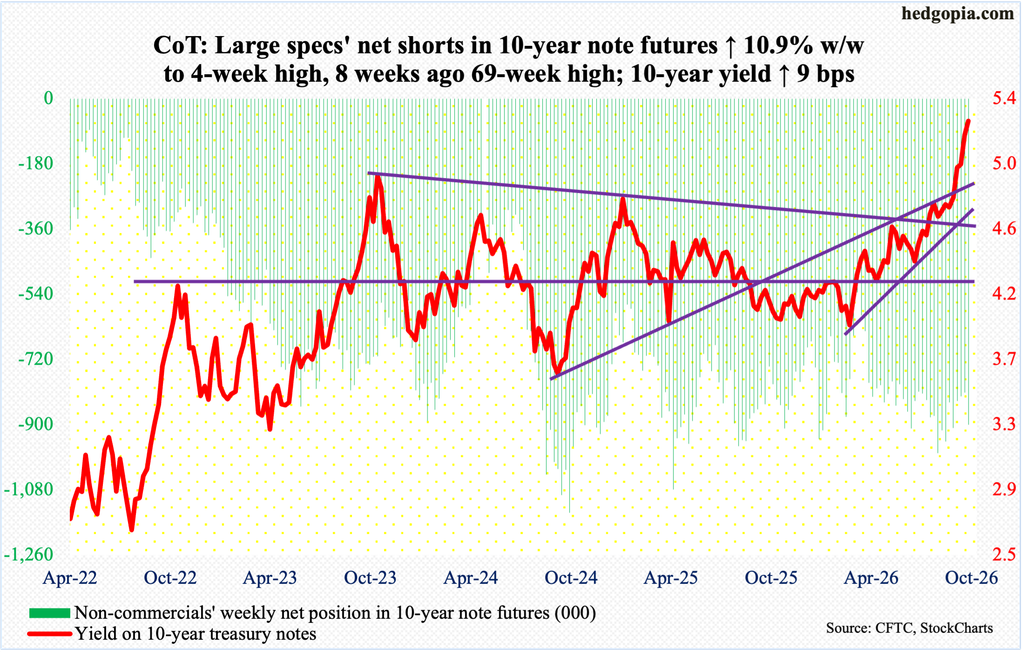
FOMC minutes for the September 15-16 meeting are due out Wednesday. The fed funds rate was raised by 25 basis points to between 3.75 percent and four percent during that meeting. This was the first hike in a little over three years. The base rate has been left unchanged since last December when it was reduced by 25 basis points; this preceded a cut of similar magnitude in September and October. Earlier, rates reached a cycle high 5.25 percent to 5.50 percent in July 2023, followed by cumulative cuts of 100 basis points over three meetings in 2024.
Rates had been pushed lower at a time when inflation – both CPI (consumer price index) and PCE (personal consumption expenditures) – have remained above the Federal Reserve’s stated goal of two percent for over five years.
The central bank has a dual mandate of maximum employment and price stability, with newly appointed Chairman Kevin Warsh seemingly – and rightly – fixated on the latter. The job market is hanging in there, although September disappointed with 29,000 non-farm jobs versus market expectations of 84,000; the unemployment rate rose slightly to 4.2 percent, even as annual wage growth eased to three percent. This led CME futures traders to price out the probabilities of another hike in this month’s meeting, slated for 27-28. They still expect three more 25-basis-point hikes by next June, although until recently they were expecting four hikes by that time.
More importantly, it may be a little premature to completely take out October. September’s CPI will be published on the 14th, two weeks before the scheduled meeting. A hot report will for sure bring the meeting back into play, because inflation is where the focus is currently. Even if September’s CPI comes in softer than expected or in line, and the FOMC decides to go on a hold, it is unlikely to be a unanimous decision, as was last month’s decision to raise the benchmark rates.
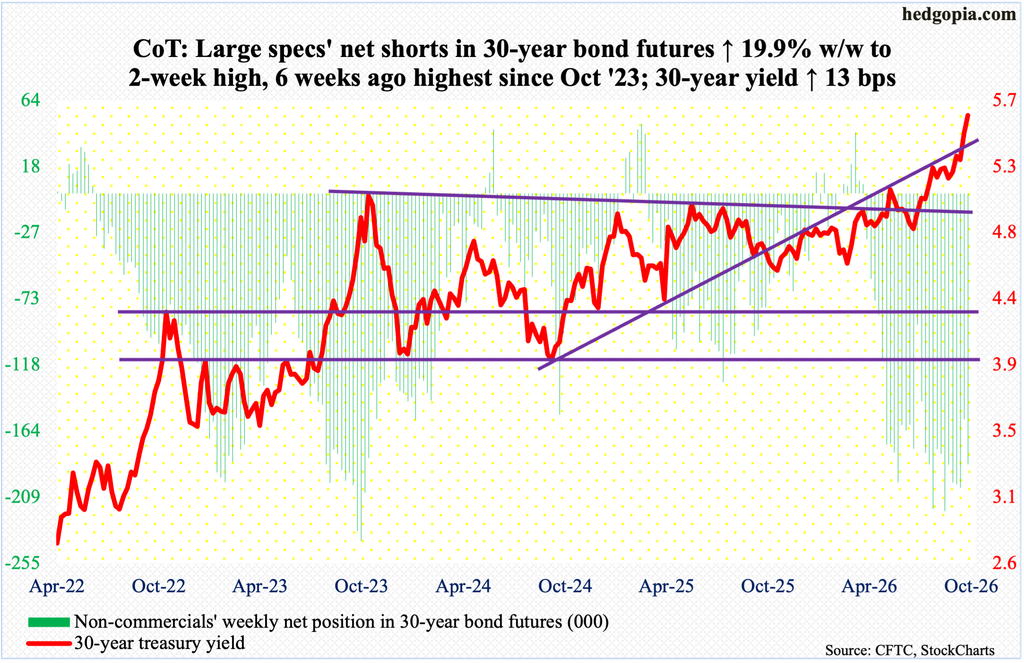
30-year bond: Currently net short 186.9k, up 31.1k.
Major U.S. economic releases for next week are as follows.
The ISM services PMI (September) comes out Monday. Non-manufacturing activity in August increased 1.3 percentage points month over month to 55.4 percent – a six-month high. The economy has expanded for 75 straight months.
Friday brings University of Michigan’s consumer sentiment index (October, preliminary). In September, sentiment tumbled 3.9 points m/m to 47.8. May’s 44.8 set a record low.
WTI crude oil: Currently net long 103.7k, down 30.8k.
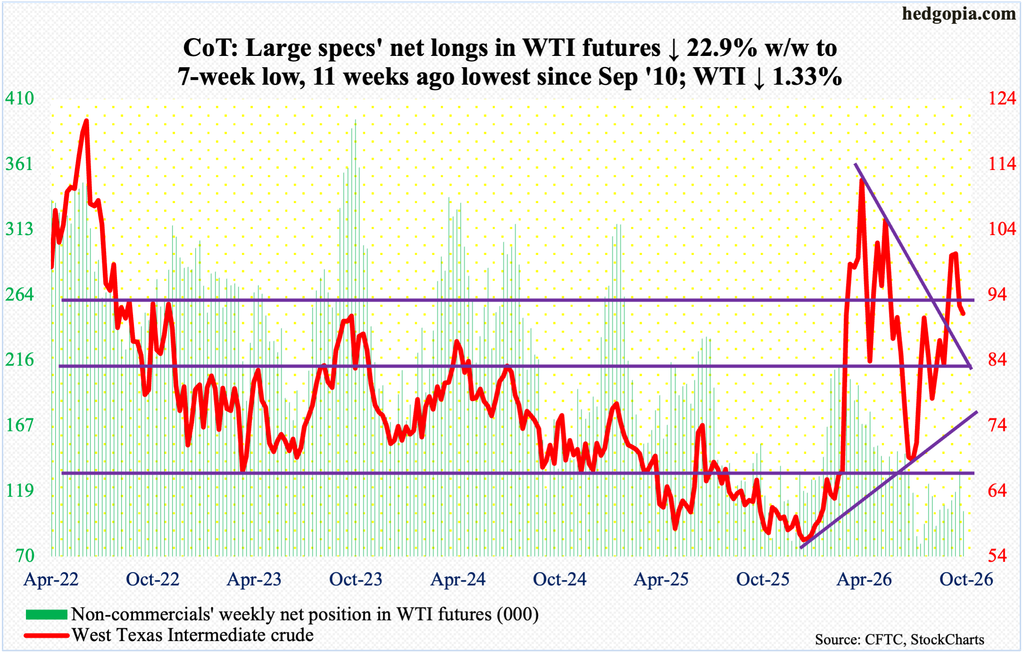
West Texas Intermediate crude gave back 1.3 percent this week to $91.18/barrel, with Friday’s low $88.06 successfully testing the 50-day ($88.40); the crude has loitered above the average for a couple of weeks now.
Immediately ahead, oil bulls have an opportunity to take advantage of the oversold readings on the daily. In this scenario, the September 21 gap-down gets filled just north of $99. In the absence of that, the downward momentum can persist.
WTI has come a long way since July 2 when it bottomed at $67.04, filling a gap from March 2 when the crude had a six-session surge, peaking at $119.48 on the 9th, in the wake of the February 28 U.S. and Israeli military attack on Iran. On February 27, WTI closed at $67.02, with a session high of $67.83 and a low of $64.85.
Most recently, the crude has come under pressure since September 15 when it ticked $106.75 and headed lower. This made up yet another lower high since the March high. A breach of the 50-day can open the door to a test of the 200-day ($82.26).
In the meantime, as per the EIA, U.S. crude production in the week to September 25 increased 16 million barrels per day week over week to 13.955 mb/d, setting a record. Crude imports declined 179,000 b/d to 5.7 mb/d. As did gasoline and distillate inventory, which respectively fell 1.7 million barrels and 2.3 million barrels to 204.4 million barrels and 105.2 million barrels; crude stocks were up 922,000 barrels to 427.3 million barrels. Gasoline inventory is the lowest since November 2014. Refinery utilization shrank 1.5 percentage points to 92.5 percent; four weeks ago, utilization at 98 percent was the highest since August 2018.
E-mini S&P 500: Currently net short 143k, up 9.3k.
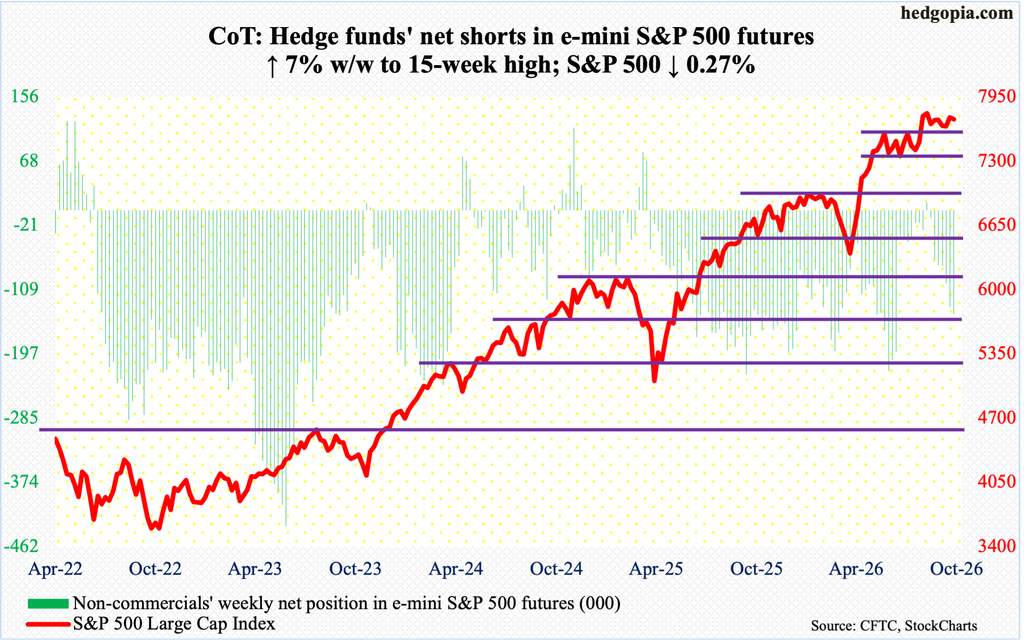
The bull-bear tug of war continued this week. The initial momentum belonged to the bears, but the bulls had the last laugh, although the latter could have finished the week much better.
By Thursday’s intraday low of 7617, the S&P 500 was down 1.6 percent for the week, but, as has been the case for seven weeks now, breakout retest at 7600-plus was defended. The large cap index earlier consolidated for a couple of months after peaking at 7621 on June 2, with a breakout on August 4, followed by a new high 7817 on the 13th that month.
Thursday’s intraday reversal, which also tested the 50-day at 7658, was followed by more gains Friday; Thursday produced a potentially bullish dragonfly doji and Friday a doji. When it was all said and done, the S&P 500 finished the week down 0.3 percent to 7723; that said, bulls were unable to keep the session high 7755, which drew sellers at trendline resistance from the June high. A takeout of this hurdle should open the door toward that high.
Euro: Currently net short 63.3k, up 10.9k.
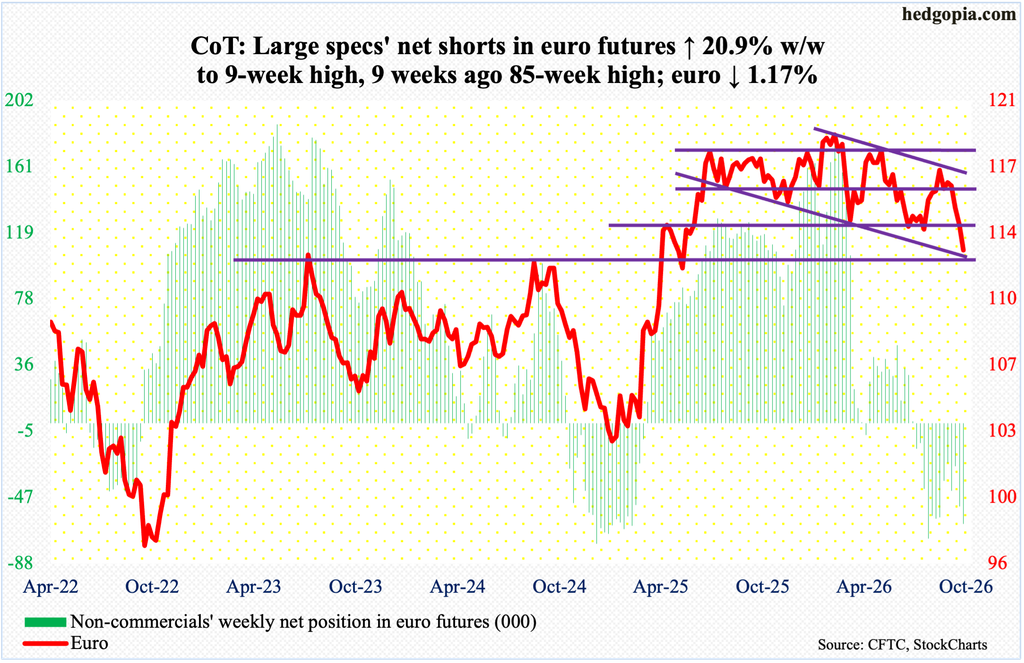
Last week, the euro was on the verge of breaking crucial support. For more than a year, the currency went back and forth between $1.14 and $1.18, marked by a four-and-a-half-year high $1.208 posted on January 27 this year; this was then followed by a low of $1.132 on June 24. A declining trendline from the January high was broken eight weeks ago, but euro bulls failed to build on it.
This week, the euro declined 1.2 percent to $1.126, with Thursday ticking $1.122 intraday; Friday formed a spinning top.
The daily looks primed to rally. There is dual support here – $1.12 horizontal and the lower line of a descending channel.
Gold: Currently net long 218.6k, down 7.2k.
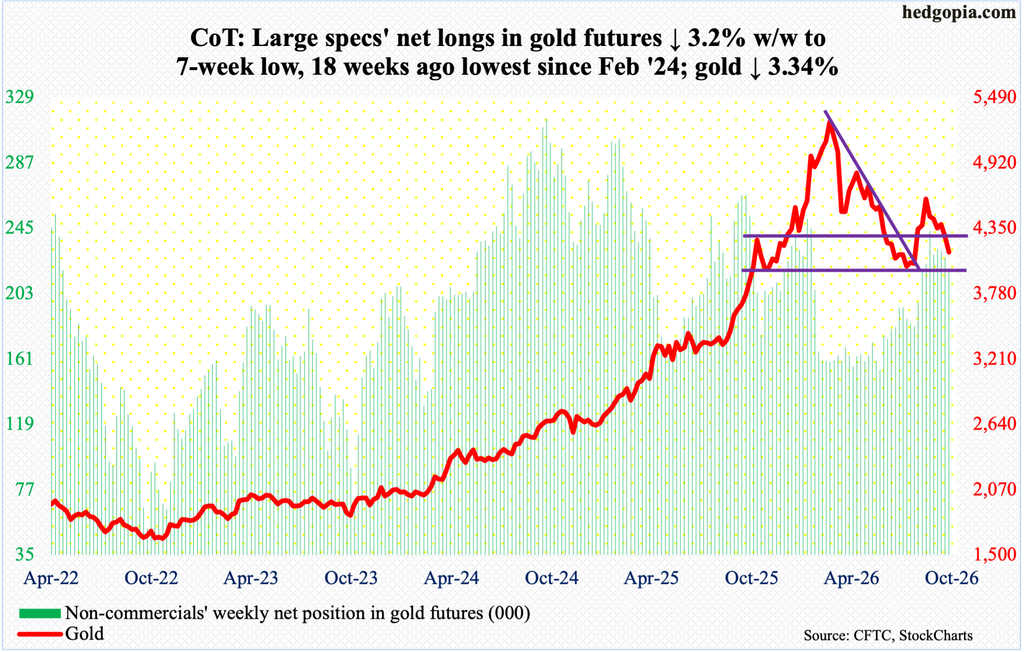
Gold acts like it wants to go test $3,900-$4,000, which is where it found support at for six consecutive weeks in June-July before turning up. Earlier, gold went from $3,312 in August last year – and $1,810 in October 2023 – to a peak of $5,608 on January 29 this year.
The metal dropped 3.3 percent this week to $4,142/ounce. This was the fifth down week in six. After it bottomed at $3,900-$4,000 in June-July, it rallied to tick $4,697 intraday on August 25 before reversing lower.
The yellow metal understandably remains oversold on the daily. In the event of strength near term, there is horizontal resistance at $4,370s-$4,380s, with the 50-day at $4,319.
Nasdaq (mini): Currently net long 51.2k, down 4.9k.
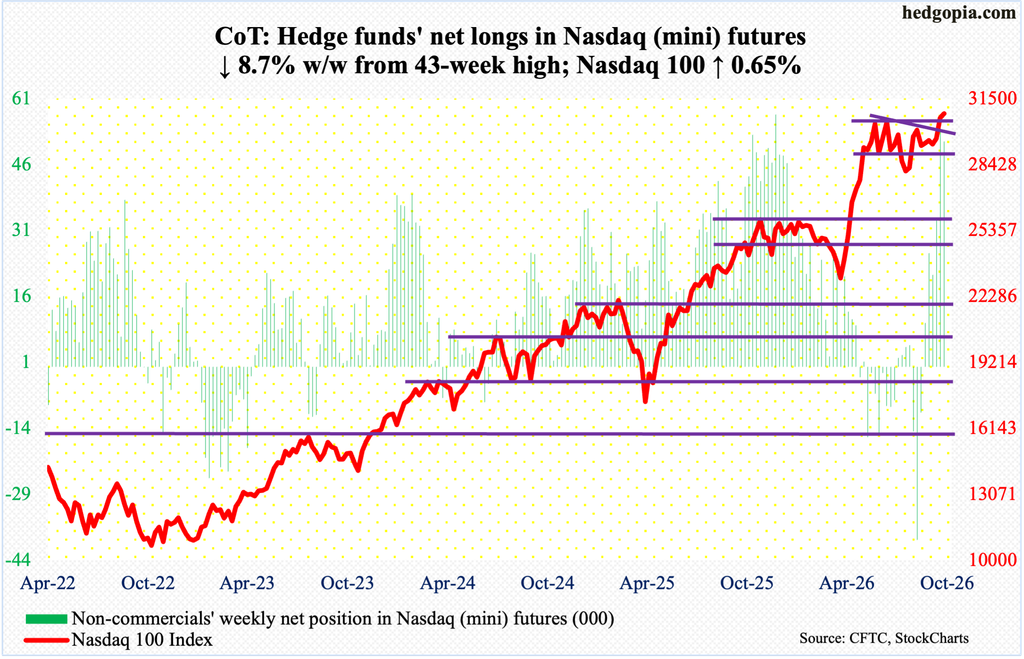
Tech bulls could not quite hang on to Friday’s new all-time high 31018 but managed to push the index up 0.7 percent anyway to 30808; to their credit, the session low 30737 was bought for a crucial breakout retest.
Unlike other major indices like the S&P 500 and Russell 2000, which posted fresh highs in August, the Nasdaq 100 kept trading under the June 2 intraday high of 30762 – until Tuesday last week when it ticked 30771. Bulls defended this level this Friday.
Friday’s breakout was not decisive, but the bulls do have the advantage right here and now.
Russell 2000 mini-index: Currently net short 77.4k, up 1.7k.
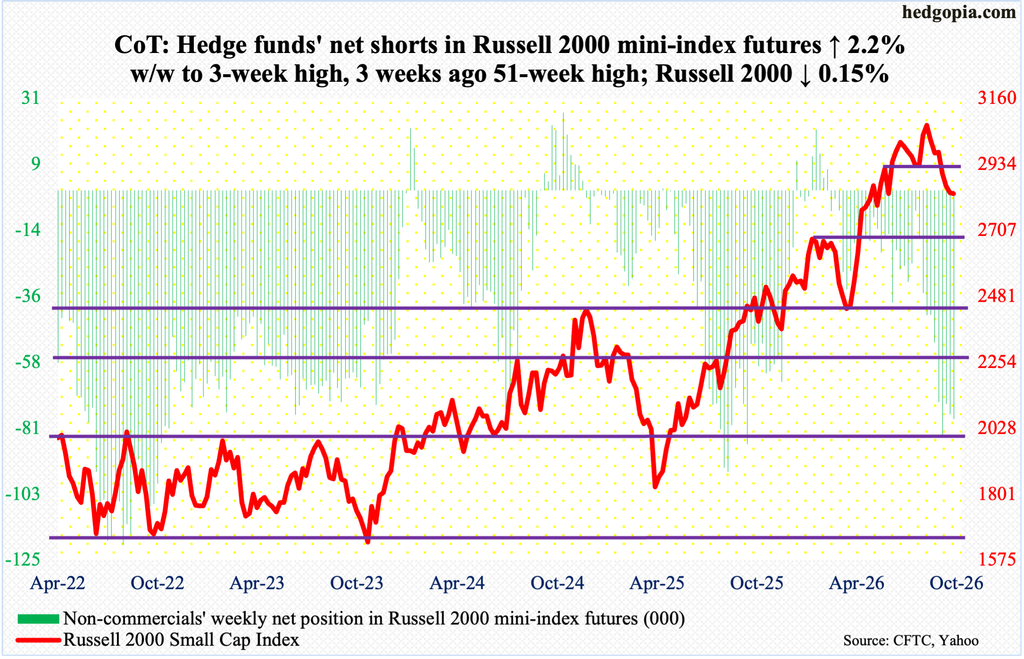
In a topsy-turvy week with a high of 2853 and a low of 2775, the Russell 2000 edged lower this week 0.15 percent to 2833. This was the fourth consecutive down week – and sixth in seven.
The small cap index has been bleeding since peaking at 3070 on August 14. In the week the index reached that high, it broke out of 3040s; we now know the breakout was false. Subsequently, bulls also failed to defend horizontal support at 2940s and 2880s.
The 50-day (2943) has been breached, and the 200-day (2782) was successfully tested on Friday. The index also sits right on trendline support from a major low reached in April last year. Nearest hurdle lies at 2880s.
US Dollar Index: Currently net long 11.9k, up 1.6k.
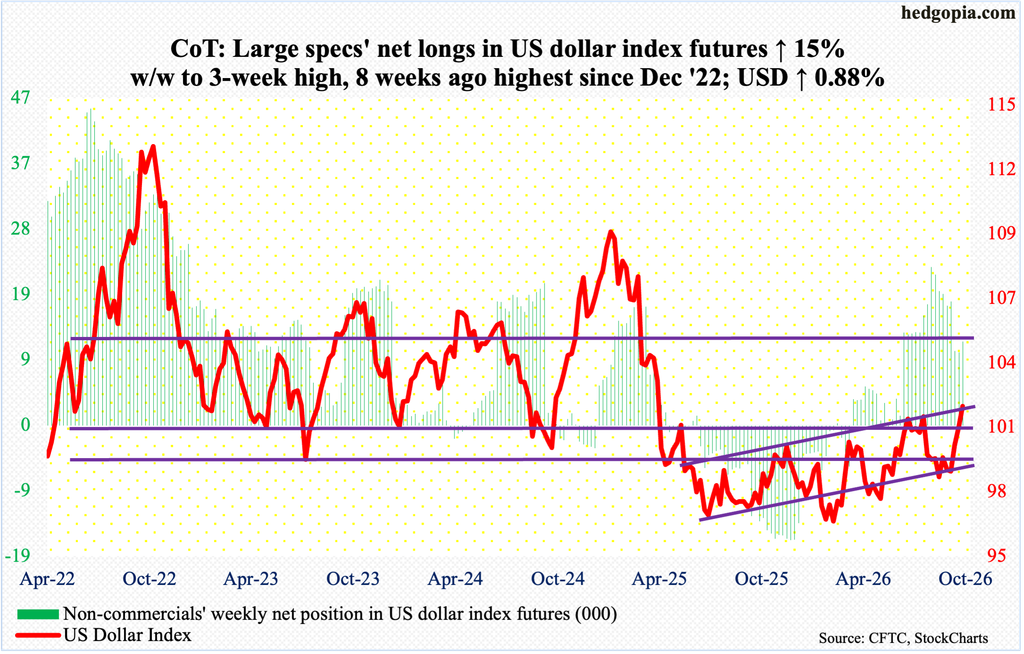
Rallying for three weeks in a row since bottoming at 98.60 on September 9, the US dollar index this week added 0.9 percent to 101.92. In June-July, bulls were denied at 101-102 for six weeks in a row. Subsequently, the index bottomed at 98.56 on August 20.
On particularly the daily, the US dollar index is very extended. In the event it comes under pressure, the 50-day at 99.94 approximates 100, where lateral support goes back to March 2015.
VIX: Currently net short 79.6k, up 330.
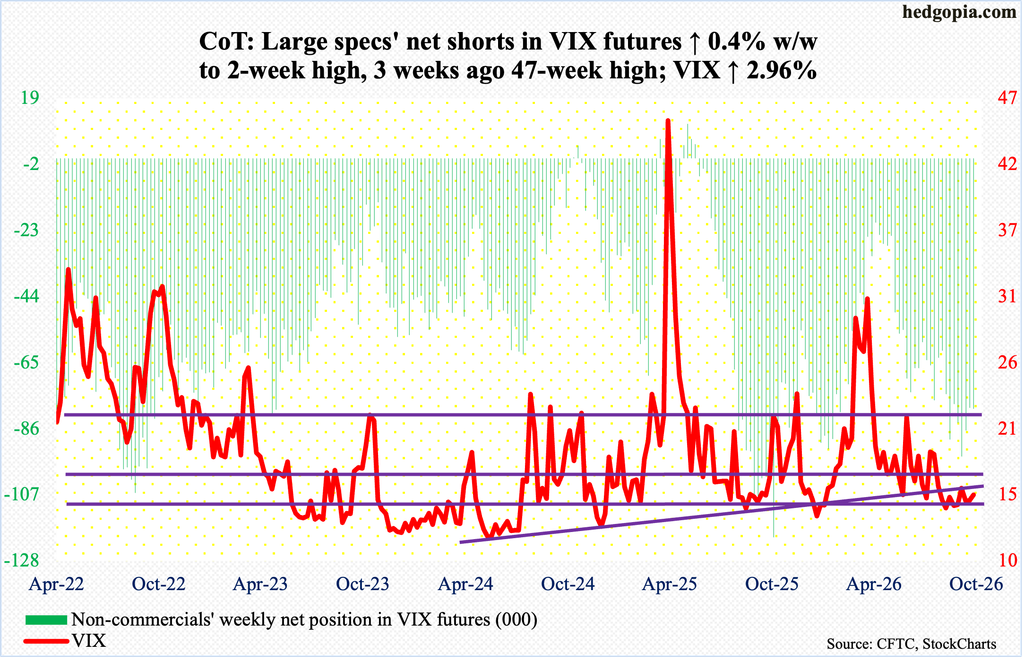
Volatility bulls had an opportunity to press their case this week but came up short. Unable to keep Thursday’s intraday high of 17.59 – just below the 200-day at 18.05 – they ended up also losing the 50-day (15.85) by the end of the week, although VIX added 0.44 points for the week to 15.31.
The daily RSI turned lower from the low-50s, ending the week at 47.66; there is support at 43. As things stand, VIX has room to head lower for now.
Thanks for reading!
