
Following futures positions of non-commercials are as of November 17, 2026.
10-year note: Currently net short 1,048.9k, up 65k.
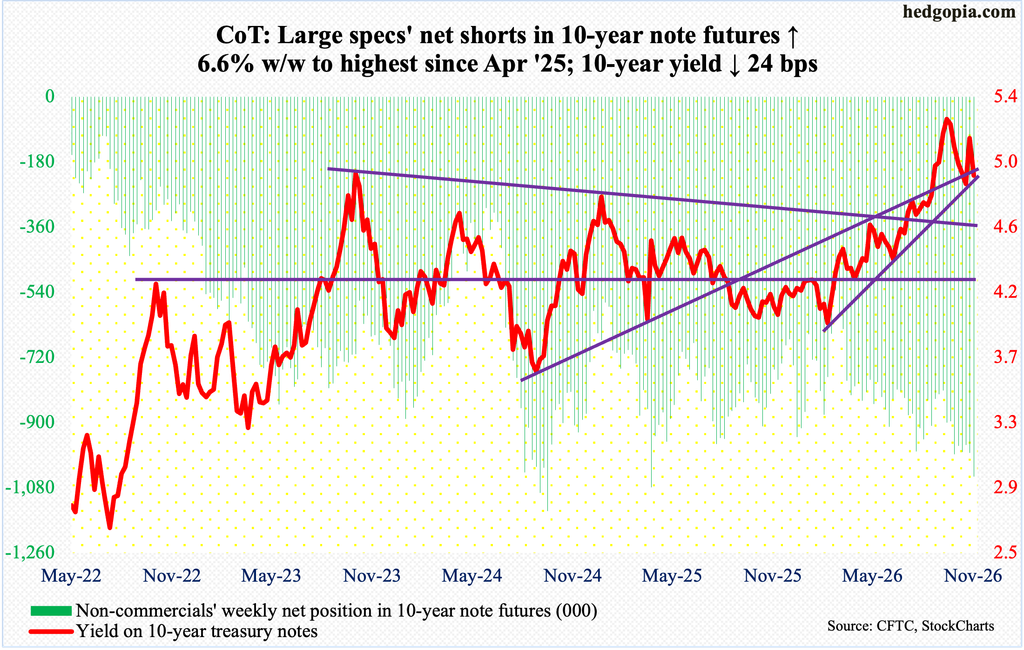
FOMC minutes for the October 27-28 meeting were released on Wednesday. The fed funds rate was held steady at a range of 3.75 percent to four percent during the meeting. In September, for the first time since July 2023, the benchmark rate was raised by a quarter point.
Going by the CME FedWatch gauge, futures traders are pricing in a 25-basis-point increase next month, followed by one more of similar increment by next March.
The October minutes showed that two members even suggested a 50-basis-point hike. Two others – Governor Lisa Cook and Cleveland Fed President Beth Hammack – dissented in favor of a 25-basis-point increase in a 10-2 vote. In a rather interesting twist, Governor Christopher Waller of late has been stating that the FOMC, the rate-setting body, should consider 50 basis points next month.
The hawks are clearly worried about how inflation is progressing. Consumer inflation has remained above the Federal Reserve’s stated goal of two percent for over five years now. Both headline and core CPI (consumer price index) in October rose 0.4 percent month over month, and the readings were 0.1 percentage point higher than the consensus.
Next month’s meeting, slated for 8-9, hence can be market moving. A 25-basis-point increase is just about guaranteed, but how many will dissent for a 50 will be telling as to how 2027 might evolve.
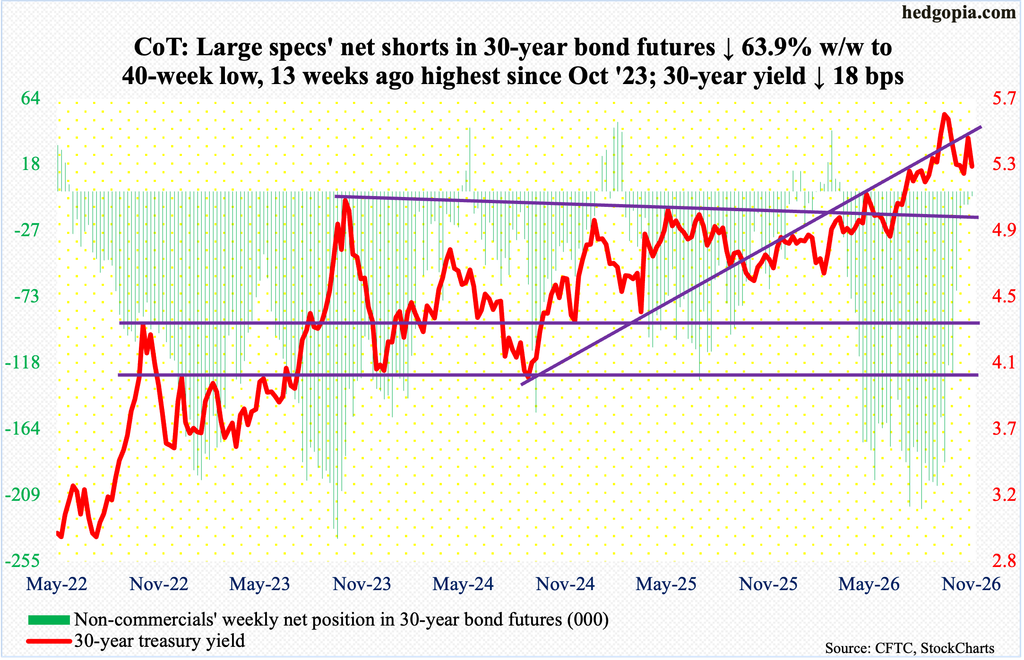
30-year bond: Currently net short 3.3k, down 5.9k.
Major U.S. economic releases for next week are as follows. Markets are closed Thursday for observance of Thanksgiving Day!
The S&P Cotality Case-Shiller home price index (September) comes out Tuesday. Nationally in August, home prices were up 2.1 percent year over year. This was the fastest appreciation in 15 months. In March, prices had stalled to annual growth of 0.8 percent – a 33-month low.
Wednesday brings GDP (3Q26, 2nd estimate), corporate profits (3Q26, preliminary), durable goods orders (October), personal income/spending (October) and new home sales (October).
The advance estimate showed real GDP grew at an annualized rate of 3.4 percent in the September quarter, which was a four-quarter high.
In the June quarter, corporate profits adjusted for inventory valuation and capital consumption shot up 20.8 percent from the corresponding period last year to a seasonally adjusted annual rate of $4.71 trillion – a record.
Orders for non-defense capital goods ex-aircraft – proxy for business capex plans – rose 0.7 percent m/m in September to $88.2 billion (SAAR), setting a fresh record; from a year ago, orders surged 13.7 percent, a tad under August’s five-year high 14.1 percent.
In the 12 months to September, headline and core PCE (personal consumption expenditures) increased 3.65 percent and 3.12 percent respectively – a four-month high in each. May’s 3.82 percent and 3.16 percent set 36- and 27-month highs, in that order.
Sales of new homes in September slid 0.6 percent m/m to 676,000 units (SAAR). January’s 576,000 was the lowest since September 2022.
WTI crude oil: Currently net long 43.6k, down 8.6k.
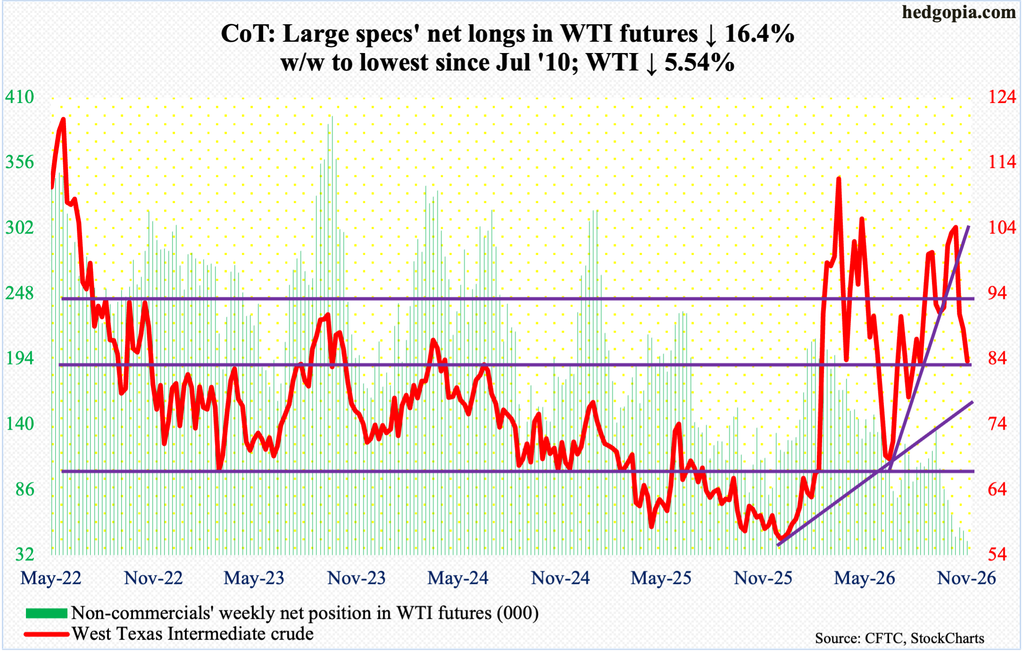
West Texas Intermediate crude dropped 5.5 percent this week to $83.66/barrel to register a third consecutive weekly decline. It has been under pressure since tagging $104.99 on October 30, which was part of a series of lower highs since the crude peaked on March 9 at $119.48; six sessions before that, it surged in the wake of the February 28 U.S. and Israeli military attack on Iran. On February 27, WTI closed at $67.02, with a session high $67.83 and a low $64.85.
The crude remains below both the 50- and 200-day moving averages ($93.80 and $88.12 respectively).
If there is any consolation for oil bulls, it is that Friday reversed higher with a bullish hammer, with the session low $80.78 successfully testing horizontal support at $80. Bulls have a shot at the 200-day, which also coincides with lateral resistance at $87. Else, a rising trendline from January when WTI was in the mid-$50s extends to $78.
In the meantime, as per the EIA, U.S. crude production in the week to November 13 increased 19,000 barrels per day week over week to 14.032 million b/d – a record. Crude imports dropped, down 1.1 mb/d to 5.6 mb/d. Stocks of crude, gasoline, and distillates were all up, rising 3.4 million barrels, 5.2 million barrels and 1.6 million barrels respectively to 417.8 million barrels, 215.9 million barrels and 104.9 million barrels; distillates two weeks ago were the lowest since May 2003. Refinery utilization increased five-tenths of a percentage point to 95.7 percent – a nine-week high.
E-mini S&P 500: Currently net short 94k, down 44.7k.
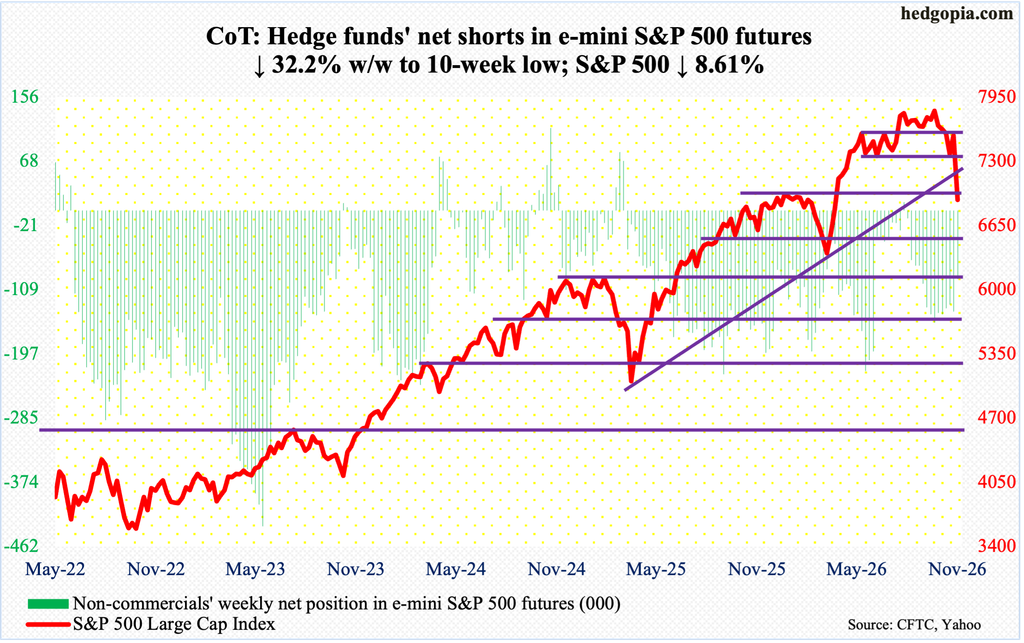
Until Tuesday, the S&P 500 was down 6.4 percent from the all-time high 7845 reached on October 6. By the look of it, non-commercials decided this was a decent decline, and they reduced net shorts to a 10-week low. From the Tuesday close, the large cap index dropped another 5.9 percent to finish the week at 6910. It is possible these traders continued to cut back on their holdings; we will find out next week.
Through Friday’s intraday low 6883, the S&P 500 gave back 12.3 percent from the early-October peak. For perspective, from the lows of March this year and April last year, the index racked up gains of 24.2 percent and 62.2 percent, in that order. So, in the big scheme of things, bulls, particularly those that got in early, are still sitting on tons of gains and are probably not sweating yet.
That said, for the first time in a while, there was a palpable sense of panic in the markets, particularly on Thursday and Friday. The daily particularly is grossly oversold, and this probably offers an opportunity for the bulls to try to put their foot down. At 7000, or just south of it, lies breakout retest, and this has been breached, albeit not decisively. Bulls can still regroup. Failure to do so will make the index susceptible to gravitate toward 6100-6300. In this scenario, the weekly, too, would find itself in gross oversold territory, not to mention the percent of S&P 500 stocks above their 50- and 200-day, which closed the week at 48.8 percent and 43.2 percent respectively – hardly a washout.
Euro: Currently net short 142.7k, up 6.3k.
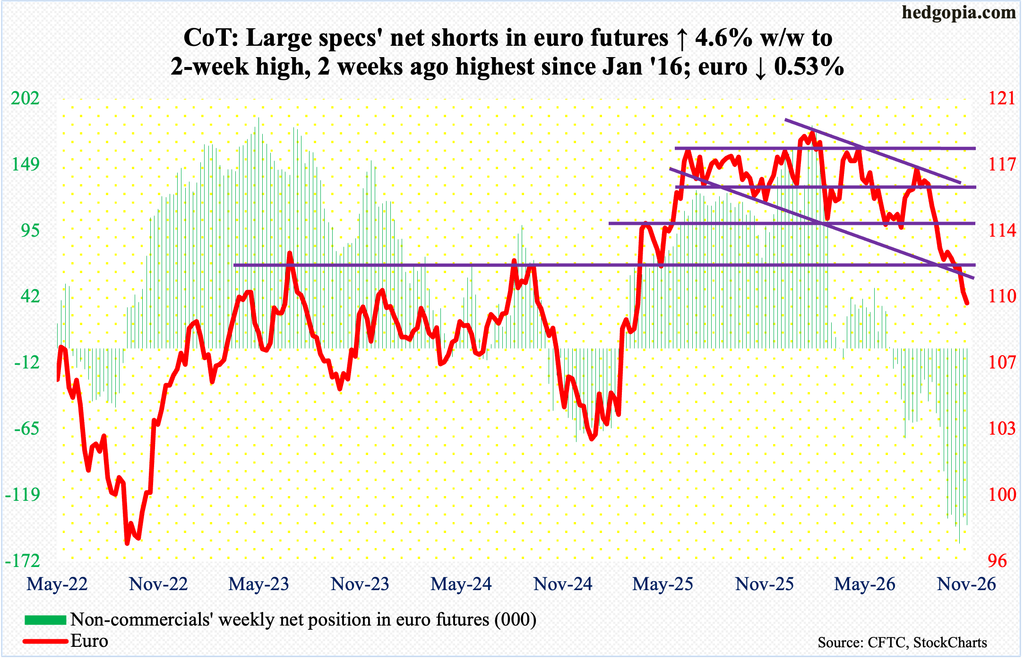
The downward momentum the euro has found itself in since August 20-21 this year when it tagged $1.1712 saw no respite this week, as the currency fell 0.5 percent to $1.0968. This was a fifth weekly decline in a row – and 10th in 11.
The August high represents a second lower high since the euro peaked on January 27 this year at a four-and-a-half-year high $1.208.
Amidst this, for the first time since January this year, the daily RSI has gone sub-30, with the week ending at 27.35; back then, the currency then went on to rally for six months. For a similar scenario to pan out this time around, euro bulls first have to retake support-turned-resistance at $1.11.
Gold: Currently net long 166.1k, down 24k.
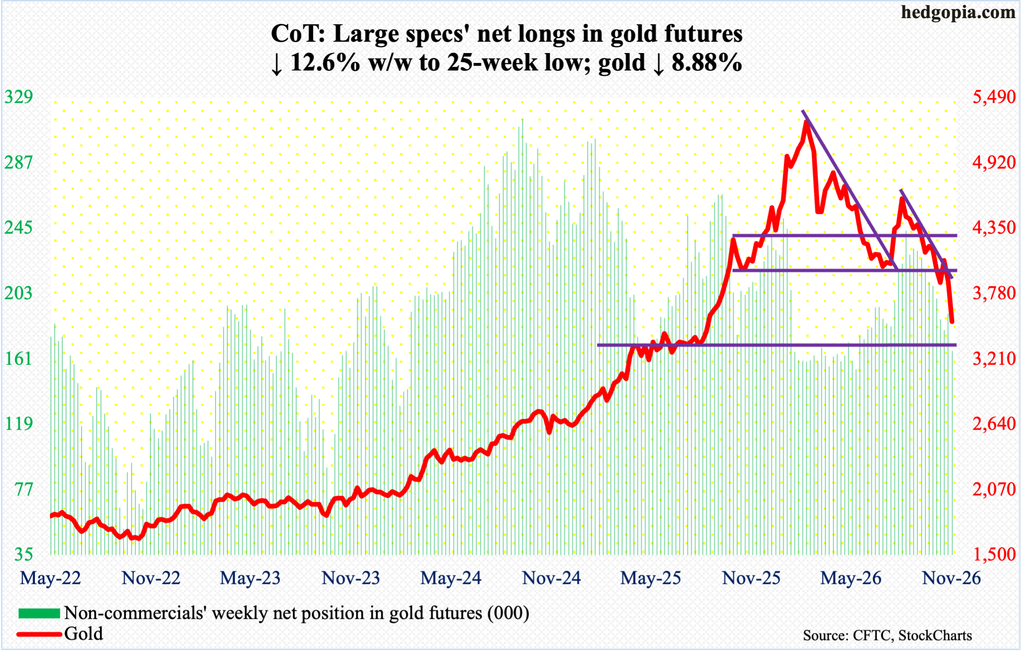
Four weeks ago, gold bugs failed to stop a breach of crucial horizontal support at $3,900-$4,000, where it went sideways for six consecutive weeks in June-July this year before turning up. The $3,900-$4,000 breach was then followed by three weeks of sideways movement just south of $3,900, raising hopes of possible consolidation before reversing higher. This week, however, gold sliced through the level to finish down 8.9 percent to $3,537/ounce.
The metal has been under pressure since peaking at $5,608 on January 29 this year. Earlier, it rallied from $3,312 in August last year, and $1,810 in October 2023. Gold has just about done a round trip, with Friday ticking $3,502. There is crucial lateral support at $3,400s.
In the event of strength, nearest hurdle lies at $3,900.
Nasdaq (mini): Currently net long 4.3k, down 24.8k.
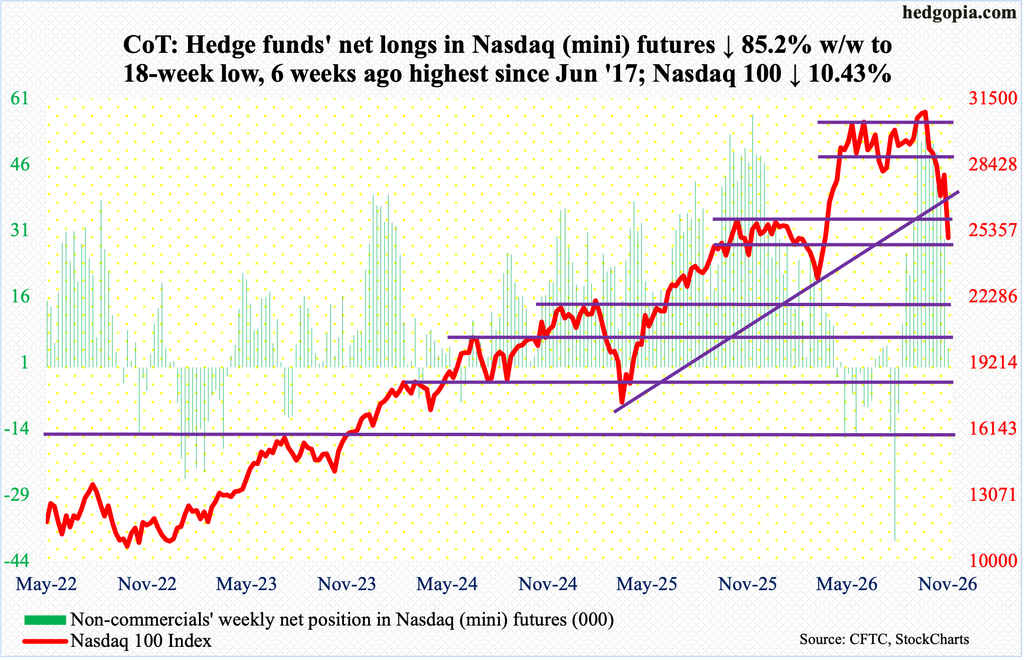
The much-anticipated IPO of Anthropic (ANT) has arguably been used as a trigger to lock in gains in tech. From the March 30 low of 22841 through the October 6 peak of 31361, the Nasdaq 100 jumped 37.3 percent; going back further, it surged 89.6 percent from the April 2025 low of 16542.
This week alone, the tech-heavy index tumbled 10.4 percent to 25029; from the October peak to Friday’s session low 24910 – just above horizontal support at 24600s – it gave back 20.6 percent.
Since the October peak, there has only been one up week in six. The daily RSI closed the week at 26.55, indicating the oversold condition the Nasdaq 100 finds itself in. In the event of a reflex rally, bears are likely to show up at 26100s.
Russell 2000 mini-index: Currently net short 15.7k, up 9.9k.
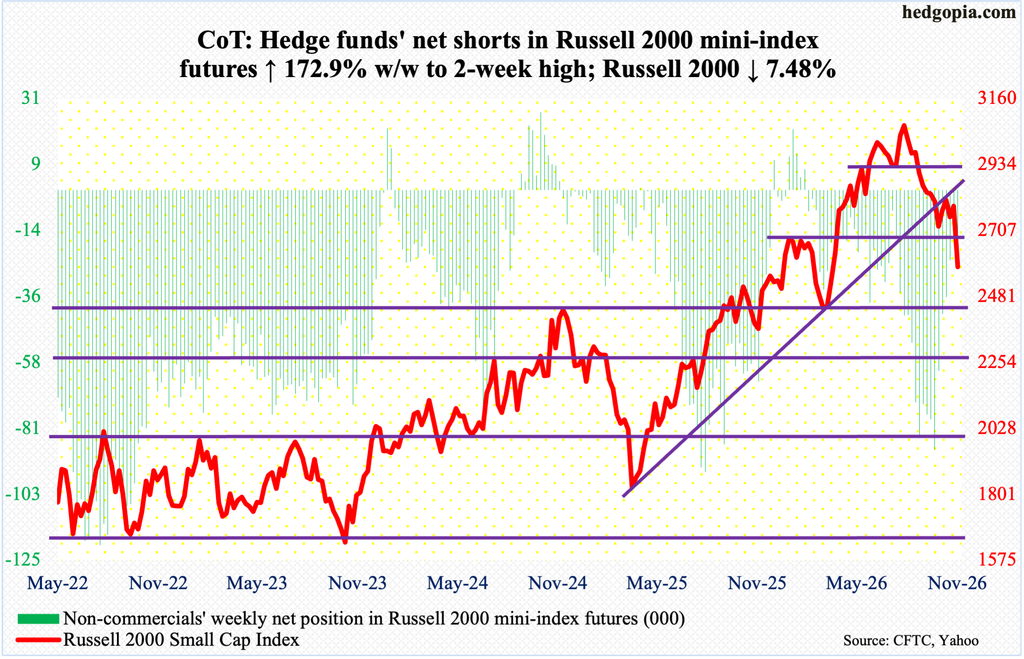
Small-cap bulls could no longer mop up the amount of sell orders that came their way this week. They had already been on the defensive since the Russell 2000 peaked at 3070 on August 14, with one after another support getting compromised.
Prior to this week’s 7.5 percent plunge to 2582, the index went sideways just north of 2700 for five weeks, although attempts to retake 2880s were rejected.
Not surprisingly, most indicators are oversold. Even if the bulls manage to put up a fight here, the compromised 2700 likely acts as a formidable hurdle.
US Dollar Index: Currently net long 13.3k, down 468.
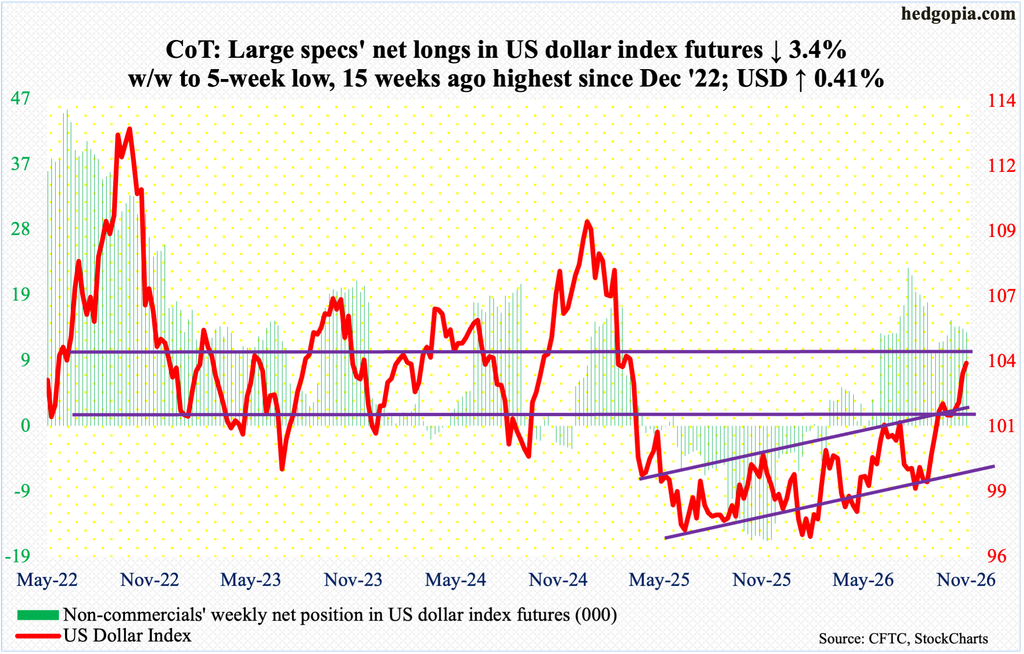
Tuesday’s spinning top was followed by what looks like a hanging man on Thursday and Friday. These candles are showing up after the US dollar index has rallied in eight of 10 weeks. This week, it rose 0.4 percent to 103.84, where – or between 104 and 105 – dollar bulls will face heavy resistance.
Earlier, the index tagged 110.18 in January last year and headed lower, ultimately bottoming at 95.55 a year later this January. After that trough, the US dollar index has persistently made higher lows, before breaking out of 100-101 early October. If the bears win out in the sessions ahead, they have a shot at 102.50s.
VIX: Currently net short 42.9k, down 3.2k.
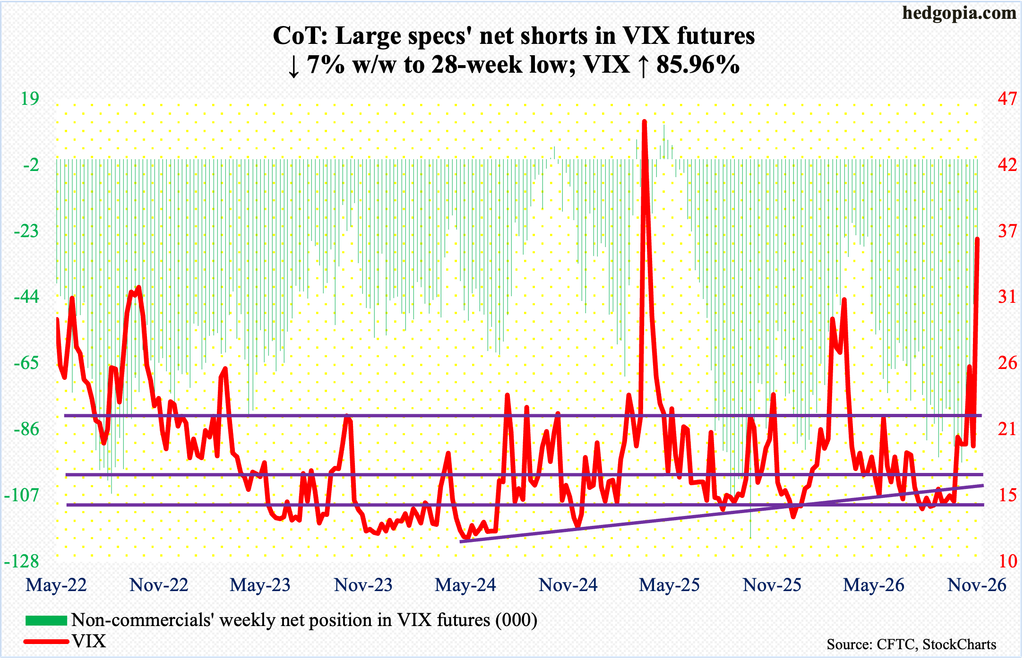
VIX shot up 16.59 points this week to 35.89, with Friday rising as high as 40.03. It is hard to categorize Friday’s action as a spike reversal, although the daily RSI has crossed 70 to finish the week at 71.66.
Friday’s high is the highest since April last year when VIX ticked 60.13 and reversed hard lower; this was when the major equity indices hit major lows. Thus far, VIX has not given any signs of a reversal, but it is also worth watching carefully.
In the meantime, non-commercials have reduced net shorts to a 28-week low. If past is prelude, VIX tends to peak once these traders go net long or get close to doing that.
Thanks for reading!
