
After last week’s bloodbath in stocks, Friday brought a small consolation for small-cap investors. Maybe.
During the week, IWM, the iShares Russell 2000 ETF, lost major support – which is three percent away. The 118-119 support goes back to March last year. This was successfully tested eight sessions ago, but last week was not so lucky. In some ways, this development has been weeks/months in the making.
Toward the end of April, the ETF lost the mid-October 2014 trend line. Two months later, there was a false breakout. During all this, a head-and-shoulders formation developed. The neckline corresponds with the afore-mentioned support. That is now gone. Assuming it is a genuine breakdown, a measured-move target can push IWM toward 110. This is the bad part.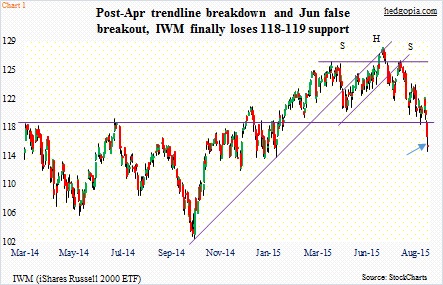
Friday was bad, all the same laced with some optimism.
For the week, both the S&P 500 Index and the Dow Industrials lost 5.8 percent, and the Nasdaq 6.8 percent. On a relative basis, the Russell 2000 performed better, having lost 4.6 percent. The difference was Friday, with respective drops of 3.2 percent, 3.1 percent, 3.5 percent and 1.3 percent.
As a result, where as other indices produced solid red candles in that session, the Russell 2000/IWM almost came away with a doji (arrow in Chart 1), indicating that it was beginning to generate some dip-buying. This was interesting also because RVX, the Russell 2000 Volatility Index, closed near session highs (Chart 2).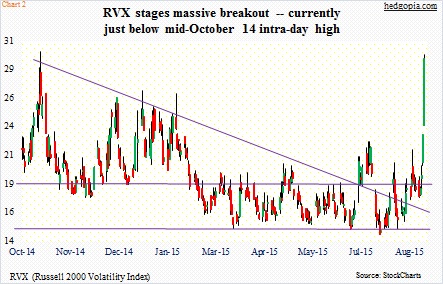
So we will see how it goes this week. The ETF ($115.03) is down 10.5 percent from the June 24th peak – now in correction territory. Monthly momentum indicators continue to head lower.
Kudos to non-commercials who saw this coming, having raised net shorts in Russell 2000 mini-index futures from just under 4,500 contrasts four weeks ago to a tad over 46,000 by last Tuesday (Chart 3). Although it must be pointed out that these holdings may look substantially different because of what transpired in the remaining three sessions last week.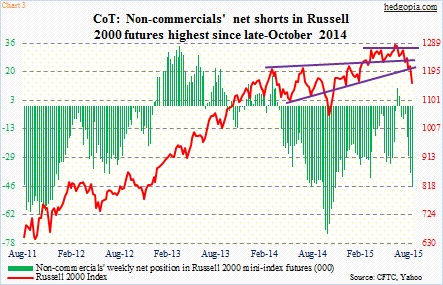
As things stand now, if there is a counter-trend bounce/rally, shorts will probably show up near 118-119. At the same time, daily conditions are way oversold. A test of that resistance is possible in the near-term, assuming, of course, the stock market does not fall out of bed. If this scenario pans out, covered calls may be the way to go as far as recent longs are concerned. (Although shortly after midnight, U.S. futures are down big.)
To recall, on August 14, weekly August 21st 119 puts were sold for $0.92 – now long at $118.08. Weekly August 28th 117 calls bring $1.04. If called away, it incurs a loss of $0.04 overall. Else, the effective cost drops to $117.04.
Thanks for reading.
