
The last time average hourly earnings of U.S. private-sector employees grew with a three handle was April 2009 … means in the current recovery wages are yet to print growth of three percent. December came close, with a year-over-year increase of 2.93% to $26 (Chart 1).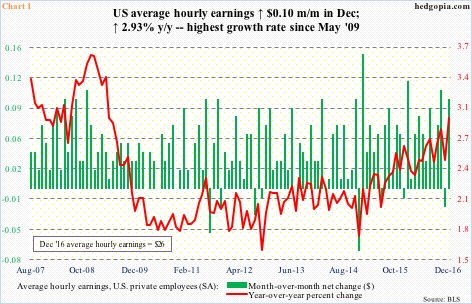
The red line in Chart 1 bottomed at 1.55 percent in October 2012 and has trended higher in particularly the past couple of years. In the meantime, the unemployment rate has dipped below five percent the past eight months. December inched up one-tenth of a point to 4.7 percent from 4.6 percent in November, which matched the low of August 2007.
This has boosted optimism among economists, investors, and what have you, that wages would continue to rise. Is it that simple?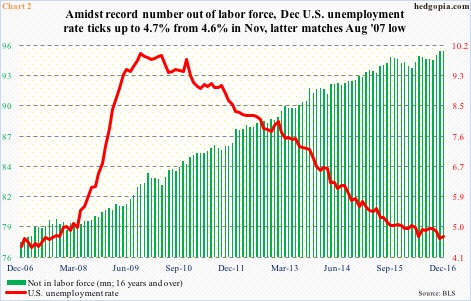
U.S. economic recovery is in its eighth year. Growth is subdued versus history, but chugging along. Assuming this continues, the wildcard as relates to wages might be the ones that are not in the labor force. Their ranks continue to grow!
As of last December, 95.1 million Americans (16 years and over) were not in the labor force. When the last recession ended, they totaled 80.9 million. The 14 million that left the labor force is a primary reason why the unemployment rate is where it is.
Now if those representing the green bars in Chart 2 decide to enter the workforce, then the much hoped-for increase in wages likely remains just that – hoped-for. From the perspective of recent trend in wages, the labor force status quo probably needs to continue and the economy needs to continue to grow.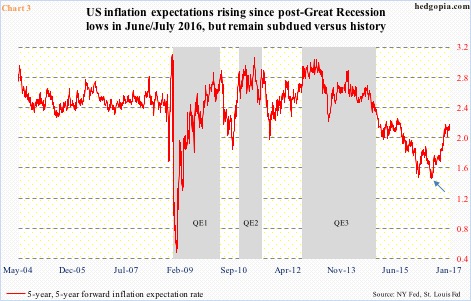
Markets are beginning to bet this continues, pricing in some inflation.
The five-year, five-year forward inflation expectation rate – expected inflation over the five-year period beginning five years from today – bottomed at 1.41 percent in June/July last year (arrow in Chart 3), rising to as high as 2.13 percent on December 1. (It came in at 2.05 percent on Monday.)
Versus history, inflation expectations are still subdued, but the spike since the June/July low has a little parabolic look to it. It is not worryingly noticeable now, but will be if the current trajectory continues. For reference, during three iterations of the Fed’s quantitative easing, the red line in Chart 3 would spike during QE and die down as soon as QE ended.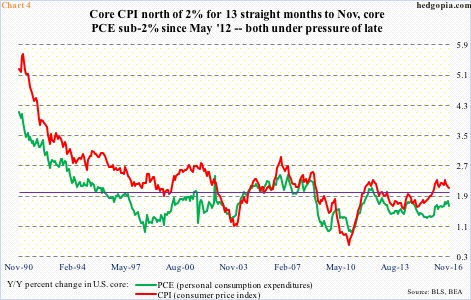
The recent spike in inflation expectations also comes amidst rather subdued/mild readings in consumer inflation.
If we focus on the consumer price index, core CPI has stayed above two percent for 13 months now, but one look at Chart 4 and it is easy to see how suppressed this measure of inflation is. Even more so if we look at the personal consumption expenditures index. Except for four months in early 2012, core PCE – the Fed’s favorite measure of inflation – has stayed sub-two percent since October 2008 (Chart 4). This is not some recent trend, rather has persisted for a while.
Amidst this, we have rising inflation expectations (Chart 3) and rising optimism as relates to wage growth.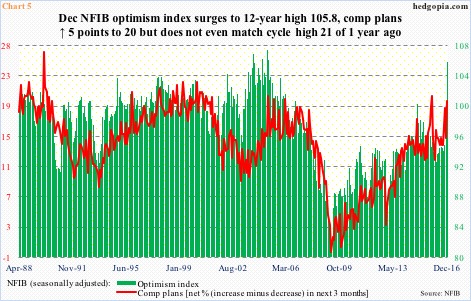
Come Tuesday, we got one more data point on this front. The NFIB small-business optimism index shot up 7.4 points month-over-month in December to a 12-year high 105.8. Post-U.S. presidential election, several other surveys have witnessed an increase in optimism, such as the University of Michigan’s consumer sentiment index, which shot up 4.4 points m/m in December to 98.2 – the highest since January 2004 (not shown here).
Here is the rub.
NFIB members’ compensation plans, however, failed to reflect their overall optimism in December. It was up five points m/m to 20 alright, but that would not even match the cycle high 21 of a year ago (Chart 5). Says a lot. These businesses are optimistic about their future, but they are not willing to translate that into higher wages for employees.
Does not quite sound like the makings of an environment in which wages are set to accelerate.
Thanks for reading!
