
Major US equity indices continue to try to repair the technical damage they sustained in February and March. After a decent rally in the past couple of weeks, risks are rising near term.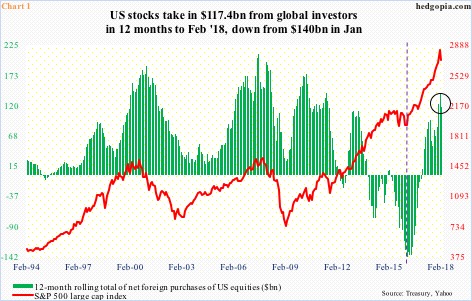
Foreigners sold $1.2 billion in US stocks in February. This was the first month in six they cut back. As a result, on a 12-month rolling total basis, foreign purchases in February were $117.4 billion, down from $140 billion worth in January.
Directionally, the green bars and the red line in Chart 1 tend to move together. The latter peaked in January, and has struggled since.
In fact, the S&P 500 large cap index (2677.84) dropped all the way to 2532.69 on February 9 before reversing higher. Monday, it rallied 0.8 percent, but sellers showed up on the 50-day. Even if this average gets taken out, major resistance awaits – around 2730, which represents a falling trend line from January 26 when the index rose to an all-time high of 2872.87.
Foreigners can play a role as to what happens next. Back in February 2016, they were selling $145.3 billion in US stocks before the green bars bottomed (dashed vertical line). Incidentally, the S&P 500 reached a major bottom in that very month. Thus the question, will the January high equate to a similar milestone? Time will tell.
This much we know. Major US equity indices act weak technically.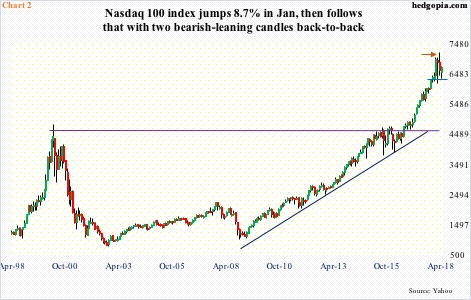
Of the major ones, fatigue is probably most visible in the Nasdaq 100 index (6675.18).
Stocks began 2018 with a bang, with the Nasdaq 100 rallying 8.7 percent in January. Then came the sharp selloff early February. Peak to trough, the Nasdaq 100 collapsed 12.2 percent in 11 sessions. The bulls used this as an opportunity to load up, resulting in a hanging man candle in February. This was followed by a new high in March, but the breakout was false, with the month ending with a reversal candle (arrow in Chart 2).
Several monthly momentum indicators have turned lower. In the right circumstances for the bears, they can go a lot lower. Thus the significance of 6300, which is about where the 200-day lies.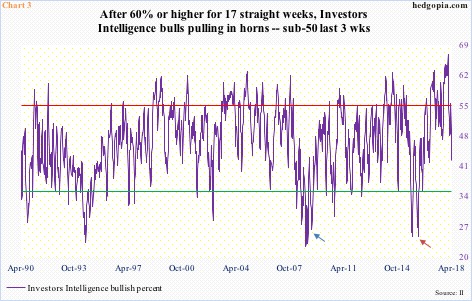
If this support goes, the bears would have won an important battle.
Last week, Investors Intelligence bulls dropped 5.4 percentage points week-over-week to 42.2 percent. Bears rose five-tenths of a point to 18.6 percent. This was preceded by elevated readings that lasted weeks.
In the 17 consecutive weeks ended January-end, bulls were 60 percent or higher, with a peak of 66.7 percent mid-January. In the last three – or in six of the last eight – they remained sub-50. But the sentiment is nowhere near washout.
In the past, major lows in stocks accompanied a dip in bulls’ percent into the ’20s. March 09 was 26.4 percent (blue arrow in Chart 3), February 2016 24.7 percent (brown arrow).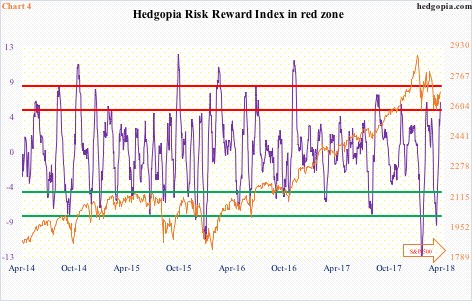
Regardless how sentiment shakes out medium- to long-term, or what path it takes, and how this would impact stocks, risks are rising near term. Major indices enjoyed a decent rally in the past couple of weeks. This has pushed the daily momentum indicators into overbought territory.
The S&P 500, Nasdaq 100 and the Dow Industrials in the past couple of sessions have either tested the 50-day or are sitting right underneath. What the bulls do not want to see is a breakout followed by a quick reversal. As things stand, this scenario cannot be ruled out.
The Hedgopia Risk Reward Index, which is designed to capture short-term swings, just entered the red zone (Chart 4).
Thanks for reading!
