
If investor/trader reaction last Friday to financials’ 1Q18 results is any indication, we are in for some interesting weeks ahead.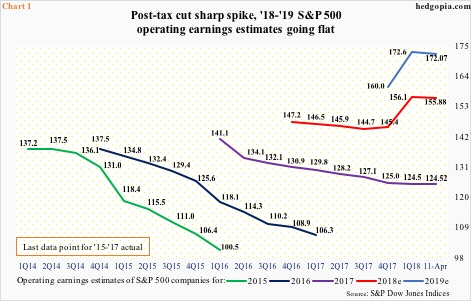
First-quarter earnings season began in earnest last week. For 1Q18, the sell-side expects $35.63 in operating earnings from S&P 500 companies. Estimates have slightly trended lower since hitting $35.81 on March 8, but have risen post-tax cuts. The Tax Cuts and Jobs Act of 2017 was signed into law on December 22. Estimates were $33.87 on December 21.
The upward revision trend over the past four months is evident in Chart 1. On December 21, consensus estimates for 2018 were $145.31, before gradually rising to $156.45 by mid-March. As of April 11, estimates slightly edged down to $155.88. Over the past few weeks, the trend is flattish to slightly down. Ditto with 2019, which peaked at $173.11 at the end of February, and stood at $172.07 on April 11.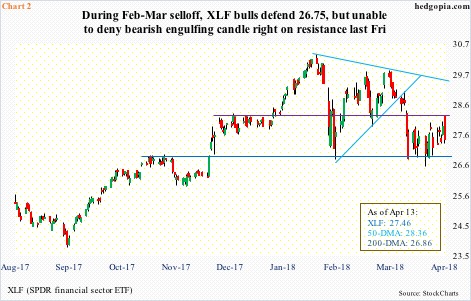
Last Friday, some of the leading US financials reported their numbers. JPM (JP Morgan), C (Citigroup), PNC (PNC) and Wells Fargo (WFC) all beat estimates, but ended down 2.7 percent, 1.6 percent, 4.6 percent and 3.4 percent, in that order. XLF (SPDR financial sector ETF) lost 1.5 percent, with the session producing a bearish engulfing candle (Chart 2).
The ETF reached a 10-year high of $30.33 on January 29 before reversing lower. The subsequent drop bottomed at $26.76 on February 9. It then proceeded to trade within a symmetrical triangle, which it fell out of on March 19. The underside of that broken triangle already repelled rally attempts.
Last Friday’s reaction further worsens the technical picture. Ideally, the bulls would have liked to go test the upper bound of the triangle, but they fell way short. Friday’s high also fell $0.12 short of the 50-day moving average.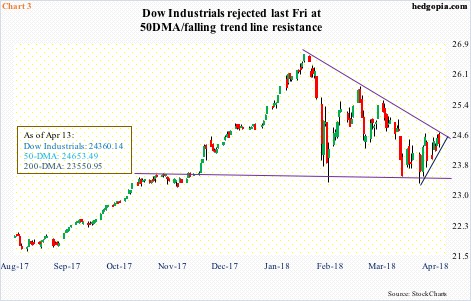
This also applies to major US equity indices.
In fact, guess where sellers showed up on the Dow Industrials last Friday? At the 50-day, which also approximates the upper bound of a descending triangle (Chart 3). The Industrials suffered an 11-session peak-to-trough, 11.2-percent decline during late January-early February. It has since consistently made lower highs. The bulls cannot afford to lose support at 23550, which is where the 200-day rests.
From their perspective, the good thing is that throughout this correction the 200-day was never lost on a closing basis. However, the index has not been able to lift off of it either. The longer it lingers, the higher the odds that the average gives way.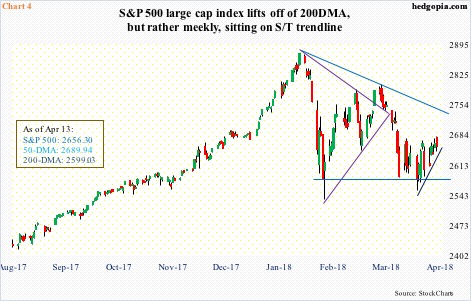
This also holds true with the S&P 500 large cap index.
After pretty much hugging the 200-day for a couple of weeks, the index rallied two percent last week. Friday’s high came within nine points of the 50-day before reversing lower.
Technically, it, too, is broken. In other words, there is a lot of work ahead to repair the damage it suffered in February and March (Chart 4). Since peaking at 2872.87 on January 26, the S&P 500 has made lower highs, fell out of a symmetrical triangle and unsuccessfully tested last Friday the underside of the broken trend line from February 2016.
Major support lies just south of 2600. The 200-day lies around there.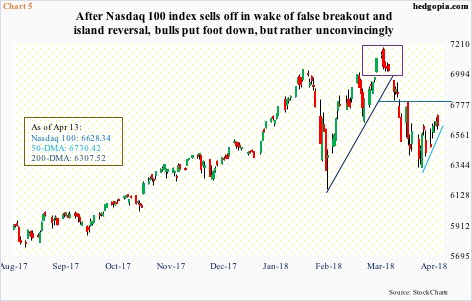
The Nasdaq 100 is no exception to this.
Early this month, it fell to within 50 points of the 200-day. The last time it lost that average was in July 2016.
That said, after the February decline, it was the only major equity index to have rallied to a new high, which it achieved on March 13 with 7186.09. That, it turns out, was a false breakout, in the process developing an island reversal (Chart 5). Last Friday’s high came within 27 points of testing the 50-day – way ahead of short-term resistance at 6800.
All these three indices – the Dow, S&P 500 and Nasdaq 100 – are literally sitting on short-term rising trend line. A break raises the odds of a test of the recent lows.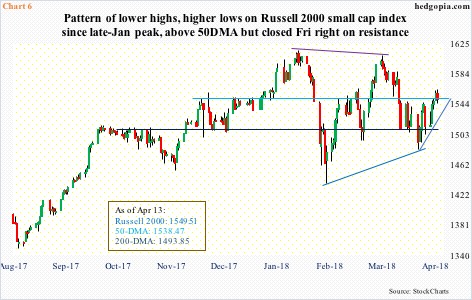
There is a similar trend line on the Russell 2000 small cap index, but it is yet to approach it (Chart 6). The index is also the first to have retaken the 50-day, which it achieved last Tuesday.
Arguably, of major indices, the Russell 2000 acts the best. In the best of circumstances, it has a shot at just north of 1600, which is where a slightly falling trend line from the all-time high of 1615.52 on January 24 lies (Chart 6). For this scenario to pan out, the bulls need to defend support at 1550 – which is where it is at currently – and/or the 50-day, which is 11 points lower.
Longer-term, on the monthly chart, January’s reversal candle on the Russell 2000 was followed by a hanging man in February and a candle with a very long wick in March. Several monthly momentum indicators have turned lower. This is also true with the other indices mentioned here. In the right circumstances for the bears, there is room for these indicators to continue lower.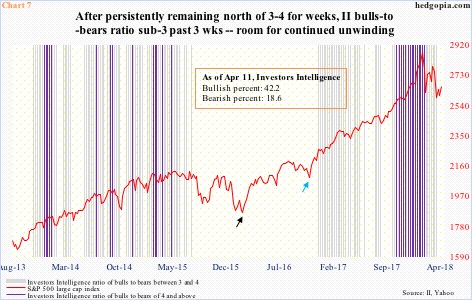
Investor sentiment has taken a hit in the wake of the recent selloff, but it is nowhere near final washout.
Last week, Investors Intelligence bulls fell 5.4 percentage points week-over-week to 42.2 percent, even as bears inched up 0.5 percentage points to 18.6 percent. Post-presidential election in November 2016 (blue arrow in Chart 7), bears peaked at 25.7 percent, but bulls were still 42.9 percent. In February 2016 (black arrow), bulls dropped to 24.7 percent, while bears jumped to 39.8 percent.
In the past three weeks, the ratio of bulls to bears dipped below three. This follows persistently elevated readings north of three or four. In late 2015-early 2016, the ratio remained in one’s and zero’s for weeks. In the week ended February 10, it bottomed at 0.6, stocks bottomed on the 11th.
In a scenario in which the monthly charts continue to unwind, support levels on these indices are likely to break sooner or later. This is medium- to long-term risk. Even near term, shorting opportunities may be around the corner. The daily charts are beginning to get overbought. Wait and watch for now.
Thanks for reading!
