
“When the facts change, I change my mind. What do you do, sir?”
The above remark is often attributed to John Maynard Keynes, the British economist, although some dispute it. Regardless who said it, it is a nice quote.
More to the point, should equity bears be heeding that advice right now?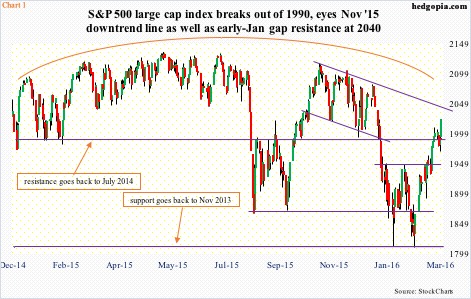
Indices are breaking out. The S&P 500 index (2022.19) is well past 1990, even as the Dow Industrials has taken care of 17000-plus. The Nasdaq 100 and the Russell 2000 have pushed through 4350 and 1080, respectively, although barely. The Dow Transports is literally sitting at 7700.
The indices have not all convincingly broken out of their respective ceilings, the one that probably matters the most – the S&P 500 – has (Chart 1).
Or should the bears wait to see if the S&P 500 is able to also break out of 2040, where three different resistance levels converge – November 2014 horizontal line, November 2015 downtrend line, and January 2016 gap resistance.
If a breakout occurs, and a short squeeze follows – not a base case on this blog – things can get interesting.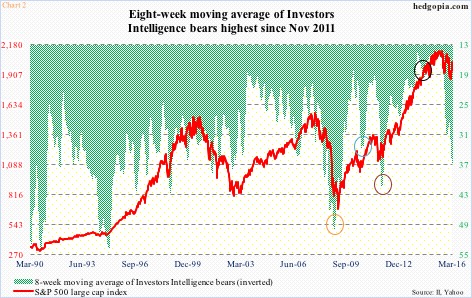
Chart 2 plots the S&P 500 against the eight-week moving average of Investors Intelligence bears. For seven weeks ended February 23rd, bears exceeded bulls – the longest run since 2009. In the latest week, the eight-week average reached the highest since November 2011. There potentially is a lot of unwinding left.
That said, there is no consistency in the green shade. If in November 2008 (orange circle in Chart 2), it peaked at 49.8, in August 2010 it did so at 33.8 (blue), at 41.2 in October 2011 (burgundy), and was nowhere near as high during the September/October 2014 rout in stocks (black). So the March 1st high of 36.8 may or may not contain a message.
Here is a hypothetical.
Since the February 11th low in stocks, technicals have been calling the shots. Earnings, fundamentals, valuations, and what not, have been pushed aside. In fact, they have not mattered for a while, anyway.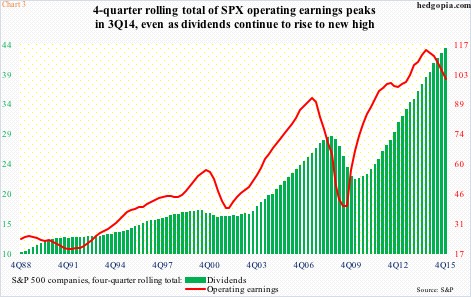
Fourth-quarter (2015) operating earnings of S&P 500 companies came in at $23.05, down nearly 14 percent year-over-year. This was the fifth consecutive y/y decrease in quarterly earnings. The four-quarter rolling total of earnings peaked at 3Q14, and has since persistently declined (Chart 3).
The thing to notice in Chart 3 is how the red line tends to lead the green bars. S&P 500 dividends were $11.35 in 4Q15 – a new high, with the four-quarter rolling total of $43.39, for a yield of 2.12 percent. If past is any guide, the green bars are set to shrink, leading to an even less compelling valuation argument.
Speaking of which, Chart 4 is one way to highlight this.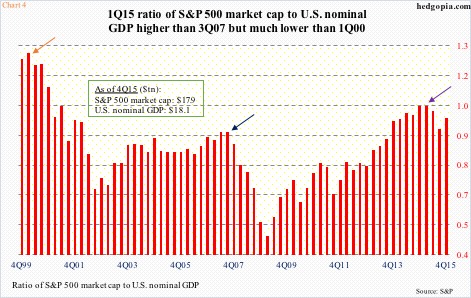
In both 4Q14 and 1Q15, the combined market cap of S&P 500 companies was greater than the U.S. nominal GDP. Back in 3Q07, the ratio peaked at 92.5 percent, but also surged all the way to 127 percent in 1Q00.
The deterioration in earnings/valuations makes it easier to argue/cling on to a bearish case.
Nowhere is this more evident than in the short interest data.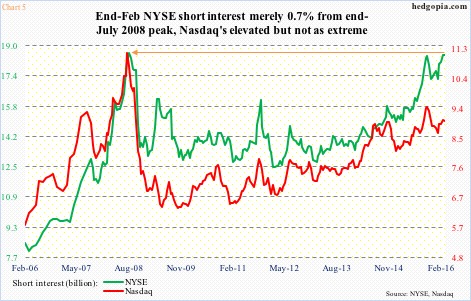
NYSE short interest was 18.5 billion shares at the end of February – merely 0.7 percent from the all-time high of 18.6 billion at the end of July 2008. On the Nasdaq, the end-February reading of 9.1 billion was much lower than the mid-July 2008 peak of 11.2 billion but remains elevated and on an uptrend (Chart 5).
This can be both an indication of shorts’ conviction in their thesis or an opportunity for bulls to force a squeeze.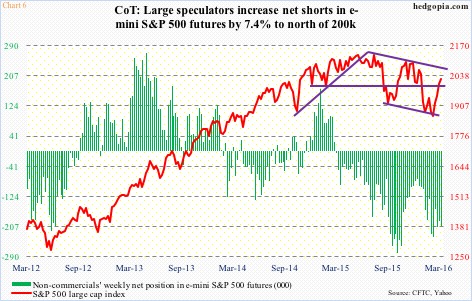
Take a look at Chart 6. As of last Tuesday, non-commercials raised net shorts in e-mini S&P 500 futures by north of seven percent week-over-week to 205,655 contracts. This almost gives an impression as if these traders are fighting the one-month uptrend in the S&P 500.
For reference, in early October last year, net shorts were north of 278k, then dropping to north of 75k by the middle of December, squeezing the shorts in the process. Can a similar fate await them this time around – especially if the S&P 500 breaks out of 2040? The answer is yes, if Chart 7 cooperates.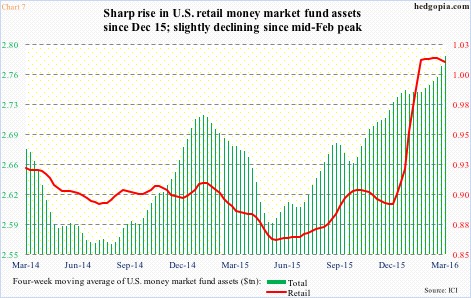
As of last Wednesday, there was $2.8 trillion sitting in U.S. money market funds, $1 trillion of which was in retail. Late April last year, this was $2.6 trillion and $861 billion, before gradually rising. Using a four-week moving average, the green bars are still rising even as the red line peaked three weeks ago and has since declined, although ever so slightly. An ideal scenario for the bulls, should the trend continue.
Flows into U.S.-based equity funds did indeed turn positive in the week ended last Wednesday. The $4.6 billion in inflows came on the heels of nine consecutive weekly outflows totaling $46 billion. Since February 10th, nearly $8 billion has been withdrawn.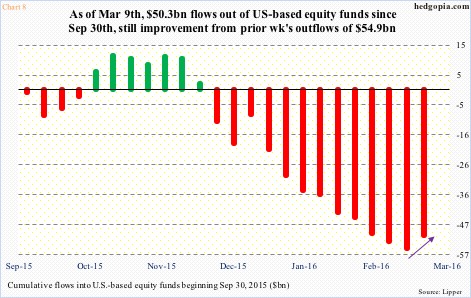
Chart 8 portrays cumulative total going back to September 30th – a good reference point because stocks bottomed then before rallying hard. It is a sea of red, but the latest week is a slight improvement over the prior week (arrow).
Equity bulls are obviously hoping that the Friday breakout would tempt funds into moving from Chart 7 to Chart 8. That will be a nirvana – once again, not a base case on this blog – squeezing the shorts (Charts 5 and 6).
Here is the rub.
If Friday – a breakout session – is any indication, investors/traders were in no mood to add to/take on risk.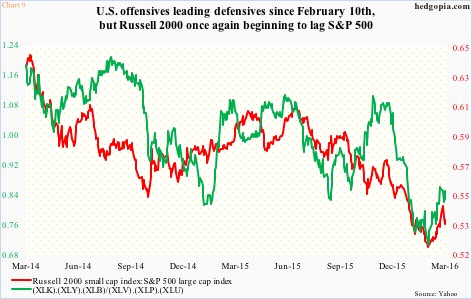
After a couple of weeks’ outperformance, small-caps are once again lagging their large-cap brethren. The ratio of XLK, the SPDR technology ETF, XLY (consumer discretionary) and XLB (materials) to XLV (healthcare), XLP (consumer staples) and XLU (utilities) rose on Friday but still below the March 1st high (Chart 9).
At least on this score, facts have not changed enough for equity bears to change their mind. Not just yet.
Thanks for reading!
