
- Jan pickup in U.S. average hourly wages after Dec drop welcome relief
- Nevertheless, NFIB members’ comp plans tumble big time in January
- Loss of high-paying oil jobs will put downward pressure on wages
One of the reasons January’s employment report last Friday generated so much excitement was wage growth. Relatively, that is. Earlier in December, average hourly earnings of U.S. private employees had declined five cents, to $24.63. That was the first month-over-month decline since October 2012. Six years into economic expansion, wages had already not been making much progress. So everyone was waiting the January report with bated breath. It was worth it. Wages went up 12 cents m/m (Chart 1)! Year-over-year growth jumped to 2.1 percent, from 1.9 percent in December.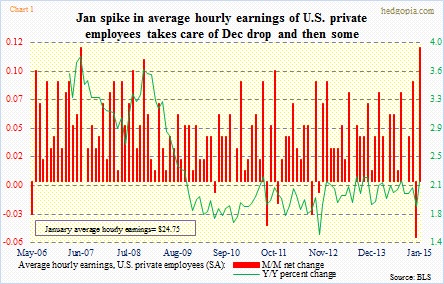
The annual growth rate was still below the two-percent-plus ceiling that has been in place throughout this recovery. Despite the progress made in job creation (January was the 11th consecutive month of 200k-plus in nonfarm payroll), corporations have been slow in hiking wages. The number of people in the ‘not in labor force’ category has simply gotten too large – 92.5mn vs. 80.9mn in June 2009 – even as the civilian labor force participation rate has dropped from 65.7 percent to 62.9 percent between the periods. Labor is the price taker, not the setter.
So when wages rose as much as they did in January, hopes were once again rekindled. Maybe 2015 was the year we would finally experience the long-awaited escape velocity! After all, the share of National Federation of Independent Business members expecting wage gains had been rising for a while. Chart 2 plots NFIB comp plans with y/y percent change in average hourly earnings of production and non-supervisory employees. In the past, going back nearly three decades, the two have tracked each other closely, with the former leading by about nine months. This time around, beginning around the middle of last year, the two began to diverge.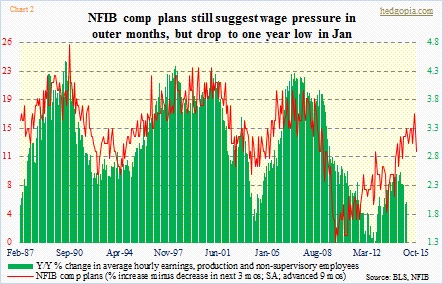
With that as a background, January’s spike in wages was a welcome relief.
Until Tuesday when the NFIB reported its January numbers. Its optimism index fell 2.5 points m/m to 97.9 (December was a six-plus-year high). More importantly, its comp plans dropped a huge five points to 12. The December reading of 17, matching the high of October 2007, had been in a nice upswing. And that is now broken, as can be seen in Chart 2. One month does not make a trend. Nevertheless, this kind of a drop in a single month probably does not bode well for small-business optimism on wages going forward.
So once again the wait game begins, as to what February might bring.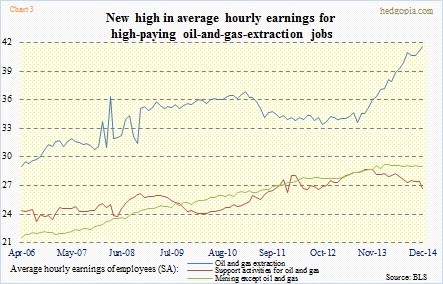
In this respect, it is worth paying close attention to Chart 3. The oil-and-extraction jobs that oil companies are now beginning to shed are high-paying; hourly wages in December reached an all-time high of $41.62. Look at that spike in blue line since July 2013. Contrast this with $24.75 for all private employees and $20.80 for production and non-supervisory employees in January. Even support jobs in oil were $26.66 in December. It is obvious anytime oil jobs are lost, that will exert downward pressure on wages in general.
