
Several crosscurrents are at work in the investing land currently. Equity bulls are at a stage when they are having to celebrate a disappointing jobs report. But the Fed currently is not focused as much on jobs as it is on inflation, which has remained above its goal of two percent for over five years now.
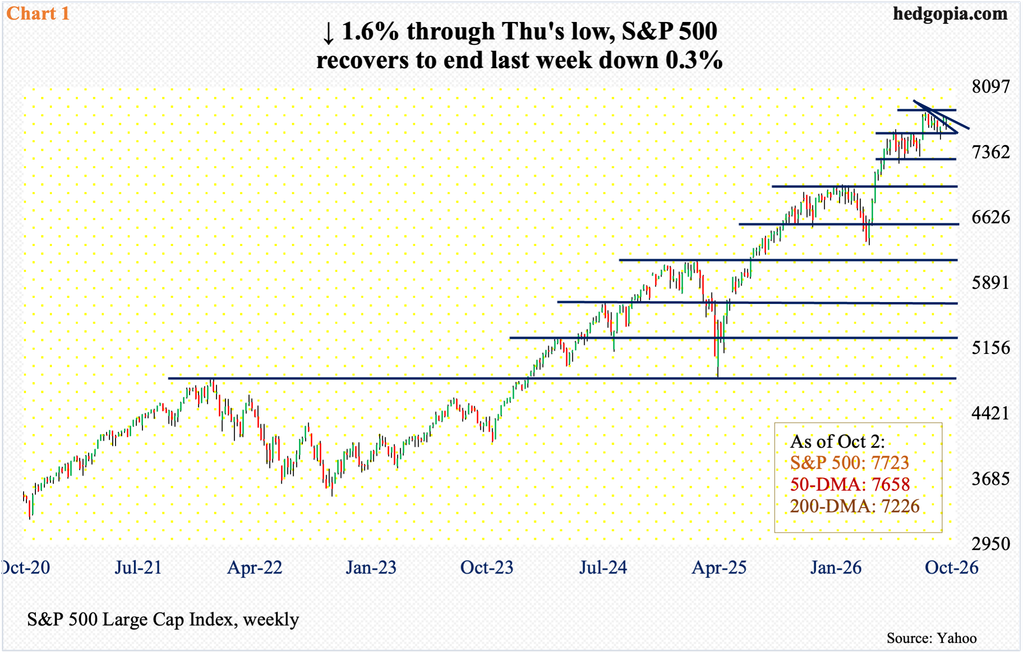
Bulls last week staged an impressive reversal in the latter couple of sessions. Bears dominated in the first three; the S&P 500 was down 1.6 percent for the week by Thursday’s low (7617), which was bought, defending 7600-plus horizontal support with a potentially bullish dragonfly doji right on the 50-day moving average (7658). Friday’s doji session brought more gains, with the large cap index only ending down 0.3 percent for the week to 7723.
The S&P 500 earlier went sideways for a couple of months after peaking at 7621 on June 2, breaking out of this consolidation on August 4, followed by a new high 7817 on the 13th that month. Bulls thus have defended 7600-plus for seven weeks now (Chart 1). Last week, they would have positioned themselves much better had they kept Friday’s intraday high 7755, which attracted sellers on trendline resistance from the August high; a takeout of this hurdle should open the door toward that high, which is 1.2 percent away.
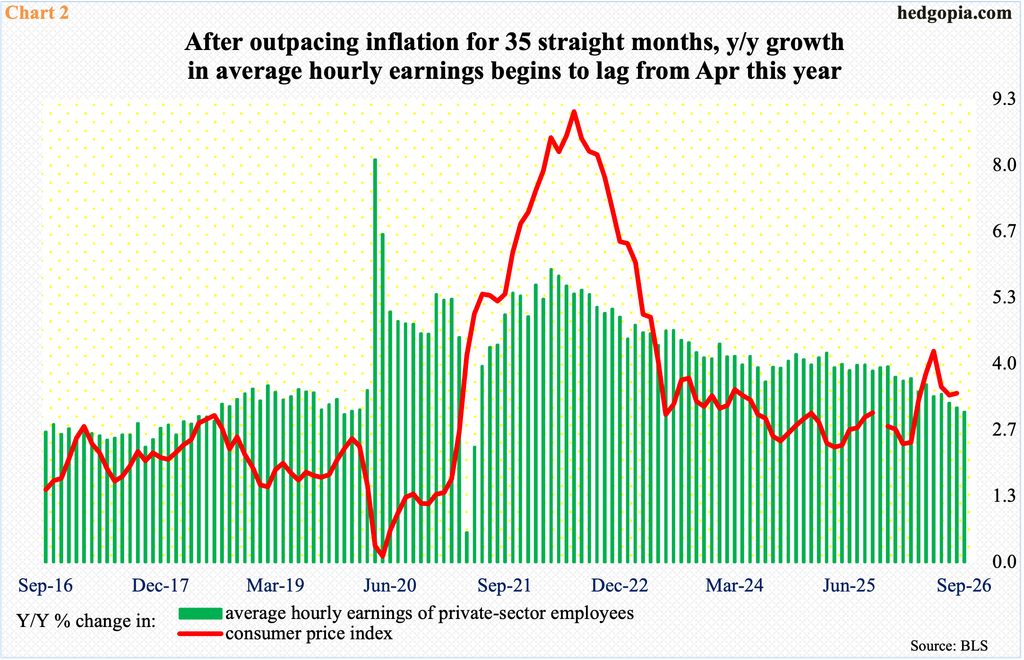
Bulls were responding Friday to September’s weaker-than-expected jobs report, which showed the economy only added 29,000 non-farm jobs, against expectations of 84,000. The unemployment rate ticked higher to 4.2 percent (from 4.14 percent in August to 4.18 percent). Concurrently, the private sector’s average hourly earnings grew three percent (3.02 percent, to be exact) from a year ago; this was the poorest showing since May 2021.
Private-sector wages exceeded inflation measured by the consumer price index for 35 months before beginning to lag from April this year (Chart 2). This translates to no wage-push inflation, and this probably gives ammunition to FOMC (Federal Open Market Committee) doves, but at the same time wages not keeping up with inflation erodes consumers’ purchasing power, particularly on the low end – the lower arm of the letter K in the so-called K-shaped economy.
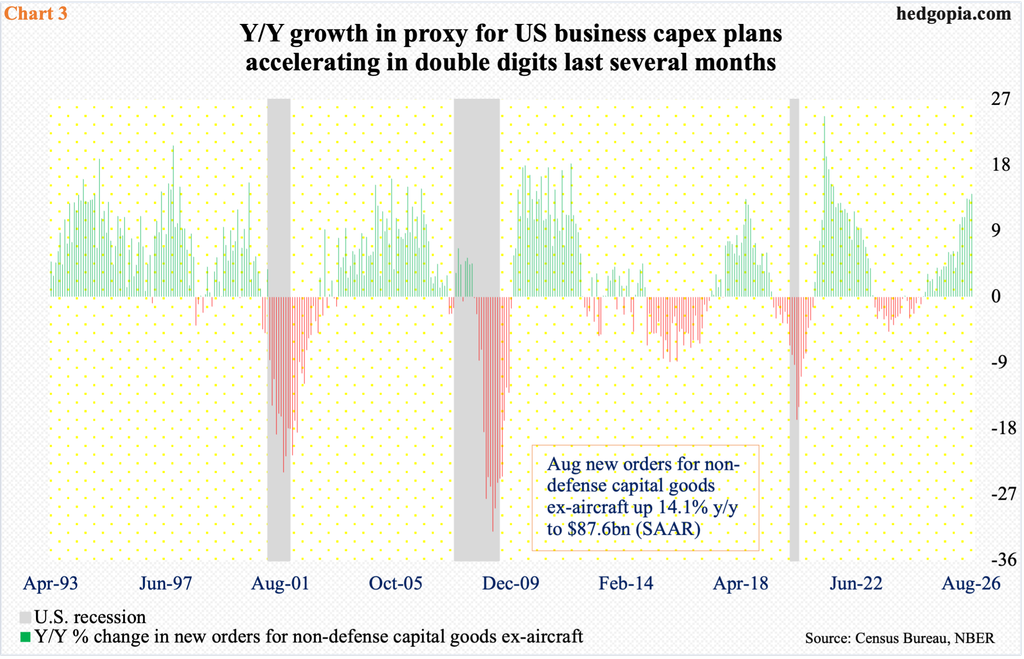
Strength currently is coming from the enhanced capital spending cycle. Just look at the green bars on the right side of Chart 3, which depicts year-over-year growth in new orders for non-defense capital goods ex-aircraft. This metric can be used as a proxy for business capex plans.
In August, spending shot up 14.1 percent from a year ago to a seasonally adjusted annual rate of $87.6 billion – of course a record. This represented the fastest y/y growth rate in five years. Capex has grown in low- to mid-double digits for five months. This has been primarily enabled by the ongoing aggressive investment by hyperscalers such as Microsoft (MSFT), Amazon (AMZN), Oracle (ORCL) and Facebook parent Meta (META), which are building out data centers to power the AI (artificial intelligence) era.
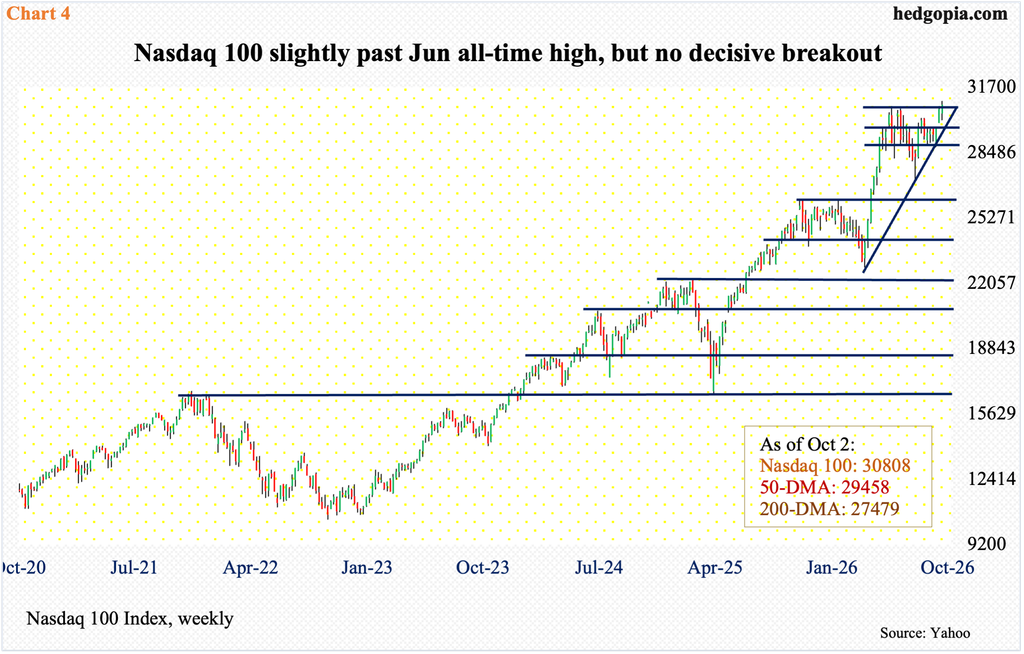
Amidst this capex boom, the Nasdaq 100 surged 34.7 percent from the March 30 low of 22841 to the June 2 high of 30762. It then went sideways and continued to do so even as other major indices like the S&P 500 and Russell 2000 posted fresh highs in August. That changed nine sessions ago – on September 22 – when the tech-heavy index edged past the June high with an intraday tag of 30771. Last Friday, bulls not only recaptured 30770s but an intraday drop to that support was bought; for the week, the index added 0.7 percent to 30808, yet tech bulls failed to hold on to the session high 31018.
To sum up, the action the last couple of weeks is encouraging for the bulls but is hardly decisive (Chart 4). Momentum is with them as we speak, and they must prove this week that the feeble breakout is no fluke.
There was a time when the leading U.S. tech outfits were wallowing in money, thanks to healthy cashflow and a clean balance sheet. The ongoing aggressive AI investment has turned this phenomenon on its head. These companies these days are also taking on debt to fund the buildout of AI infrastructure.
So, interest rates will matter. From the perspective of hyperscalers, the positive is that markets thus far have embraced their debt, while the negative is that rates in general are trending higher.
Mid-September, the fed funds rate was raised by 25 basis points to between 3.75 percent and four percent. This was the first hike in a little over three years, and more hikes are coming. The base rate had been left unchanged since last December when it was reduced by 25 basis points; this preceded a cut of similar magnitude in September and October. Earlier, rates reached a cycle high 5.25 percent to 5.50 percent in July 2023, followed by cumulative cuts of 100 basis points over three meetings in 2024.
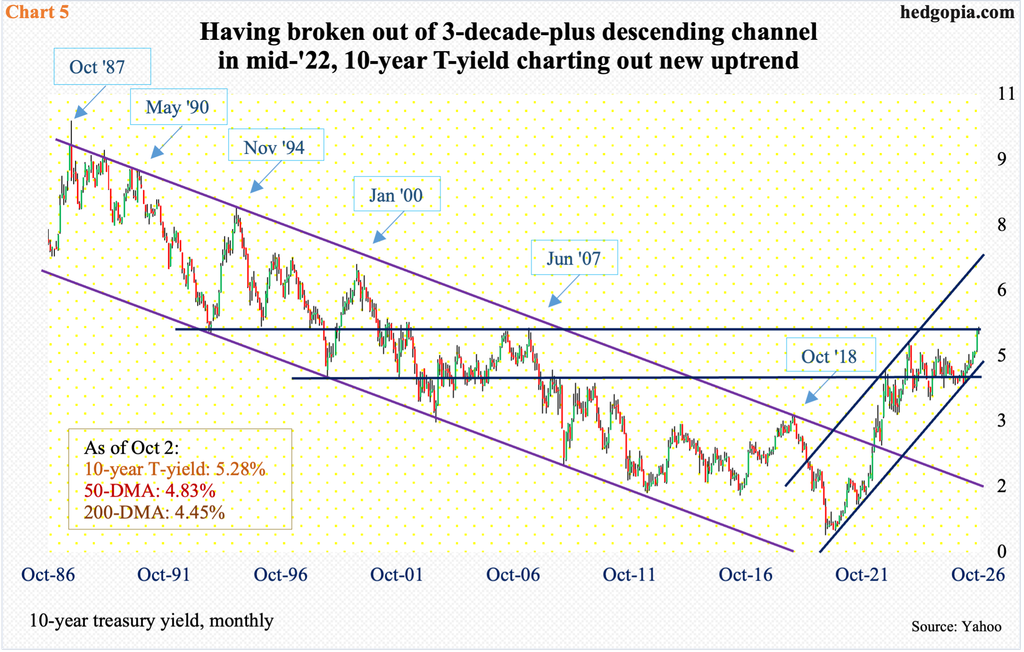
The 10-year treasury yield, in the meantime, has rallied from 3.96 percent in February to last Thursday’s intraday high of 5.34 percent, before ending the week at 5.28 percent. These rates have come a long way in recent weeks, and a retreat is likely – if nothing else just to unwind the overbought condition the 10-year is in. But it increasingly feels like a higher floor is the most likely outcome. Since breaking out of a three-decade-plus descending channel in mid-2022, a new uptrend has been firmly in place (Chart 5).
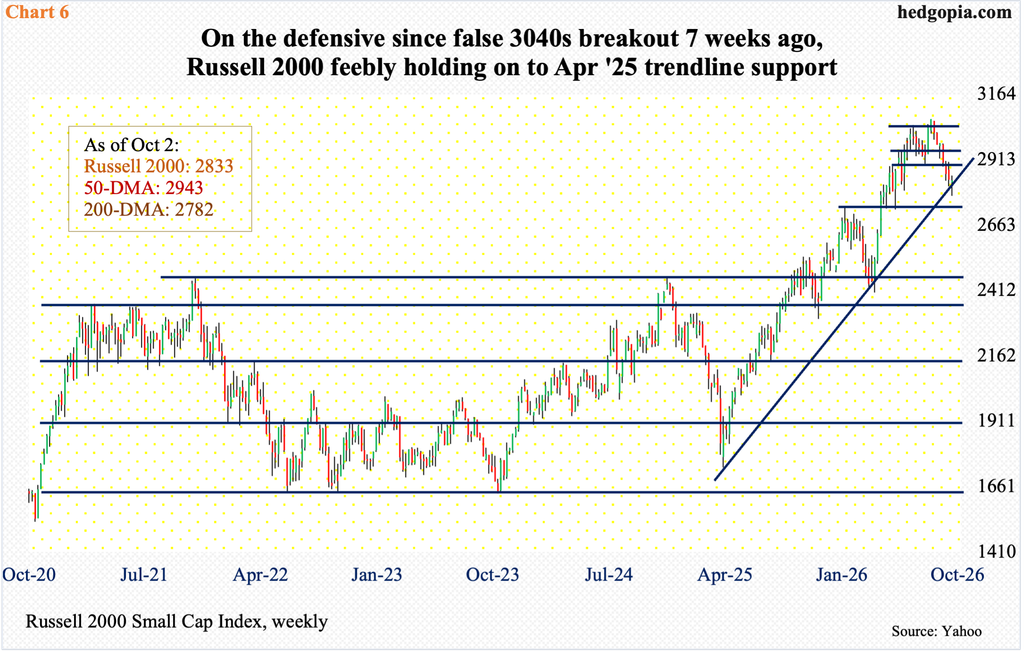
In recent weeks, nowhere are interest-rate worries reflected better than in small-caps, which by nature tend to be leveraged, with more exposure to the short end of the yield curve.
On August 14, the Russell 2000 peaked at 3070 and has been in a downtrend since, with six out of seven down weeks. Last week, the small cap index gave back 0.15 percent to 2833. In the week it posted that high, it falsely broke out of 3040s. Since then, small-cap bulls have also failed to defend horizontal support at 2940s and 2880s.
The 50-day (2943) has been breached, but the 200-day (2782) was successfully tested on Friday. The Russell 2000 also sits right on trendline support from a major low reached in April last year (Chart 6). In the event the index gains strength near term, nearest hurdle lies at 2880s.
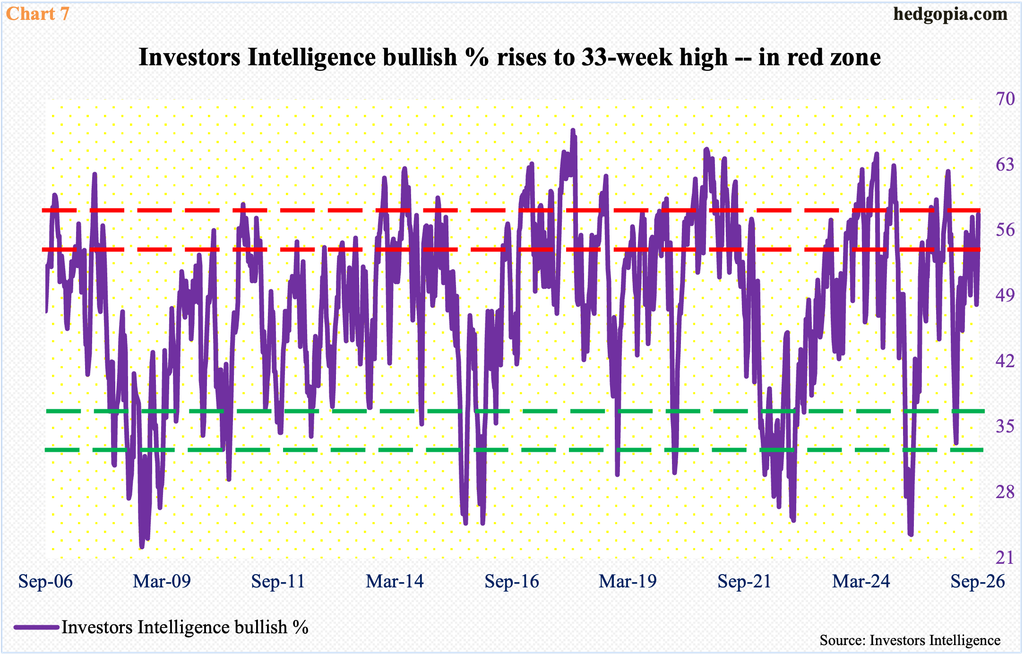
Overall, though, rising interest rates are yet to put a dent in investor sentiment. As of last Tuesday, Investors Intelligence bullish percent jumped 5.8 points week over week to 57.7 percent. This was a 33-week high and followed strength in the S&P 500 in the prior week as the large cap index rallied within 0.4 percent of its August high, while the Nasdaq 100 similarly edged past its prior high from June.
Sentiment likely strengthens further should these indices attract bids this week, the odds of which cannot be denied. Bulls are already in the red zone, and bullish sentiment will push deeper into extended territory in this scenario (Chart 7).
Thanks for reading!
