
Major US equity indices have a rough start to 2022. From their recent highs to Monday’s lows, they have all suffered double-digit percent declines, with small-caps tumbling more than 20 percent. Amidst this rout, both Monday and Tuesday produced potentially reversal candles. Should stocks come under pressure post-FOMC decision later this afternoon, that probably gets bought.
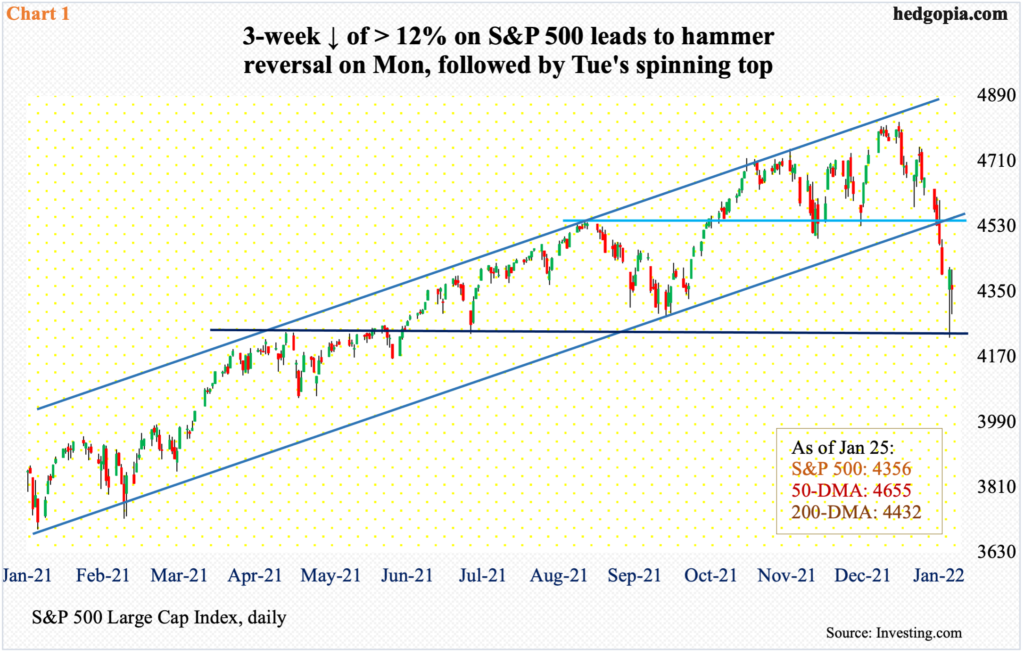
On the 4th this month, the S&P 500 reached a fresh intraday high of 4819. Just a few sessions before that, the large cap index broke out of 4740s. It turns out the breakout was false. Gradually, selling picked up momentum, losing the 50-day moving average, which has now sharply turned lower, on the 13th and then the 200-day last Friday.
The large cap index began this week by collapsing four percent intraday Monday to 4223; by then, it was down 12.4 percent from its high early this month. Horizontal support at 4200s goes back to last May. This drew bids; by the time Monday closed, the index reversed 0.3 percent higher, forming a huge hammer reversal (Chart 1). Tuesday’s was a similar yo-yo session, with a high of 4411 and a low of 4287, closing at 4356, for a spinning top.
The S&P 500 has suffered technical damage, as have several other indices. But the manner in which the index acted in the first two sessions this week speaks of the possibility of a relief rally soon.
Small-caps are the same way.
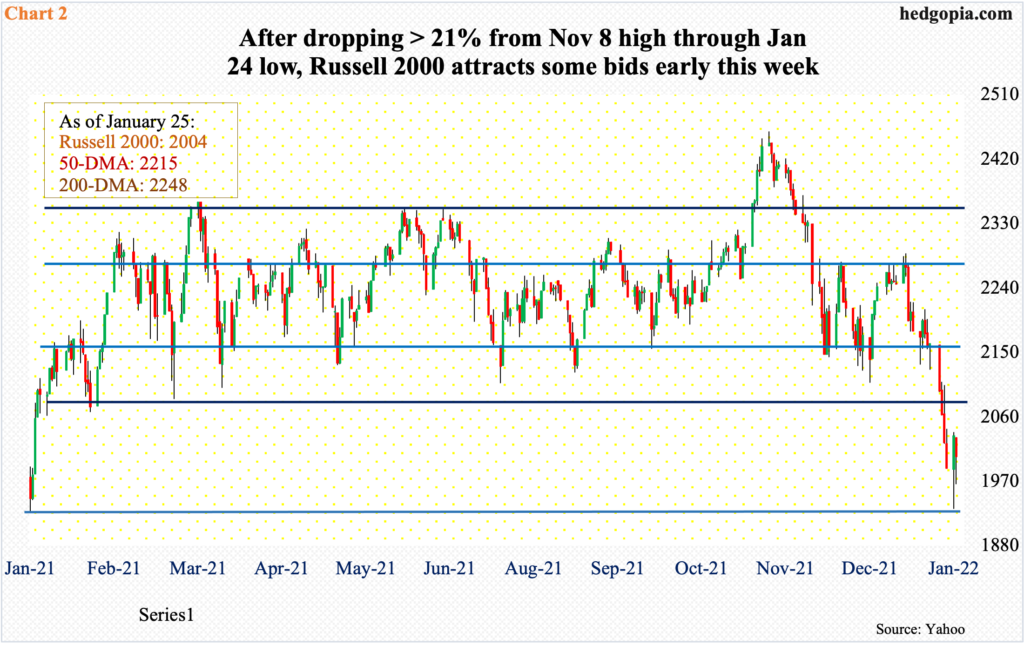
As a matter of fact, the Russell 2000 peaked as far back as November 8 at 2459, having broken out of a rectangle three sessions before that.
Since March last year, the small cap index has been rangebound between 2350s and 2080s, and between 2280s and 2150s within this box. The Nov 3 breakout was quickly followed by a failed retest on the 19th (Chart 2).
Fast forward to Tuesday last week, the Russell 2000 broke down, falling out of the aforementioned box, and losing both the 50- and 200-day. By Monday, it was down to 1931. This was a test of last January’s low, having declined 21.4 percent from last November’s high. As was the case with the S&P 500, Monday’s low was bought, resulting in a hammer reversal; Tuesday ended down 1.4 percent, but once again the session low was bought.
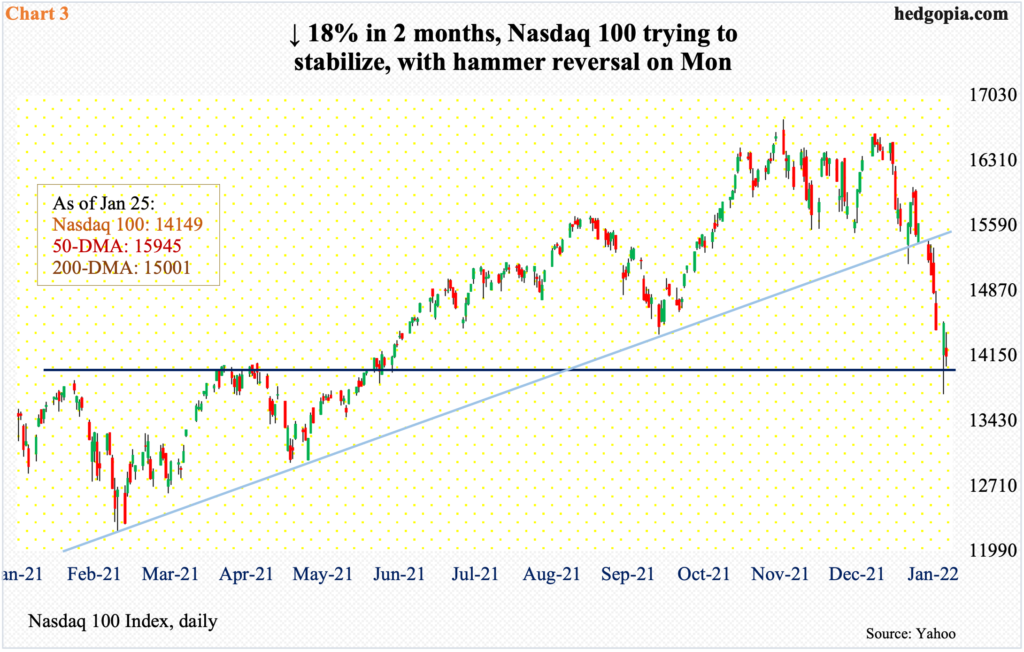
Monday also saw a hammer reversal on the Nasdaq 100; intraday, the index was down 4.9 percent but reversed to end the session up 0.5 percent. Selling continued on Tuesday, but once again there were bids waiting at 14000, which represented the highs from last April.
Incidentally, the tech-heavy index peaked on November 22 at 16765. A lower peak of 16607 was established on December 28. A few sessions later, it came undone, losing the 50-day on Jan 5 and the 200-day on the 20th. In essence, through Monday’s low, the Nasdaq 100 (14149) lost 18.1 percent in a couple of months.
Medium- to long-term, more pain probably lies ahead for the bulls. Right here and now, relief is possible.
How volatility behaves in the sessions ahead will be a big tell.
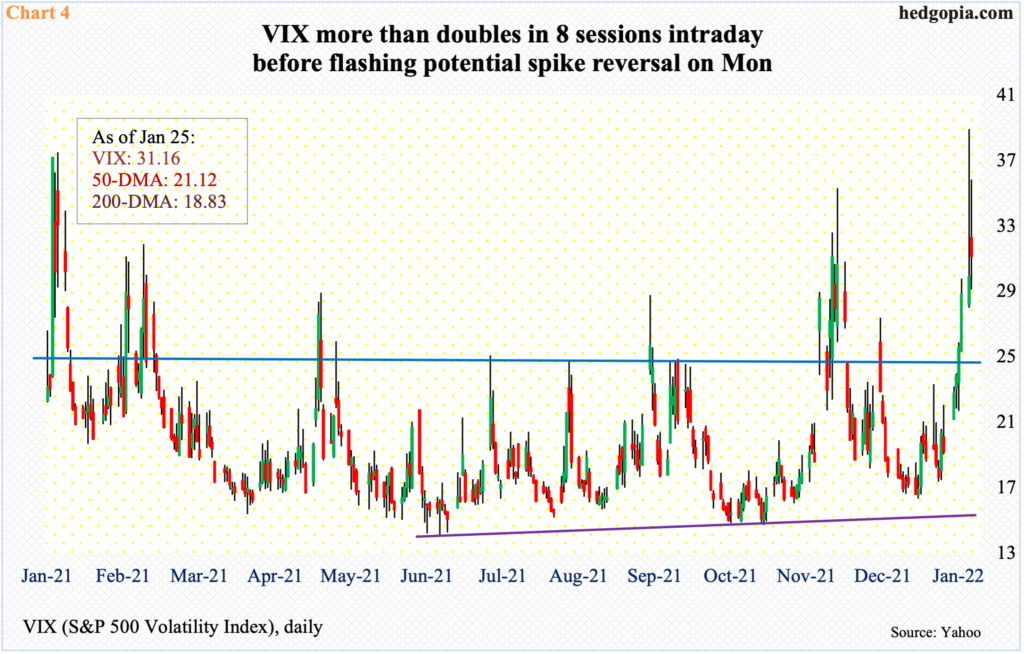
VIX, in this regard, rallied as high as 38.94 on Monday; this was the highest print since it tagged 41.16 in October 2020, but volatility bulls were unable to hang on to all of the gains, with the session ending at 29.90, forming a massive reversal candle. On Tuesday, it rallied 1.26 points to 31.16 but once again closed substantially lower from the session high 35.85.
If past is prologue, spike reversals have tended to mark peaks in VIX (Chart 4). It is a little too soon to declare Monday’s action as such, but odds are growing. In this scenario, the volatility index can drop a decent amount before the daily overbought condition it is in gets unwound. There is decent support at mid-20s.
With all this in the background, should equities come under pressure after the FOMC statement is published later this afternoon, the weakness probably gets bought – for a relief rally.
Thanks for reading!
