
Large-cap bulls last week squandered an opportunity to leave a decisive mark on the S&P 500 and Nasdaq 100. Those chances instead went begging, leaving the door open for the bears to inflict more pain.
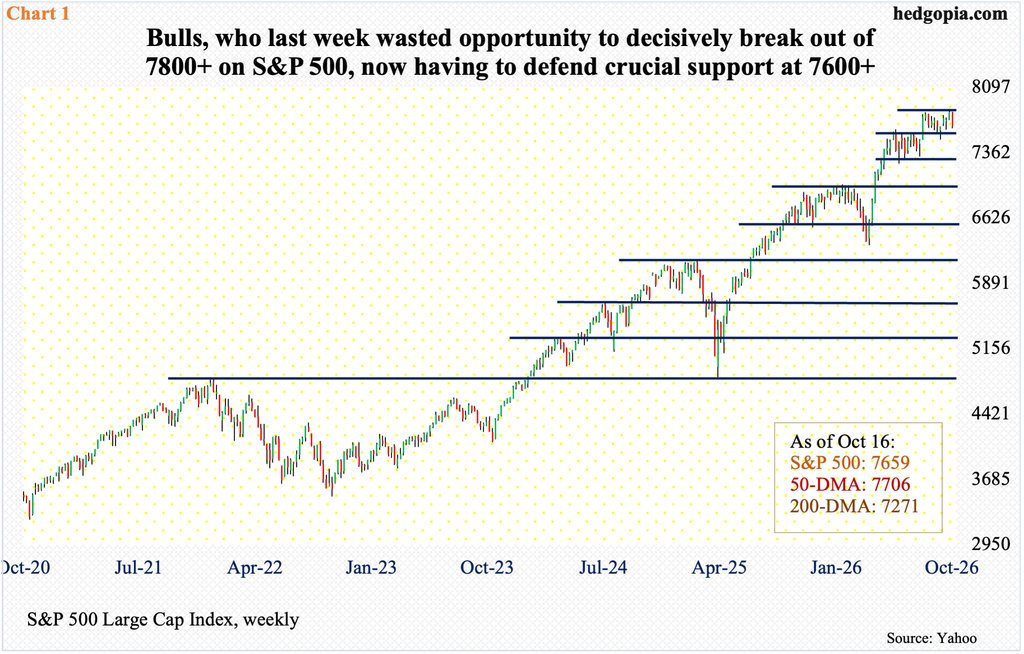
Going into last week, the S&P 500 sat at a crucial juncture. Bulls had an opportunity to decisively break the index out of 4800-plus. It had gone sideways in a 200-point range for two and a half months, with resistance north of 4800 and support north of 4600.
Earlier, in early August, a similar opportunity resulted in a breakout. After peaking at 7621 on June 2, the large cap index had consolidated for a couple of months; a breakout ensued on August 4, followed by a high of 7817 on the 13th that month and a newer high of 7845 on the 6th this month.
This time around, however, bulls came up short, as last Monday’s feeble attempt to rally quickly faltered, and the S&P 500 never regained footing, slicing through the 50-day moving average (7706) on Friday to 7659, down a couple of percent for the week.
Friday’s intraday low of 7632 did attract bids, but a bigger test probably lies ahead, with odds rising of a breach of 7600-plus (Chart 1).
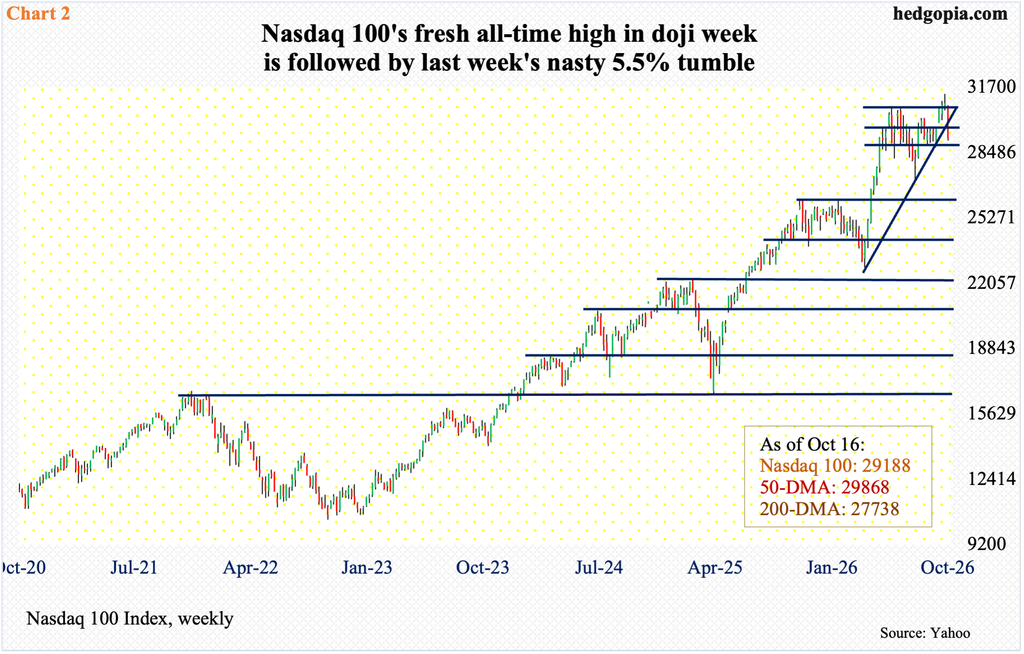
Similar dynamics were at play on the Nasdaq 100, where tech bulls were positioned well to definitively break out of 30770s, but the level ended up attracting way more offers than bids. The index was punished for a 5.5 percent tumble last week.
On June 3, the Nasdaq 100 tagged 30762, which was taken out four months later, on October 3; on October 6, the tech-heavy index printed a fresh high of 31361, although the session ended with a shooting star and the week with a doji. This was followed by last week’s genuine downward pressure, which also compromised the 50-day (29868) and the rising trendline from March this year (Chart 2).
As things stand, the ball belongs to the bears.
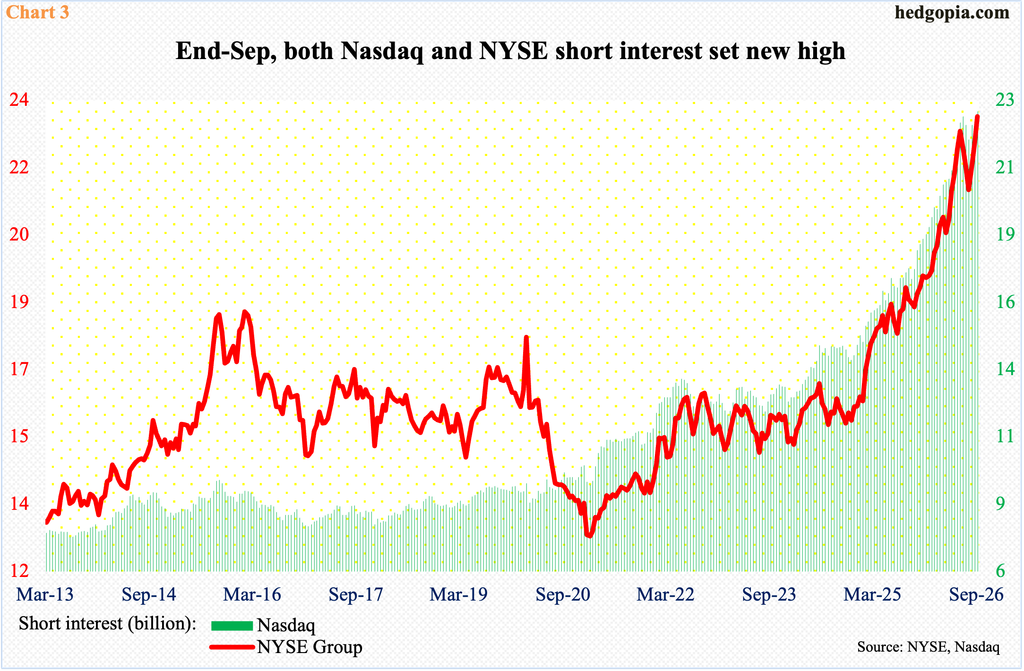
At the end of September, shorts were the most aggressive they have ever been. NYSE and Nasdaq short interest were at record as of September 30, with the former at 23.4 billion and the latter at 23.1 billion, up 2.8 percent and 2.5 percent respectively from a fortnight ago.
Most recently, shorts have gotten very aggressive since mid-August when NYSE short interest was at 21.6 billion and Nasdaq’s at 22 billion (Chart 3). The major indices are lower from mid-August, so shorts have done well, particularly the news ones.
That said, short interest began to rise in earnest since early last year, and equities have performed very well during the period, so the ones who have stubbornly remained short are still nursing their wounds.
The problem with this datapoint is that there is a long lag before it is published, so the mid-September numbers could look entirely different by now, as the mid-October period is already over.
If the bears in the days and weeks to come fail to cash in on the latest opportunity that has come their way, they could in turn come under pressure to cover, and the elevated short interest could end up lending a helping hand to the bulls.
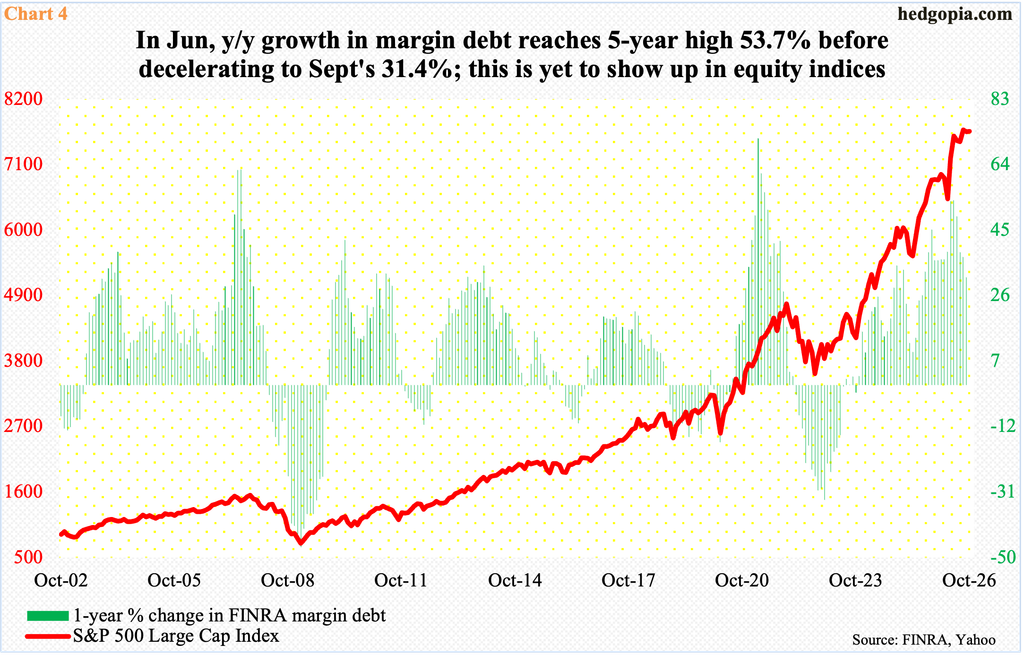
Bulls already have full cooperation from margin debt. In September, FINRA margin debt increased $26.2 billion month over month to $1.48 trillion, just shy of record $1.5 trillion reached in June. From March this year when equities bottomed, margin debt was $1.22 trillion, and $850.6 billion in April last year.
There is this, though. The year-over-year percent change is in deceleration. In May this year, margin debt grew 53.7 percent from a year ago, and by September this had eased up to 31.4 percent. Historically, this metric tends to correlate with the S&P 500 (Chart 4). This is yet to occur this time around.
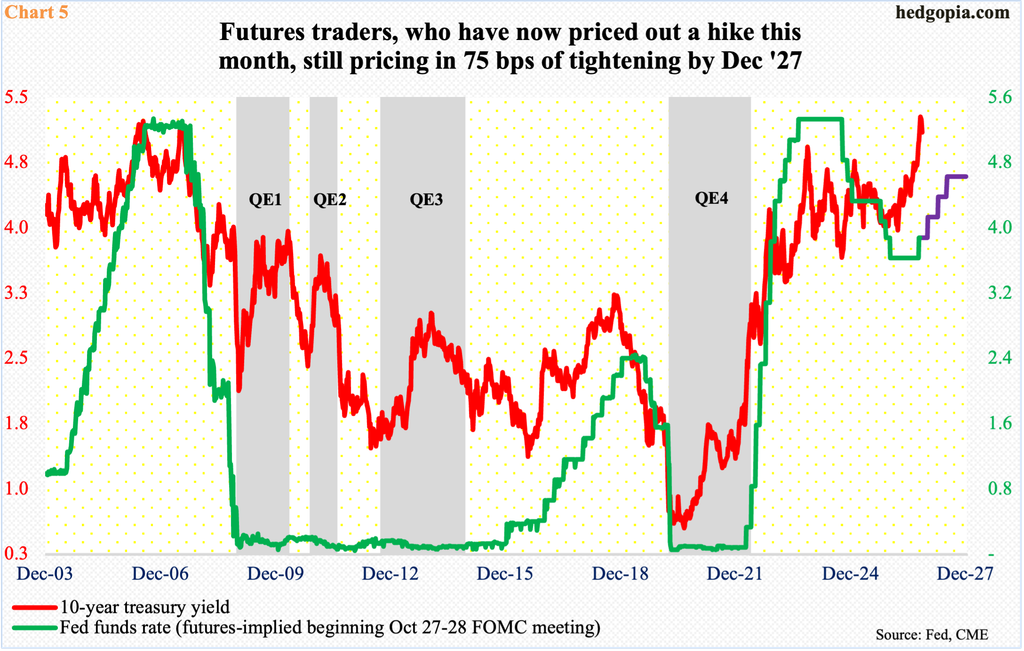
Bulls last week also failed to take advantage of interest rates that reversed lower. The 10-year has been rallying relentlessly since February this year when these notes were yielding 3.96 percent. On the 7th this month, the yield reached 5.36 percent, which was the highest since April 2002, before coming under pressure a tad since.
Last week, the 10-year shed 15 basis points to 5.1 percent, with Thursday tagging 5.04 percent intraday. With the kind of rally the 10-year has had in recent months, a little fatigue is perfectly natural. There is crucial support at five percent, and it is possible the equity bulls are waiting to see if the support gets breached.
In the meantime, markets are no longer expecting an increase in the fed funds rate in the upcoming FOMC meeting, slated for 27-28 this month; until just a few weeks ago, CME futures traders overwhelmingly had their money on a quarter-point rise. For the first time since July 2023, the benchmark rates last month were raised by 25 basis points to a range of 3.75 percent to four percent.
The futures traders nevertheless expect a hike in December, followed by two more in the first half next year, ending 2027 between 450 basis points and 475 basis points (Chart 5).
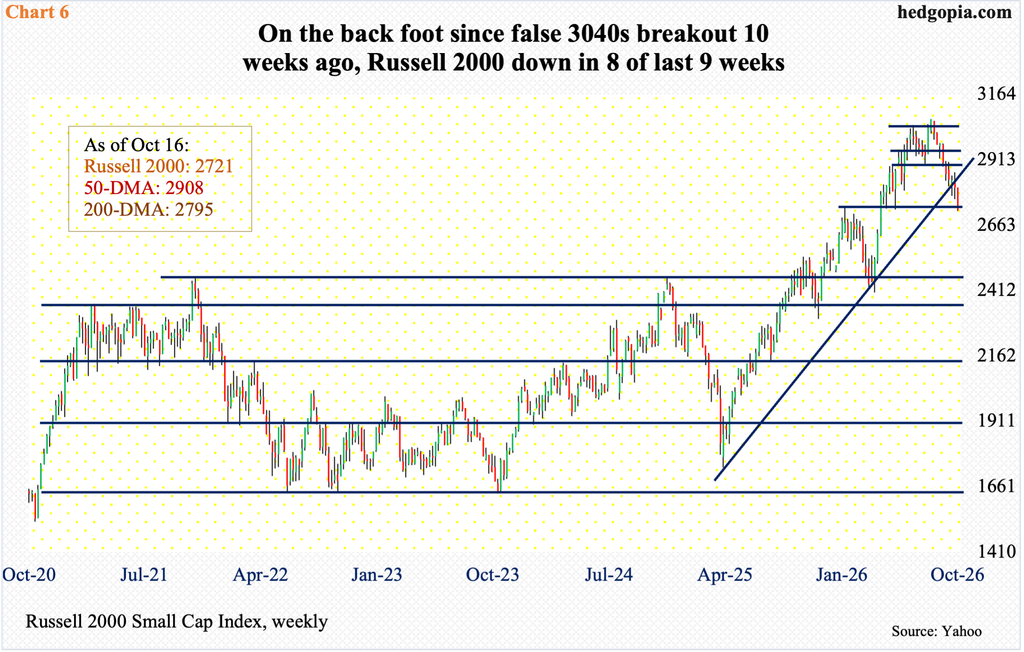
Small-caps will hurt in this scenario, and the Russell 2000 reflects this fear.
Small-cap businesses by nature have a large exposure to the domestic economy versus their mid- to large-cap brethren which also have international exposure. They also tend to be leveraged, with more exposure to the short end of the yield curve.
The 10-year broke out of 4.75s early September, even as the FOMC was getting ready to hike the base rate in the middle of that month. The Russell 2000 peaked at 3070 on August 14, falsely breaking out of 3040s; in the subsequent weeks, horizontal support at 2940s and 2880s was compromised.
Last week’s 3.1-percent decline to 2721 represents the sixth weekly loss in a row – and eighth in nine. There is horizontal support at 2700, which, from the bulls’ perspective, is the good thing (Chart 6). But in the process of dropping 350 points over two months, several support levels have been breached, and the bulls have their back against the wall. In the event of a rally, the 200-day lies right above at 2795.
Thanks for reading!
