
Non-commercial futures traders are heavily on the short side. They can get forced to cover or get squeezed if equity longs had their way. It is not going to be easy for the latter. Having already spent a nice bit of currency since last October’s low, bulls are also looking at technical hurdles.
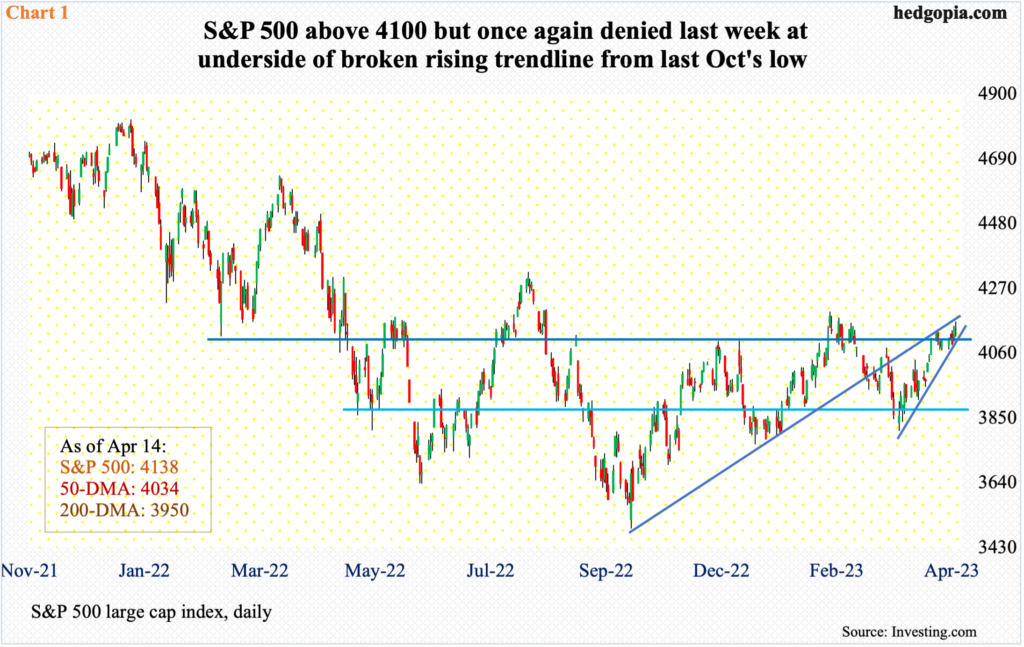
The S&P 500 lost 27.5 percent from its all-time high of 4819 set in January last year to last October’s low 3492. From that low through February’s 4195, it then rallied 20.2 percent. Bulls have since gone after that high at least a few times, but with no success. Last Friday, in a long-legged doji session, the large cap index tagged 4163 intraday but only to reverse and close at 4138.
The index could very well be itching to take a pause as it rallied 9.3 percent within a month, having troughed at 3809 on March 13. The daily as a result is way overbought. Plus, the bulls are looking at at least a few technical Hurdles.
There is horizontal resistance at 4100 – or just north of it. This coincides with the underside of a broken rising trendline from last October’s low (Chart 1).
A decision time is upon us, as the wedge the index is in is getting narrower.
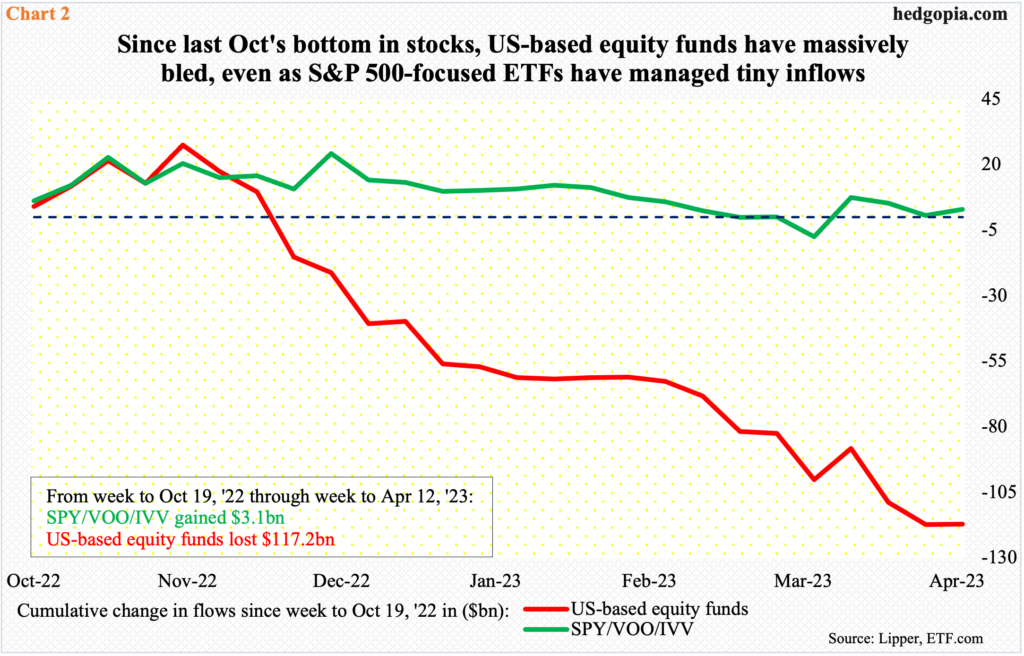
Interestingly, the S&P 500 managed to rally north of 20 percent from last October’s low without much help from fund flows.
The index bottomed on October 13 last year. Until the week to the 12th that month, US-based equity funds had been bleeding profusely as selling took hold. After the major indices bottomed on the 13th, flows began to cooperate, taking in $21.5 billion in the next three weeks. The momentum soon stopped. As a matter of fact, the rally in the S&P 500 – and others – have been used as an opportunity to exit/lighten up long positions.
From the week to October 19 last year to the one ended last Wednesday, these funds saw redemptions of $117.2 billion (Chart 2). During the same period, SPY (SPDR S&P 500 ETF), VOO (Vanguard S&P 500 ETF) and IVV (iShares Core S&P 500 ETF) combined drew $3.1 billion. That is it!
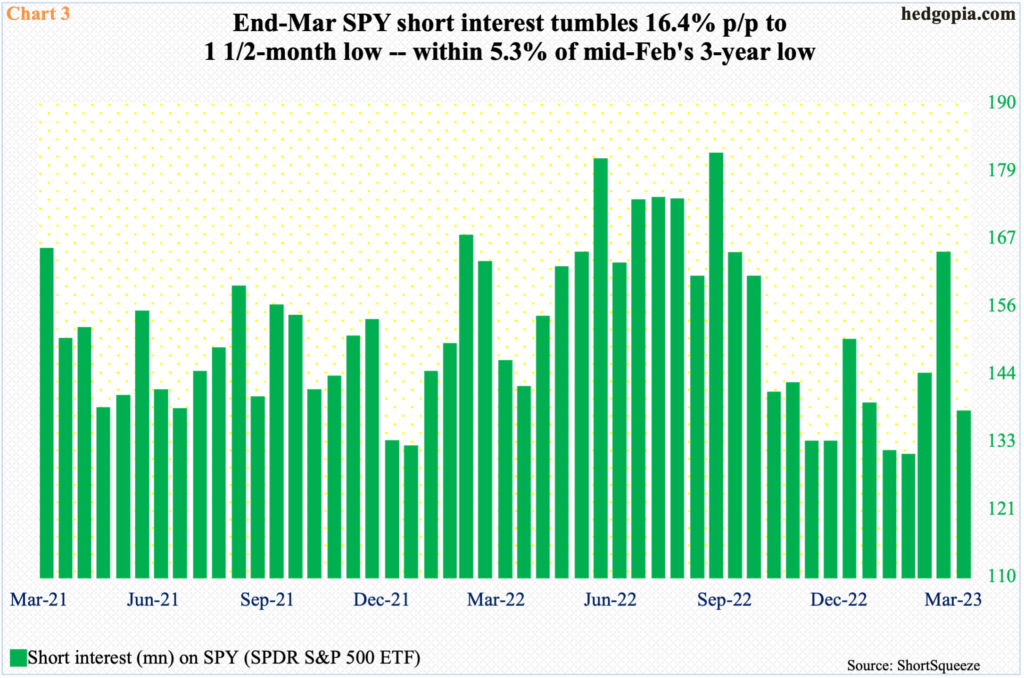
From this angle, equity bulls deserve kudos to have managed to rally the S&P 500 as far as they have. They did get some help from the bear camp.
By mid-September last year, SPY short interest had risen to 180.5 million, which was the highest since end-February 2021. Shorts were still sitting at 159.8 million by mid-October; once again, the ETF/S&P 500 bottomed on the 13th that month. By mid-February, this got reduced to 129.7 million – a three-year low – as shorts turned tail in the face of snorting bulls (Chart 3).
Short interest then rose to 163.8 million mid-March, but only to drop 16.4 percent in the next period to 137 million, which is only 5.3 percent from the mid-February low. In other words, shorts are now lying low, suggesting this is no longer a potential tailwind as it was in the latter months of last year.
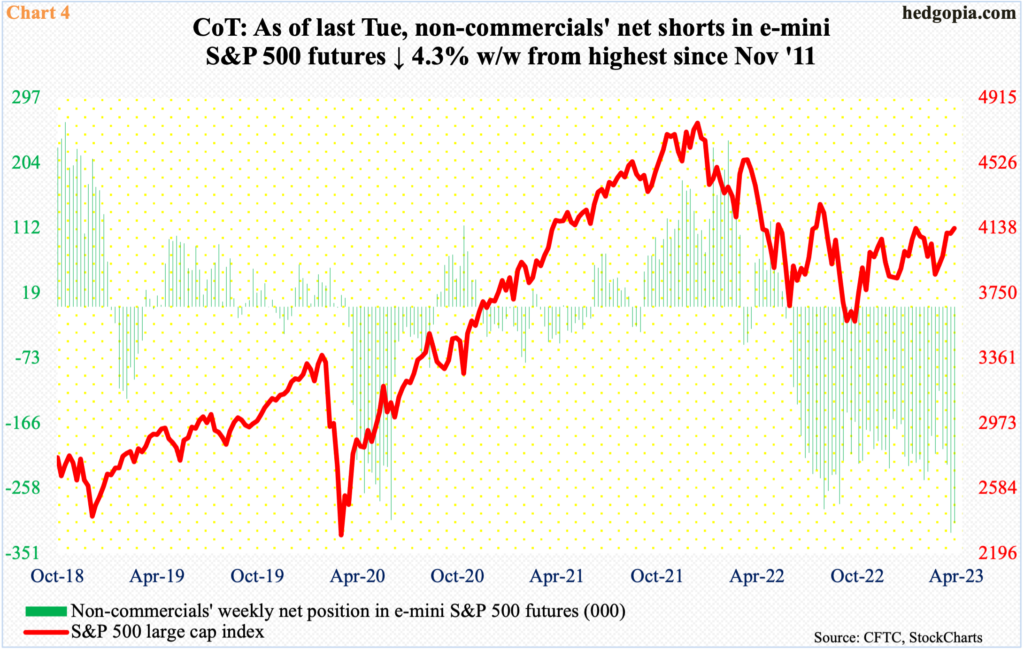
Things are different in the futures market, where non-commercials continue to show aggression in their bearish outlook.
By the week to October 18 last year, these traders were net short 223,198 contracts in e-mini S&P 500 futures. Following several ups and downs, they cut their holdings to 119,819 by March 14, before aggressively going the other way. By the week to April 4, they were sitting on 321,459 net shorts – the highest they have ever been short since November 2011. In the week to last Tuesday, they cut this to 307,612, which continues to remain massive (Chart 4).
From longs’ perspective, this creates an opportunity to squeeze these shorts, but for that they have to deliver.
Non-commercials might reconsider their bearish bias should the S&P 500 decisively takes out the dual resistance mentioned above – horizontal at 4100, or just north of it, and the underside of a broken rising trendline from last October (Chart 1). There is, in fact, one more.
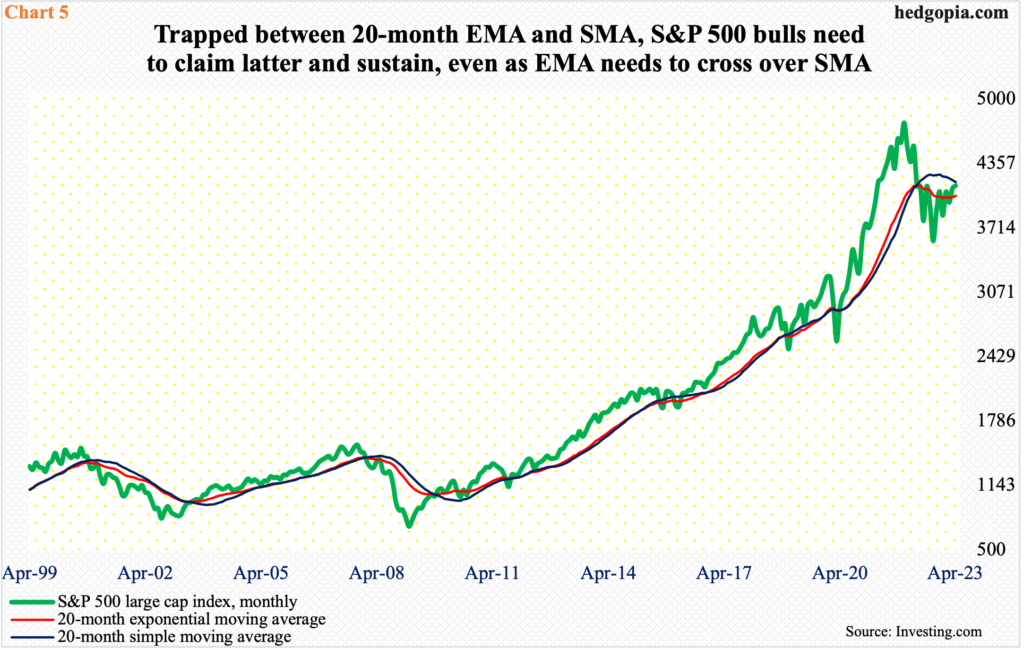
Chart 5 presents the S&P 500 monthly closing price along with a 20-month average – both simple and exponential. A simple moving average is just that – simple, calculating the average price over a specific period. Exponential, however, assigns more importance to recent prices.
Last Friday’s intraday high of 4163 was rejected just short of the 20-month simple moving average at 4174; the average is still pointing down. Ideally, even if the price rallies above this average, it pays to watch if a retest attracts more bids.
The 20-month exponential moving average (4034), however, has already curled up, with the S&P 500 above it. There is this, though. If past is prelude, a rally will only have sustaining power once the exponential crosses over the simple, which is clearly not the case now, and which the bulls have to work very hard to achieve.
Thanks for reading!
