
The 10-year yield rallied from 1.13 percent in early August to last Friday’s 1.69 percent. Bond bears expecting higher rates are getting aggressive. At some point, they risk being in a crowded trade.
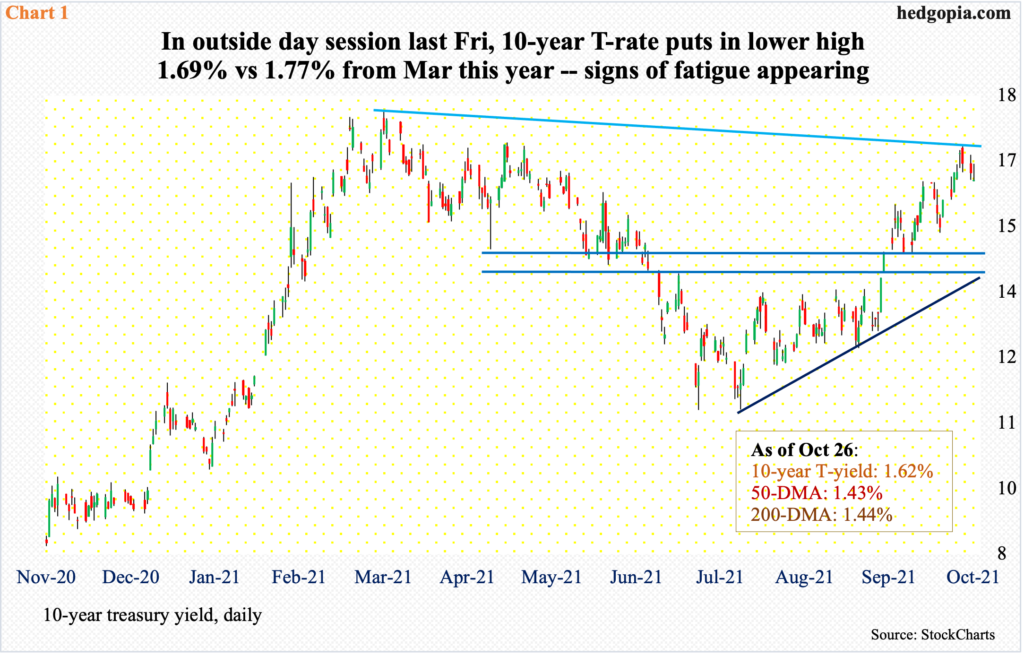
The 10-year treasury yield is flashing signs of fatigue. Tuesday’s session produced a gravestone doji. Last week, Friday formed an outside day and Thursday a dragonfly doji (Chart 1).
These candles are showing up after rates rallied from 1.13 percent in early August this year to last Friday’s 1.69 percent. Earlier on March 30 (this year), the 10-year ticked 1.77 percent.
Last week’s high of 1.69 percent, which came in an outside day session, could prove to be an important high.
Rates are behaving this way as shorts are getting aggressive.
For the uninitiated, rates and prices are inversely related. Bond shorts hence are betting on higher rates, which bottomed in March last year. So, directionally, they have been right for a while. But at some point, the trade can as easily turn into a crowded short.
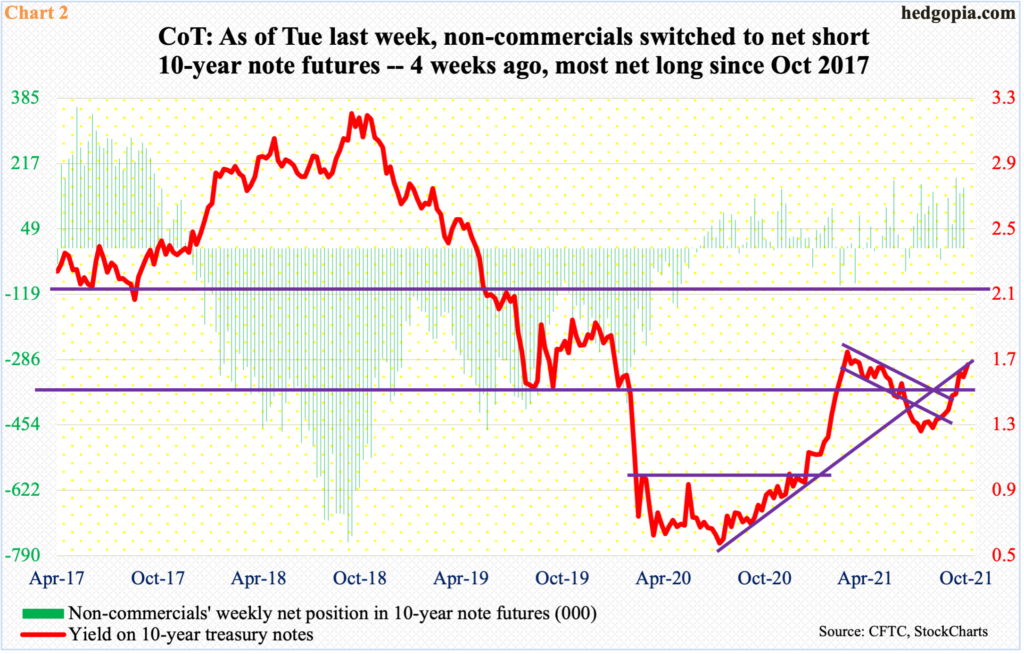
As of Tuesday last week, non-commercials were net short 544 contracts in 10-year note futures (Chart 2). This is nominal but in the week before that they were net long 156,042, so the net change is huge. This week’s (as of Tuesday) will be out this Friday and will be revealing.
As of last week’s positioning, these traders were clearly leaning bearish.
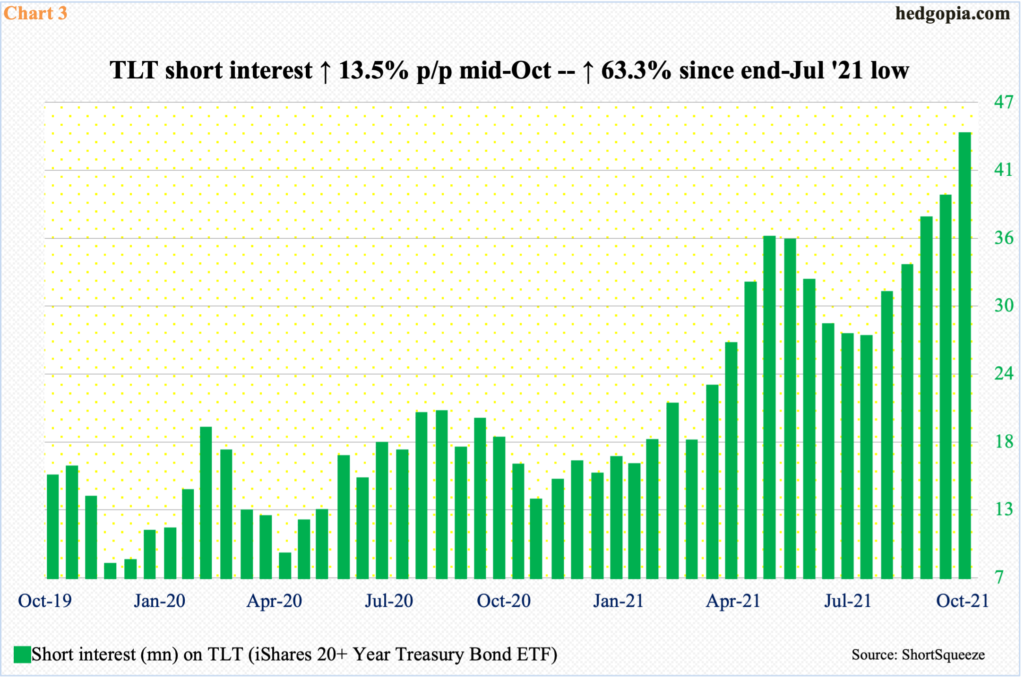
TLT (iShares 20+ Year Treasury Bond ETF) short interest is the same way. Mid-October, it rose 13.5 percent period-over-period to 44 million. This was the fifth straight p/p increase, having bottomed at the end of July at 27 million (Chart 3). From that low, short interest has gone up 63.3 percent.
It increasingly feels like these shorts are trying to pick up pennies in front of a steamroller. At some point, short squeeze becomes a real risk.
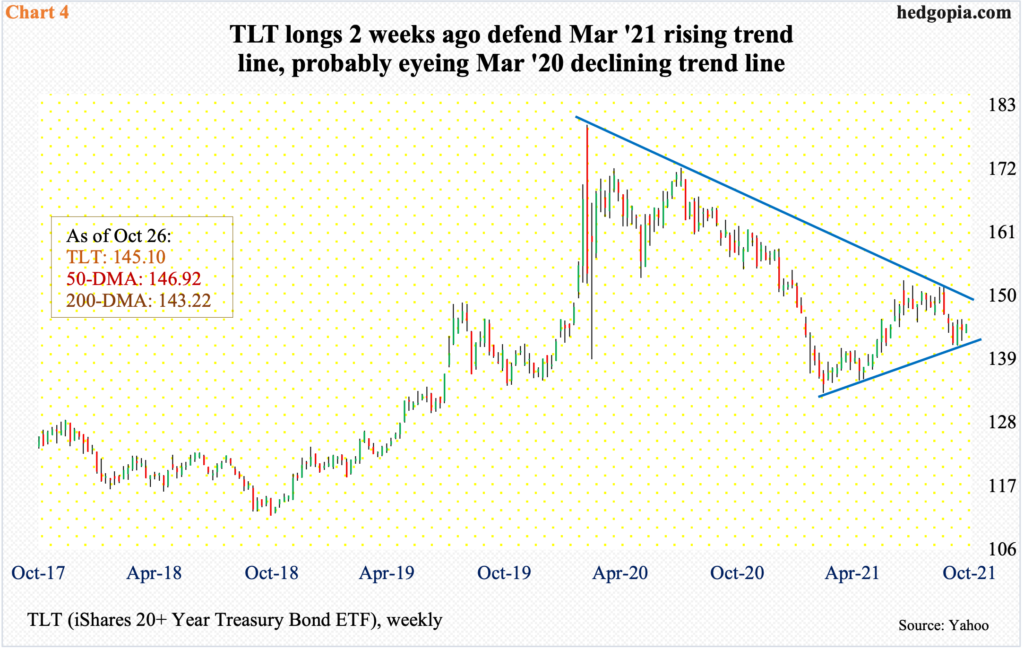
On the 11th this month, TLT longs defended a rising trend line from March this year. Last Friday, the ETF ($145) rallied back above its 200-day. The 50-day at $147 lies above. Around $150 lies crucial trend-line resistance from March last year (Chart 4).
In the event the rising trend line from March gets tested again, it likely meets with bids around $142. In this scenario, hypothetically, a November 12 143.50 short put fetches $1.30. If put, it is an effective long at $142.20.
Thanks for reading!
