
An extremely overbought equity market used a spike in long rates as an excuse to lock in profit last week. Maximum complacency is evident in equity options, even as the 10-year sits right at trendline resistance from October 2023; a breakout is bound to reverberate through a whole host of assets, including equities.
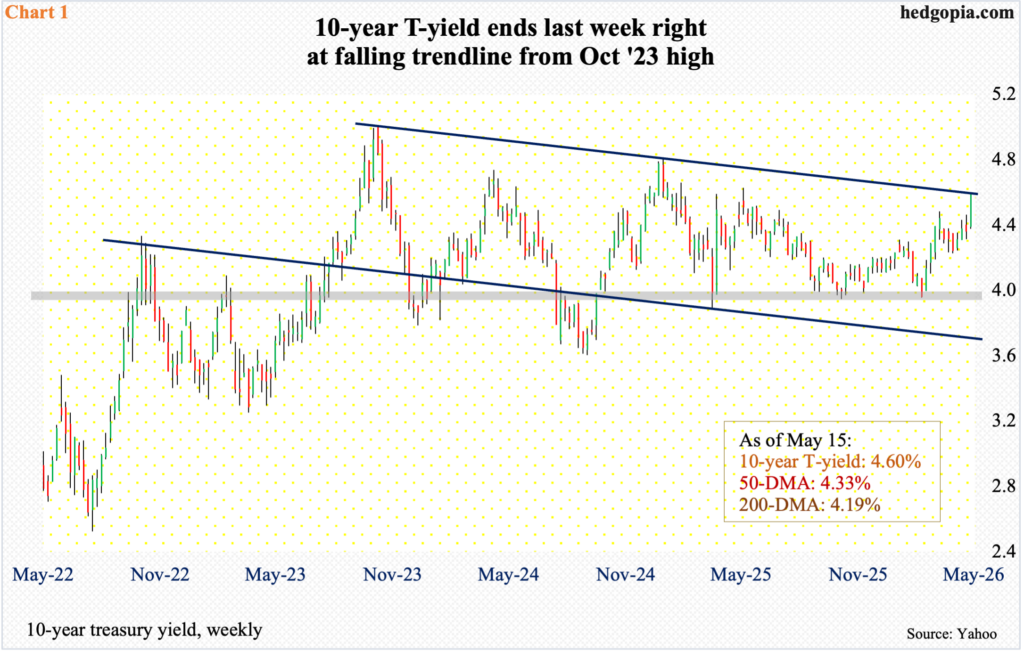
The 10-year treasury yield last week jumped 23 basis points to 4.6 percent, gapping up on Friday to a one-year high and closing at a crucial level.
Rates peaked at five percent in October 2023. This was followed by a lower high 4.81 percent in January last year. A declining trendline thereof extends to where the 10-year closed last week (Chart 1). The downward pressure after these highs bottomed at four percent or just underneath, with the most recent low having come in February this year at 3.96 percent.
Momentum is with the bond bears, who benefit if rates continue higher (price and yield are inversely related). The daily (in yield) is getting a little extended, but the weekly has room to run still. If yields decisively break out, repercussions will be felt across assets, not the least of which are equities.
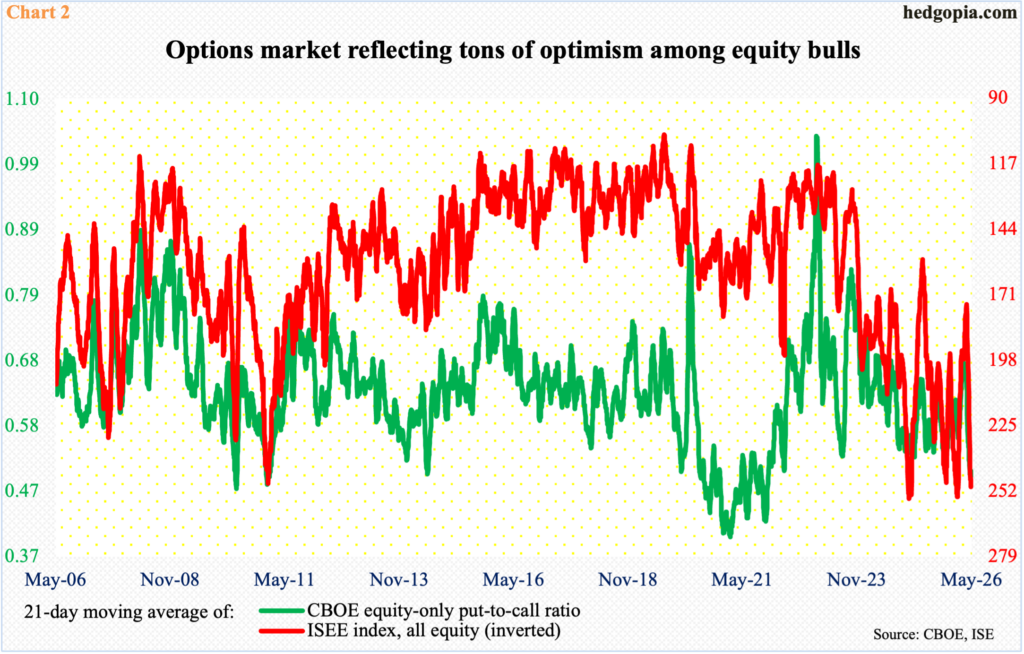
Last week’s spike in yields and the selloff in equities came at a time when bullish sentiment was beginning to reek of froth. This was evident in the options market. Risks are particularly heightened for new longs.
The CBOE equity-only put-to-call ratio has now produced readings of 0.50s or lower for 28 consecutive sessions, 12 of them in the 0.40s. The 21-day average of the ratio ended last Friday at 0.506, even as the prior four readings finished just under 0.5.
Concurrently, the 21-day average of the ISEE index (all equity) closed Friday at 248.9, with Thursday’s 250.2 the highest since early February. Unlike the CBOE equity-only put-to-call ratio, the ISEE index is a call-to-put ratio (hence inverted in Chart 2) and excludes trades from market makers and broker/dealers; as well, it only uses opening long trades. So, from the perspective of sentiment reading, the ISEE index is considered a clean number. Market makers, for instance, need to hedge exposure all the time. Retail traders, on the other hand, bet on direction.
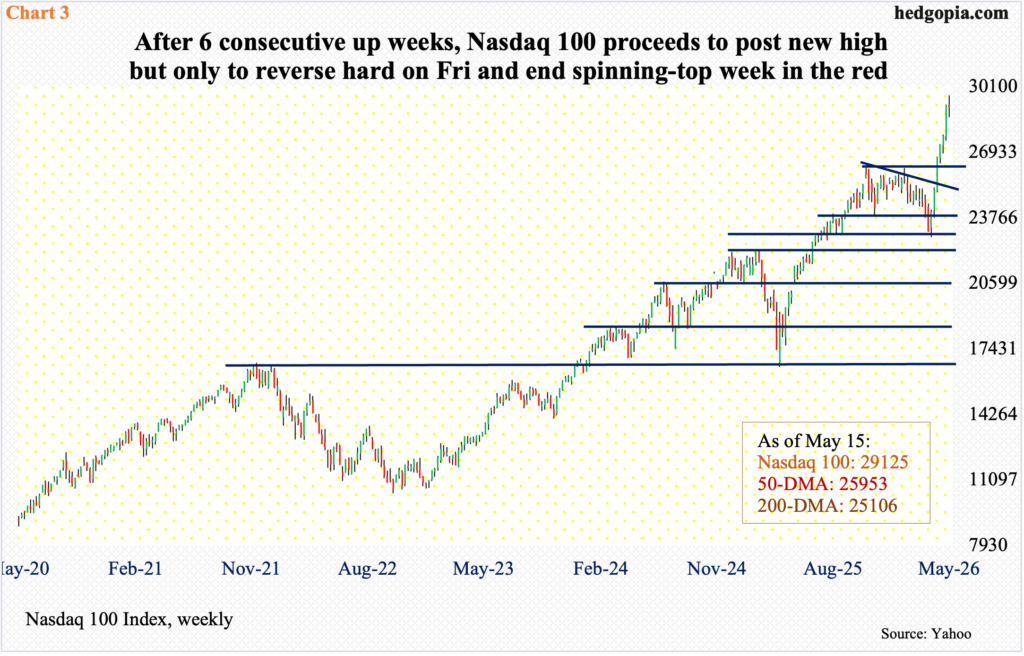
Longs are sitting on tons of gains. The major equity indices bottomed on March 30, before rallying for six consecutive weeks. Until Thursday, tech bulls were on course for making it a streak of seven weeks, as the Nasdaq 100 was up 1.5 percent through Thursday’s fresh intraday high of 29679. But Friday’s selling changed it all, as the tech-heavy index finished the week down 0.4 percent to 29125, for a weekly spinning top. Through Thursday’s high, bulls had amassed gains of 29.9 percent from the March 30 low.
Momentum has been strong, which is reflected in the daily RSI, which hit 84 six sessions ago before coming under pressure, ending last week at 71.01. Similarly, the weekly RSI (73.21) just entered the 70s; in the recent past, anytime this happened, digestion followed.
There is major breakout retest at 26100s (Chart 3).
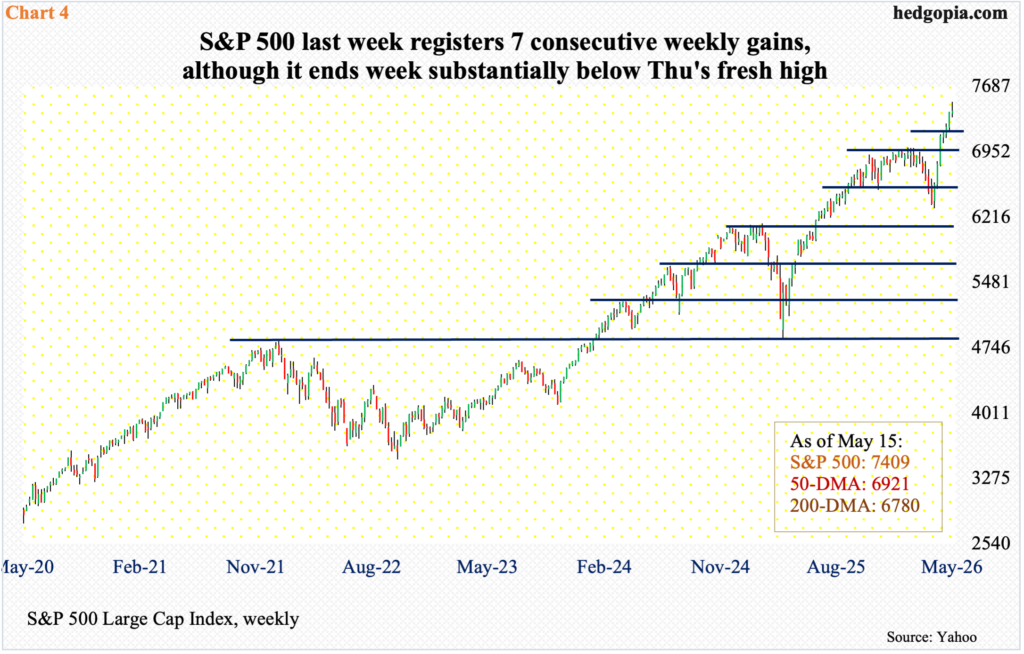
From the point of view of post-March 30 rise, the S&P 500 is not that far behind, racking up gains of 19 percent through last Thursday’s intraday high of 7517 – a record. Through that session high, the large cap index was also up 1.6 percent for the week, but when it was all said and done, it eked out a gain of 0.1 percent to 7409. It has now rallied for seven consecutive weeks, but the way the week came to an end, closing substantially under the weekly high, should encourage the bears.
Momentum, which has been persistently positive for so long, has a lot of unwinding left. The daily RSI, which peaked just south of 80 last Thursday, just fell below 70, and it could be headed for 30 before the overbought condition it is in is unwound.
Before the all-important breakout retest just north of 7000 takes place (Chart 4), there is horizontal support at 7270s, which would also have filled the gap from the 6th, followed by 7140s.
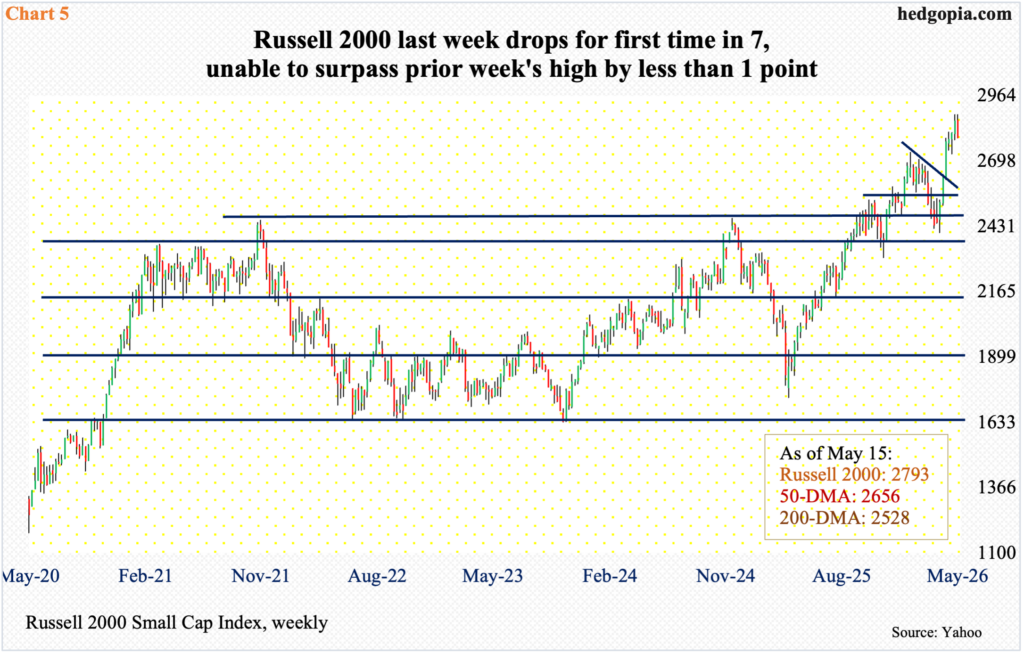
Despite the positive vibes generated by the two large-cap indices mentioned above, the same cannot be said of small-cap performance. From the March 30 low through the intraday high of 2889 posted on the 6th this month, the Russell 2000 rallied 20.1 percent. This is nothing to sneeze at but is hardly massive considering that the small-caps are considered a favorite of risk-on investors.
As a matter of fact, last Monday’s session high 2888 failed to surpass the all-time high posted three sessions before that by only a point. This is unlike the other two large-cap indices that reached fresh highs last Thursday.
Last week, the Russell 2000 suffered its first down week in seven, down 2.4 percent to 2793. This follows bears’ inability in the prior week to cash in on a couple of potentially bearish weekly candles back-to-back – a hanging man and a spinning top (Chart 5). Bears’ eyes are now fixated on 2730s.
On January 27, the Russell 2000 peaked at 2735 – a level that was reclaimed five weeks ago, followed by a successful retest three weeks ago. This level is a make-or-break, and a test looks imminent in the sessions ahead.
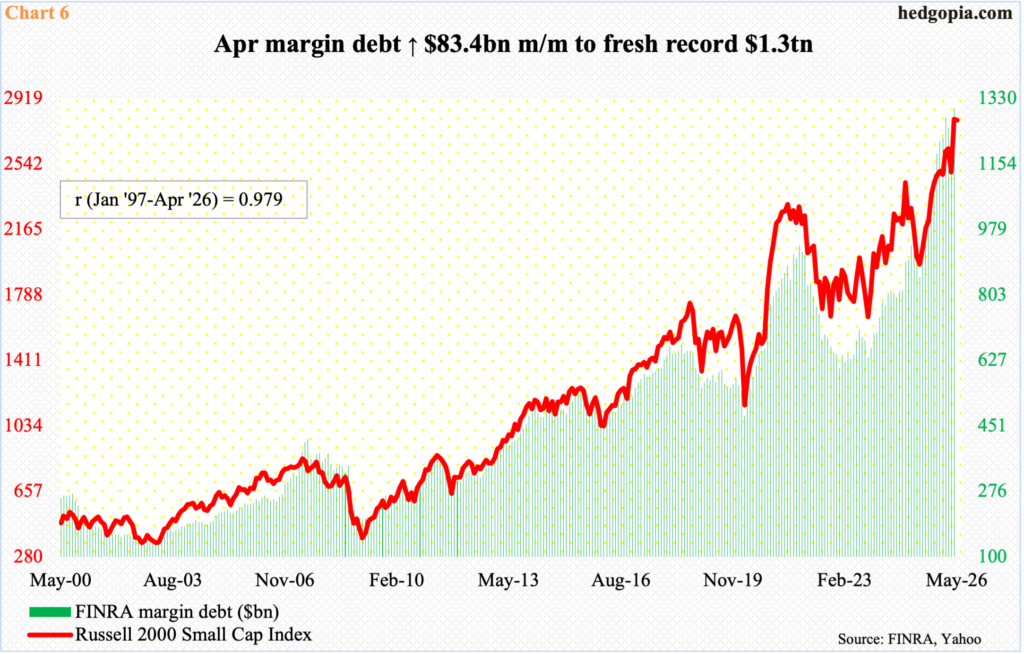
Small-caps’ rather tentative performance of late – relative to large-cap performance – is also taking place at a time when margin debt just posted a fresh high in April. Like the Russell 2000, margin debt, too, is widely viewed as a reliable indicator to measure risk-on – or a lack thereof – at any point in time.
In April, margin debt surged $83.4 billion month over month to $1.3 trillion (Chart 6). It has shot up 53.3 percent from April last year when it bottomed at $850.6 billion; equities, too, bottomed in that very month.
The Russell 2000 tends to have a slightly tighter correlation with margin debt than either the S&P 500 or the Nasdaq 100. With 10 sessions of trading to go this month, the small cap index is down a tad with a monthly shooting star, even as the other two indices are up decently. Hence the significance of 2730s on the Russell 2000; if the support gets breached, and the tight correlation between the index and margin debt stays, the large-cap indices will not remain immune from a drop in margin debt.
Thanks for reading!
