
Major US equity indices rose slightly last week but were unable to hang on to all the gains. Fibonacci resistance is at work.
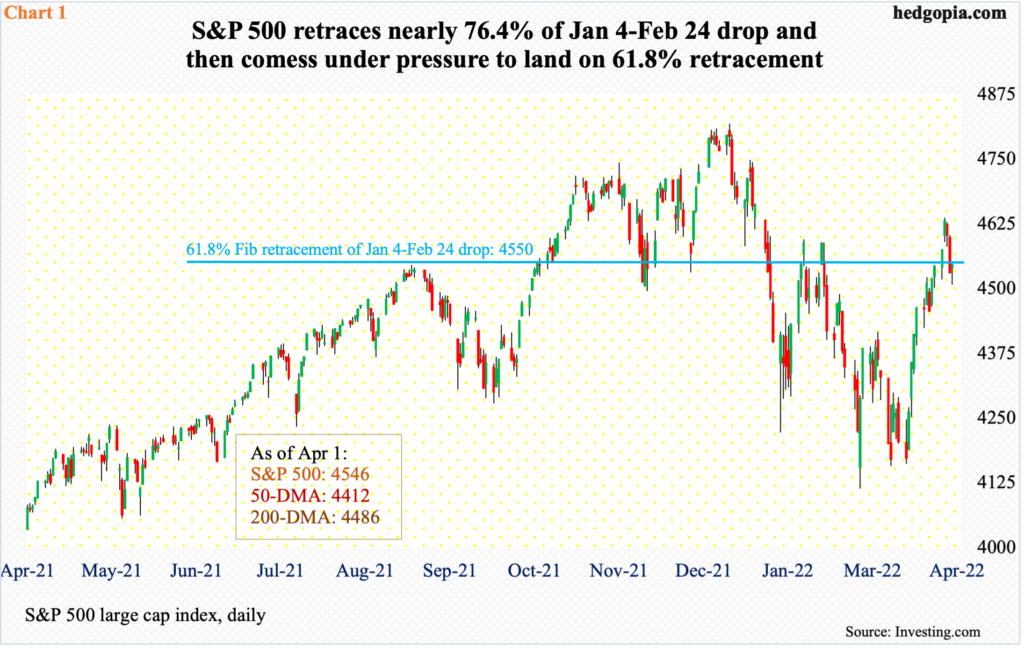
The S&P 500 dropped 14.6 percent between the January 4 high (4819) and the February 24 low (4115). After going sideways around that low, it began to lift off mid-March. In the next three weeks, it rallied viciously, ticking 4637 last Tuesday.
At Tuesday’s high, the large cap index was up 2.1 percent last week, but bulls were unable to cling on to it. By the end of the week, it was only up 0.1 percent, leaving behind a large upper wick on the weekly, closing near dual resistance.
There is horizontal resistance at 4550s going back to last September. This is where a 61.8-percent Fibonacci retracement of the January-February decline lies (Chart 1). At Tuesday’s high, the S&P 500 (4546) was well past this resistance, but the gains were gone by the time the week closed.
The 200-day is at 4486. Last Friday, the index drew bids at 4508, rallying 25 points in the last 15 minutes. Bulls are not going to give up the average that easy. A bull-bear tussle looks probable around here. That said, the daily is extended and likely continues to unwind. The 50-day rests at 4412.
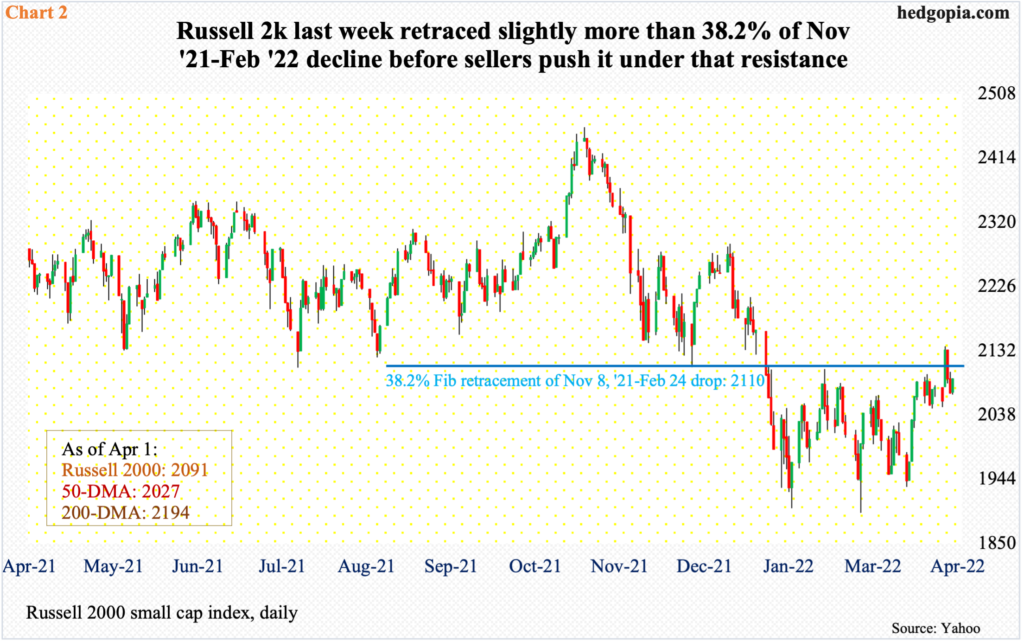
Fibonacci resistance is also working like magic on the Russell 2000. Between its all-time high of 2459 posted on November 8 last year and the low of 1894 tagged on February 24, the small cap index tumbled 23 percent. That low was essentially a defense of a low from late January. A 38.2-percent retracement of that decline lies at 2110.
Last Tuesday and Wednesday, the index rallied to 2130s, with Tuesday ticking 2138, but ended up closing out the week at 2091. When it was all said and done, as was the case with the S&P 500, the Russell 2000 failed to clear the golden ratio resistance. Incidentally, it essentially ended the week at another crucial level.
From last March through January, the small cap index was rangebound between 2350s and 2080s, and between 2280s and 2150s within this box. On Nov 3, it broke out but was quickly followed by a failed retest on the 19th (November). Soon followed a range breakdown in January. At Tuesday’s high last week, the index would have decisively reclaimed the broken range, but that would not be.
Should weakness develop to unwind the overbought daily condition, which is looking likely, there is short-term support at 2050s.
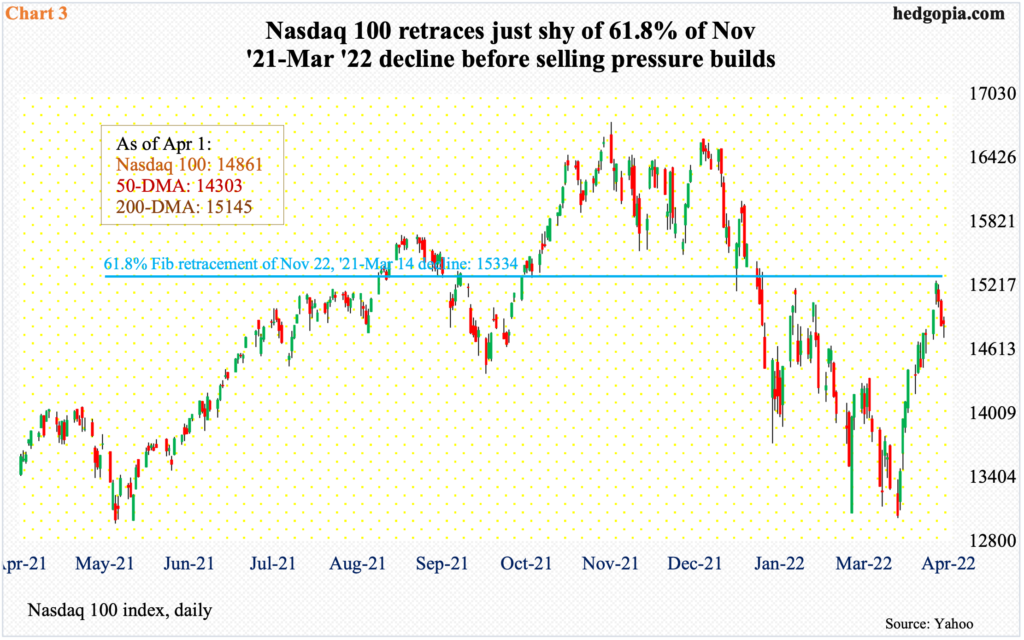
Last but not the least, the Nasdaq 100 last week came up just short of retracing 61.8 percent of the high and low between last November and this March. On Tuesday, the tech-heavy index ticked 15265. The golden ratio of that decline lies at 15334 (Chart 3).
Last week’s high was also a test of the 200-day, which also coincides with horizontal resistance at 15100s, and was rejected. The average was reclaimed on Tuesday but only to be pushed back under it in the very next session. From the March 14 low through Tuesday’s high, the index jumped 17 percent. This preceded a 22.3-percent drop between last November’s record high and last month’s low.
In the end, the triple resistance held last week. At Tuesday’s high, the index was up 3.5 percent but ended the week up only 0.7 percent, producing a weekly shooting star.
There is room for continued move lower. The daily is overbought. The 50-day lies at 14303.
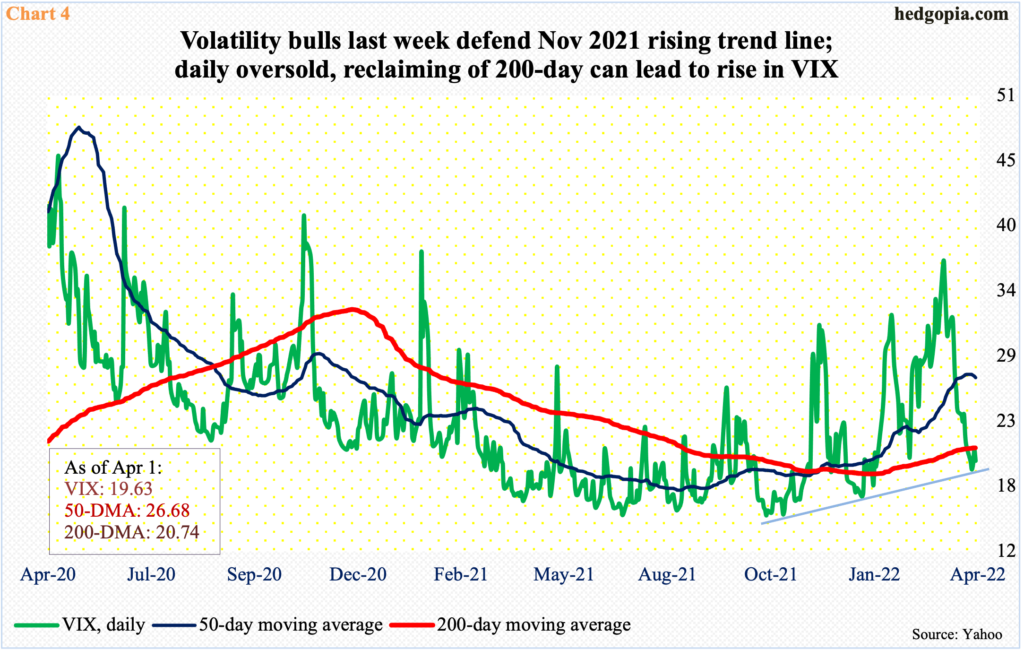
As these indices failed to recapture crucial levels last week, a rising trend line from last November was defended on VIX. On Tuesday, the volatility index touched 18.67, having breached the 200-day in the prior session. As recently as March 8, it tagged 37.52.
The daily is grossly oversold. Last Thursday, VIX tried to recapture the 200-day but was unsuccessful, with Friday closing just underneath it (Chart 4). In the meantime, the 10-day looks to be wanting to at least flatten out. Should things evolve this way, it is just a matter of time before the 200-day is reclaimed and shorter-term averages begin to point up. In this scenario, immediate resistance lies at mid-20s. VIX ended last week at 19.63.
Thanks for reading!
