
VIX is behaving rather erratically, moving in tandem with the S&P 500 the last couple of weeks, perhaps indicating that volatility is likely to subside at least near term – something equities are yet to agree with.
What is it that VIX is trying to say? Many market participants are probably beginning to wonder that as the volatility index is acting in an atypical fashion. Traditionally, VIX and the S&P 500 move in opposite directions. If one goes down, the other goes up, and vice versa. But they have been moving hand in hand for the last couple of weeks – down.
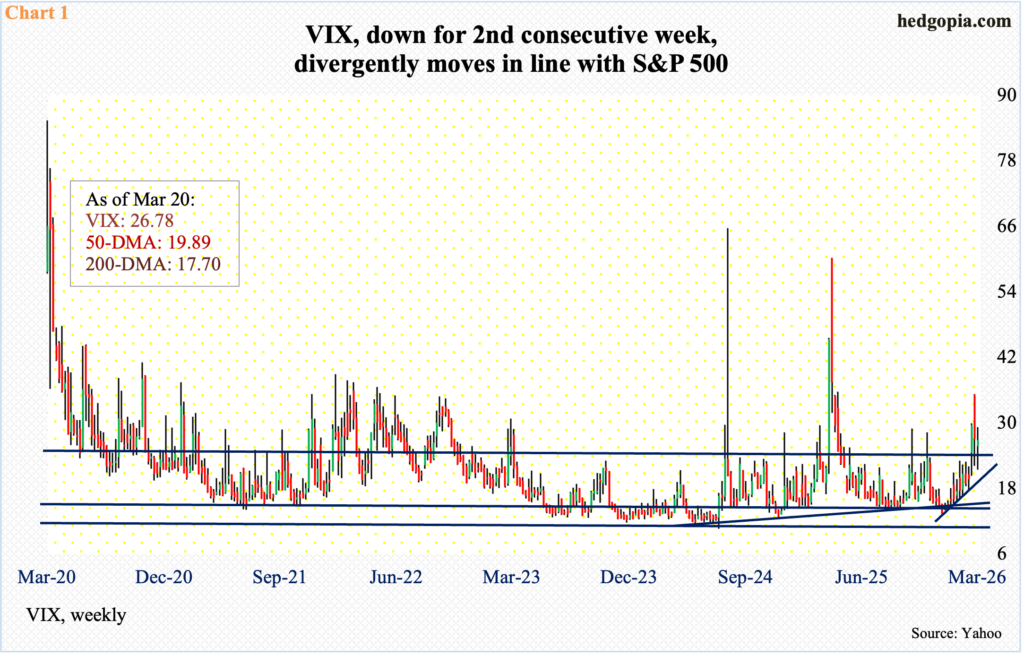
Last week, VIX fell 0.41 points to 26.78. In the week before that, it reversed lower after ticking 35.30 on Monday to close the week down 2.30 points to 27.19. In both, the S&P 500 dropped, down 1.9 percent last week and 1.6 percent before that.
If past is prelude, VIX’s spike reversal two weeks ago can lead to more downward pressure in the sessions ahead. On the weekly, the RSI just turned lower after kissing 70. If this scenario comes to fruition, a rising trendline from Christmas Eve when VIX ticked 13.38 intraday gets tested just north of 19 (Chart 1).
With all that said, mid- to long-term, VIX’s monthly indicators act as if volatility can go a lot higher in the right circumstances.
Arguably, VIX’s latest behavior can be interpreted as a sign that it is signaling an easing of tensions in the Iran conflict. This, however, is not how equities are viewing things.
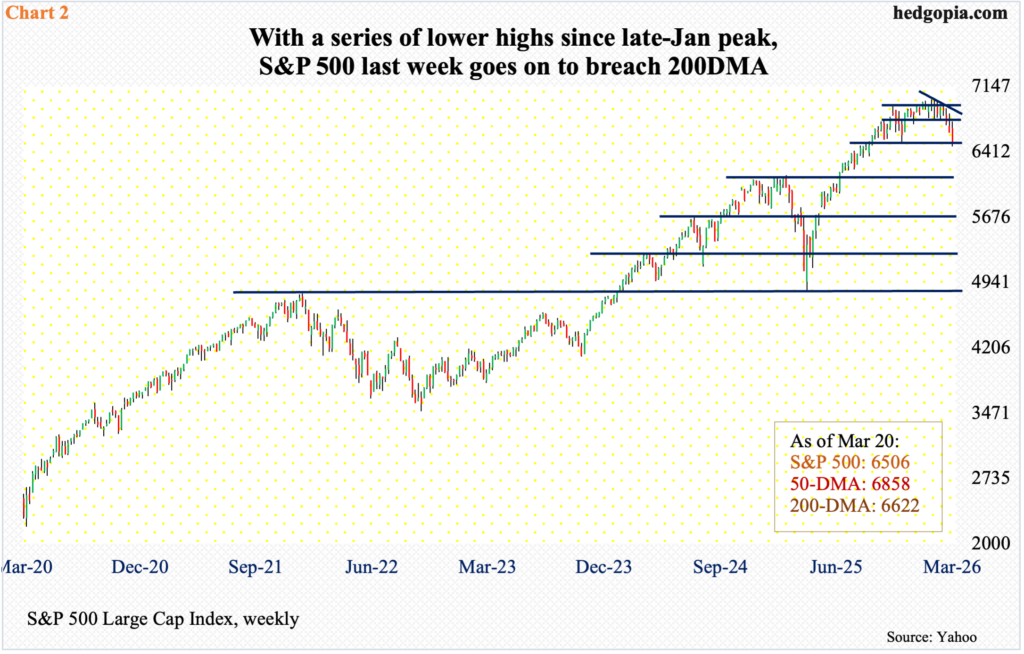
Last week, sellers pounced on an opportunity to go short/sell as early as Tuesday, when the S&P 500 ticked 6754 intraday; through that high, the large cap index, in fact, was up 1.8 percent for the week. Straight-line resistance at 6770s goes back five months, and sellers showed up there in droves (Chart 2). By Friday, all those gains were given back and then some, closing the week at 6506. In the process, the 200-day moving average (6622) was breached by Thursday.
The index has now been down four weeks in a row. As a matter of fact, since it posted a new all-time high 7002 on 28 January, there has only been one up week in seven. Not surprisingly, most indicators currently are oversold, with the daily RSI closing just under 30. This opens up probabilities for a relief rally – irrespective of duration and magnitude. For this, things in Iran should at least not get worse. In the event selling continues, there is horizontal support at 6420s.
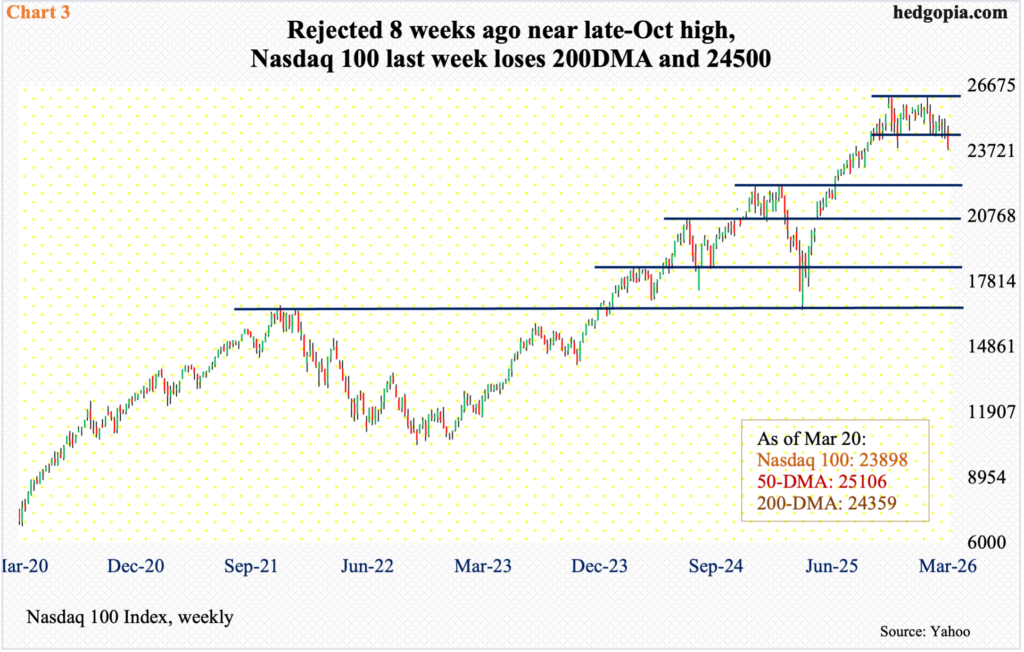
Things have evolved similarly on the Nasdaq 100 in recent weeks. Last week, both the 200-day (24359) and lateral support at 24500 were breached. Before this, the tech-heavy index hovered just above the average starting early this month.
Even before that, the index reached an intraday all-time high 26182 on 29 October. On 28 January, it then came within 17 points of that high before facing rejection; including the week in which that rejection took place, the Nasdaq 100 has been down in seven of eight weeks. Last week, it dropped two percent to 23898 (Chart 3).
Assuming tensions in Iran do not abate, the next level of support lies around 23000, followed by crucial horizontal support at 22100s.
Margin debt is worth watching at this point.
In February, the Nasdaq 100 dropped 2.3 percent and the S&P 500 0.9 percent. Both these indices suffered the decline after consolidation lasting several months. Earlier, from last April’s bottom through their highs reached last October and this January, they respectively surged 58.3 percent and 44.8 percent.
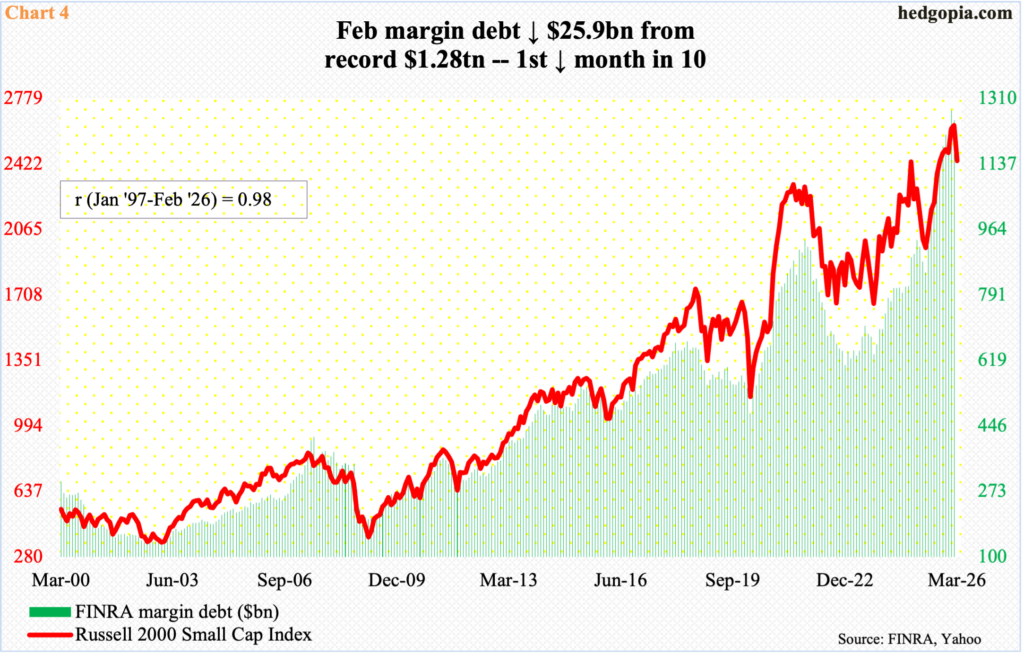
FINRA margin debt, too, bottomed last April – at $850.6 billion – before rising every month for nine successive months to reach $1.28 trillion in January. Leverage obviously played a big role in pushing equities higher. Then came February when margin debt dropped $25.9 billion to $1.25 trillion (Chart 4). The question now becomes if this is a one-off or the beginning of a sustained move lower.
Mid- to long-term, as is the case with the major equity indices, margin debt has a lot of room to unwind lower. With seven trading sessions to go this month, the Nasdaq 100 is down 4.3 percent and the S&P 500 5.4 percent. Ordinarily, this should be enough to trigger some level of margin call. March’s margin debt data will be telling.
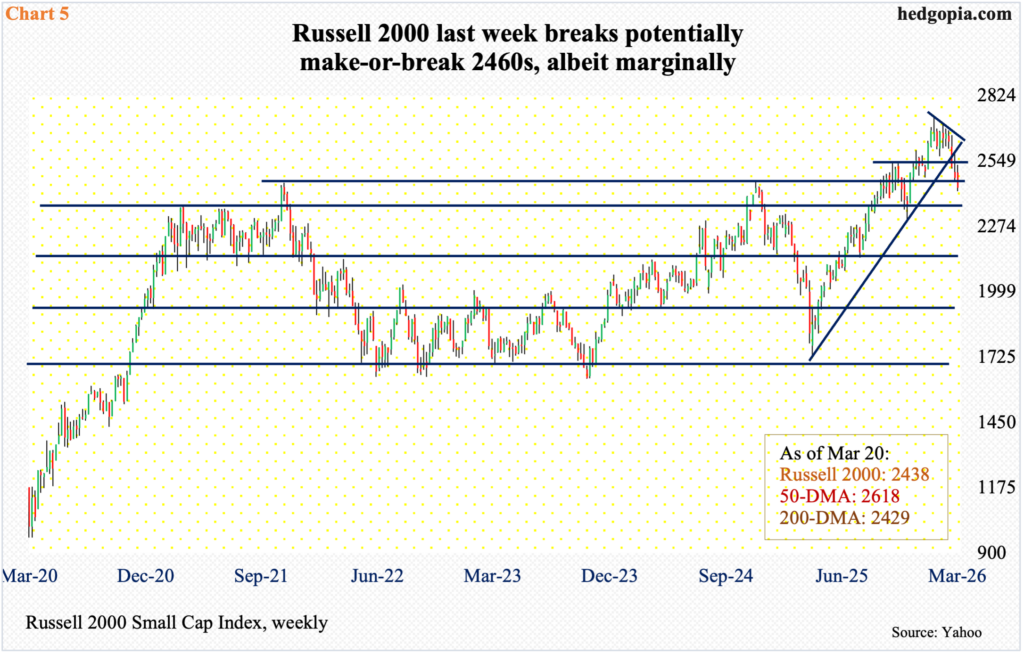
With a coefficient correlation of 0.98 going back to January 1997, the Russell 2000 has a tight relationship with margin debt. Interestingly, the small cap index did not go down in February, as it was up 0.7 percent. March, down 7.4 percent, is probably catching up to margin debt’s drop in February. The Russell 2000 just broke some crucial support. If things do not stabilize soon, more pain could lie ahead as more leverage comes out of the system.
Although – unlike the S&P 500 and Nasdaq 100 – the Russell 2000 has not lost the 200-day (2429), but it is perilously close to it. Last week, the index fell 1.7 percent to 2438, with Friday’s session low 2423. In the process, it has failed breakout retest at 2460s (Chart 5). Three weeks ago, small-cap bulls failed to defend breakout retest at 2540s.
A decisive breach of 2460s – not there yet – will be significant because in November 2024 the Russell 2000 retreated after ticking 2466. Three years before that, in November 2021, it rose to 2459 and then went the other way. Last September, those highs were surpassed, but not before a stretched bull-bear tug of war followed around those highs.
Failure to hold on to the 200-day will make the index vulnerable to a drop toward 2300.
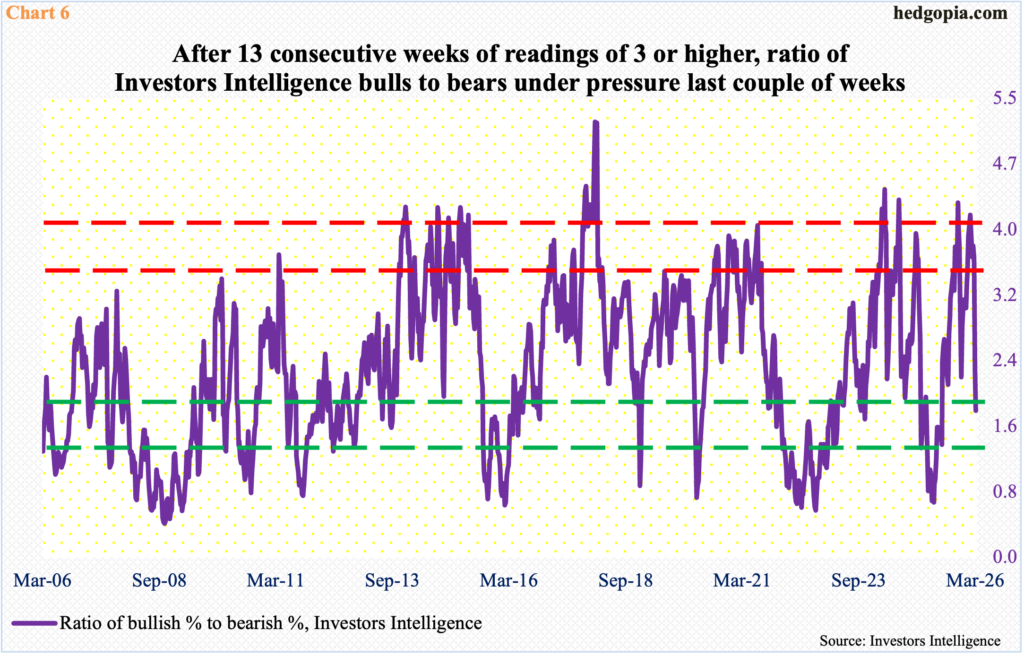
Amidst all this, bears are making a comeback, even as bulls are taking a backseat. This is reflected in the ratio of Investors Intelligence bullish percent to bearish percent, coming in at 1.8 in the week to last Tuesday, following 2.3 in the week before. This was the first time the ratio went sub-three after 13 consecutive weeks of readings of three or higher, with one reading of four-plus in the week to 3 February.
This has pushed the ratio into oversold territory (Chart 6). That said, the bull-bear ratio has taken a hit, but at least going by history, this is by no means a washout, which would be should the equity indices mentioned above proceed to unwind the monthly overbought condition they are in. That does not preclude a relief rally in the near term should Iran tensions cooperate.
Thanks for reading!
