
August for the most part saw bulls buy support and bears sell resistance. This worked out pretty well for both camps. In essence, after a late-July/early-August brief selloff, both put their foot down. Last week, major US equity indices rallied in the two to three percent range, even as sellers once again showed up Friday at/near the top of the range.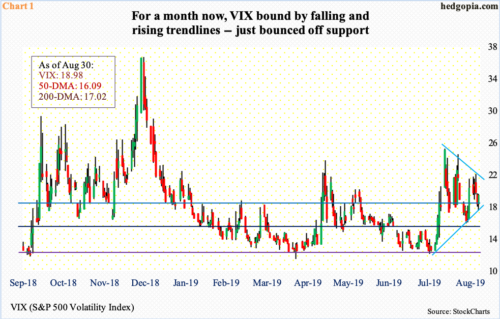
On August 5, VIX (18.98) peaked at 24.81, followed by a series of lower highs. Before that, on July 25, it dropped to 11.69, before successively making higher lows. The volatility index is essentially trapped between these two trend lines (Chart 1).
Either way it breaks, momentum is likely to follow suit in that direction – at least near term. Last Friday’s low of 17.09 not only successfully tested the trend line in question but also the 200-day moving average (17.02). The average is flattish, while the 50-day (16.09) is slightly rising. If volatility bulls continue to defend trend-line support, a golden cross could form sooner than later.
For now, VIX’s path of least resistance is a test of trend-line resistance around 21.25.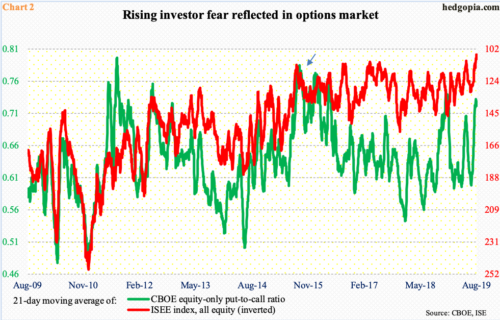
This scenario runs in contrast with what a couple of other options-related metrics are signaling.
The 21-day moving average of the CBOE equity-only put-to-call ratio and the ISEE index, all equity, are plotted in Chart 2. The latter is a call-to-put ratio, hence inverted. Investor fear is reflected when the green line is rising and the red line falling.
Currently, the red line is almost panicky, with last Friday’s 105.9 at an all-time low. The green line is not as panicky but remains quite elevated. It recently peaked on August 23 at 0.733, with last Friday at 0.722. If past is prologue, it tends to unwind from high-0.60s to low-0.70s. On Christmas Eve last year, it peaked at 0.744. As this got unwound, the S&P 500 large cap index, among others, witnessed a massive rally after bottoming late December.
That said, the green line was higher in 2015 and 2016 (arrow). So, it is always possible it continues to move up. Even in this scenario, unwinding will have to begin at some point. It is just a matter of if it has already begun to unwind or will do so from a higher level.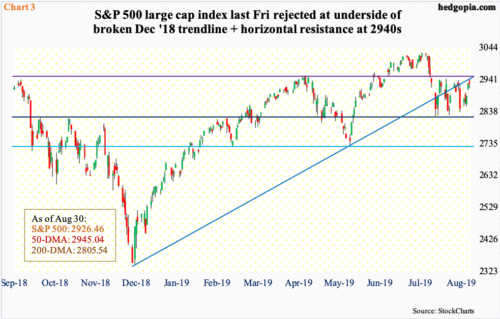
Depending on how things unfold in Chart 2 will/can have a bearing on how Charts 3 and 4 evolve. Like VIX, they, too, have played ping pong since early August.
On July 26, the S&P 500 (2926.46) peaked intraday at 3027.98. By August 5, it was down to 2822.12. Horizontal support just north of 2800 goes back to March last year. That is exactly where bulls showed up to take advantage of the rather-sharp, one-week selloff. Since that low, the index has made higher lows. But at the same time, rally attempts have consistently been denied at the 50-day (2945.04), which also approximates horizontal resistance at 2940s-50s. Last Friday, the index retreated intraday after tagging 2940.43; the session high also kissed the underside of a broken trend line from last December (Chart 3). This is an opportunity for bears to get active.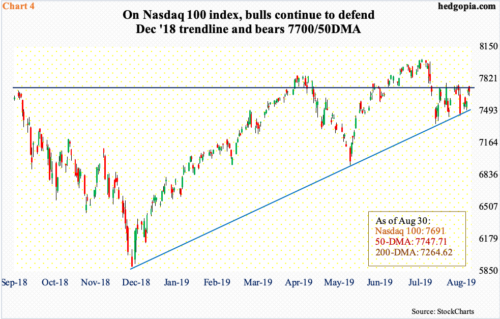
Over on the Nasdaq 100 index, things are playing out in a similar fashion.
As did the S&P 500, the Nasdaq 100 (7691) peaked on July 26 at 8027.18 and bottomed on August 5 at 7356.27. That low was a successful test of trend-line support from last December. This was four weeks ago. In the subsequent three weeks, bulls defended that support every week.
Bears have not been slouching either. They have persistently showed up at resistance. The 50-day currently rests at 7747.71 and has acted as a roadblock for over three weeks now, including last Friday when the index pulled back after tagging 7747.08. Plus, there is one-year horizontal resistance at 7700.
One look at Chart 4 and it is apparent a make-or-break moment will soon be upon us. Either bulls will succeed in pushing through that resistance or will lose that trend-line support. As things stand, they were just rejected at resistance, so bears may have a slight edge right here and now.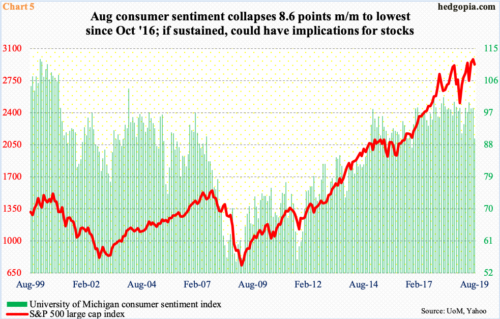
Amidst all this, a new dynamic probably got thrown into the mix last Friday.
August’s final reading of the University of Michigan’s consumer sentiment index came in at 89.8, down 8.6 points month-over-month. This was the largest m/m decline since December 2012 and the lowest reading since October 2016.
For reference, Donald Trump was elected president in November 2016, when sentiment jumped 6.6 points m/m to 93.8. Since then, this metric has persistently remained in the 90s or 100s. Since October 2017, there have been four readings of 100 or higher, including 101.4 in March last year which was the highest since January 2004. That streak ended last month. Historically, sentiment is still very healthy, but it is the trend that counts.
The S&P 500 shed 1.8 percent in August; in fact, at the lows the index was down as much as 5.3 percent. The drop to 2800-plus was used as an opportunity to buy. Hence the significance of green bars in Chart 5. If consumer sentiment continues to weaken, odds are it will end up dragging stocks lower. At least that is how things evolved in the past.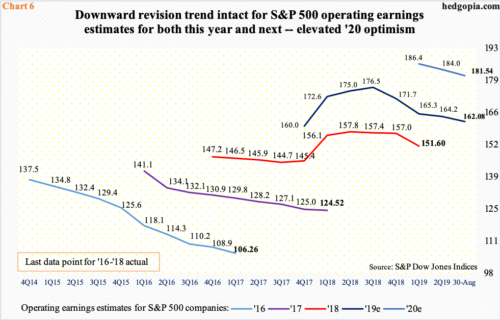
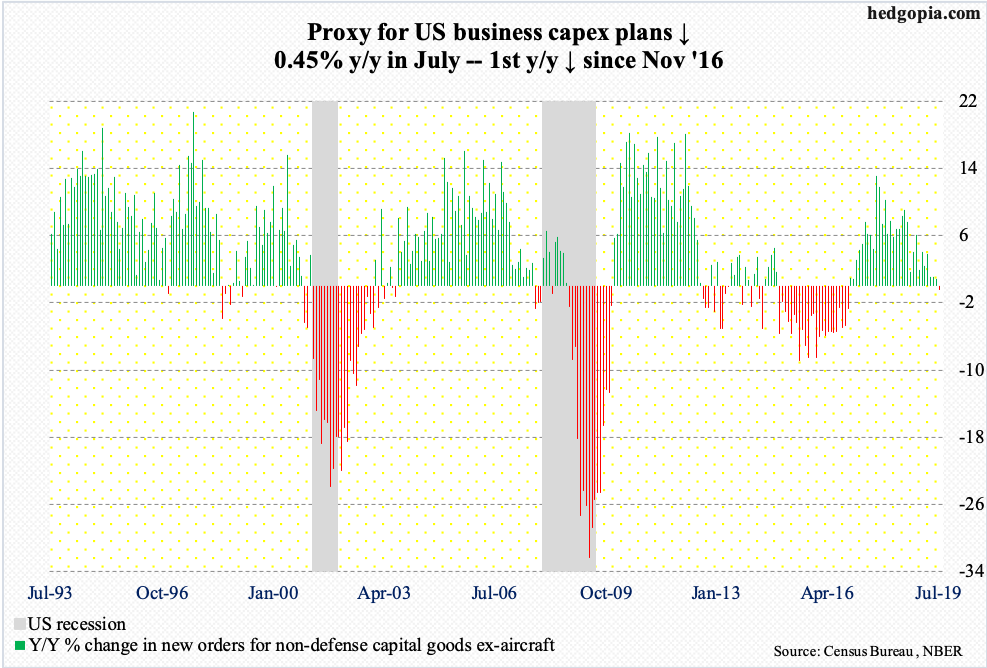
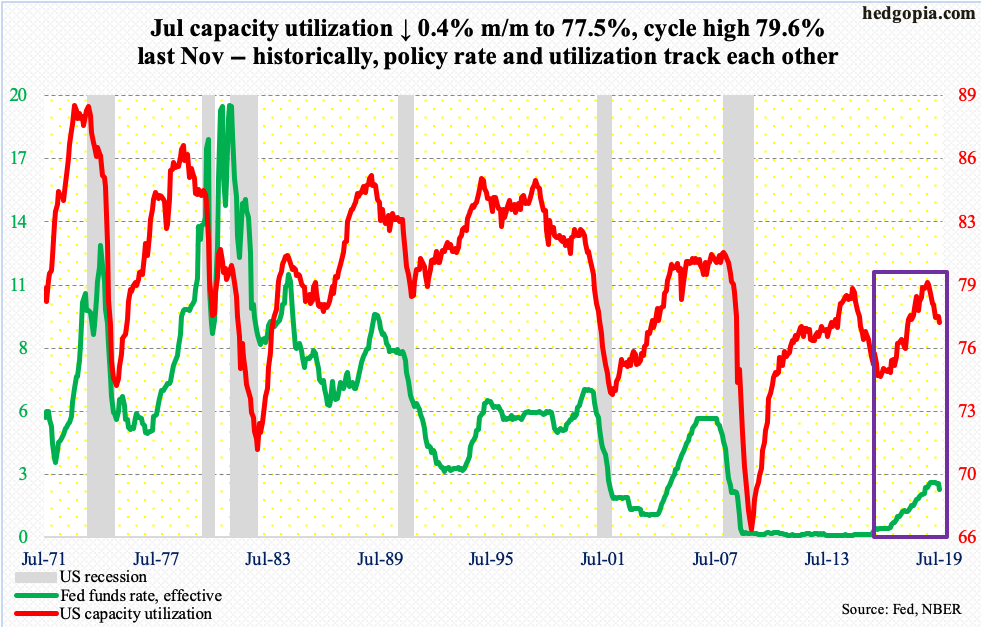
Consumer sentiment downshifted in August at a time when the US economy itself is operating at a lower gear. Real GDP grew at a two percent annual rate in 2Q19, down from 3.1 percent in 1Q19. In the 12 months to July, orders for non-defense capital goods ex-aircraft – proxy for business capex plans – dropped 0.45 percent to a seasonally adjusted annual rate of $69.7 billion. This was the first year-over-year drop since November 2016. Capacity utilization fell 1.6 percent y/y in July to 77.5 percent. The cycle high 79.6 percent was hit last November. The jobs market is relatively still healthy, but even here the pace is decelerating, with a monthly average this year of 165,000 non-farm jobs versus last year’s monthly average of 223,000.
In this scenario, it is difficult to embrace the prevailing sell-side earnings optimism.
Next year, S&P 500 operating earnings are expected to grow 12 percent. This would represent quite an acceleration from this year’s expected 6.9-percent growth. In 2018, earnings shot up 21.7 percent and 17.2 percent before that in 2017.
Interestingly, at one point in time, the sell-side had penciled in huge expectations for 2019 as well. In August last year, $177.13 was expected for this year. With two more quarters to go, this has now been cut down to $162.08. Estimates for next year similarly started out very optimistic – $186.36 in March this year versus the current $181.54. Even with this revision downward, 2020 estimates probably remain way optimistic. A lot of things need to go right for this to come true – not a given at this stage in the economic/earnings cycle.
To that end, if the aforementioned support at 2800-plus is breached on the S&P 500 (Chart 3), that might be a first sign the majority is beginning to seriously doubt next year’s estimates. Hence its significance. Bulls defended that support throughout August. Odds favor it gets tested again, and soon.
Thanks for reading!
