
The 2Q earnings season begins next week in earnest. The bar is low. Ahead of this, large-caps are leading but economically-sensitive small-caps are lagging. The latter likely is eyeing the 500-basis-point rise in the fed funds rate since March last year – and more on the way – and its imminent negative impact on the economy.
The 2Q earnings season is upon us. Financials will begin reporting in the week after. Ahead of this, the bar customarily is low – or lower than just a few weeks or a few months ago.
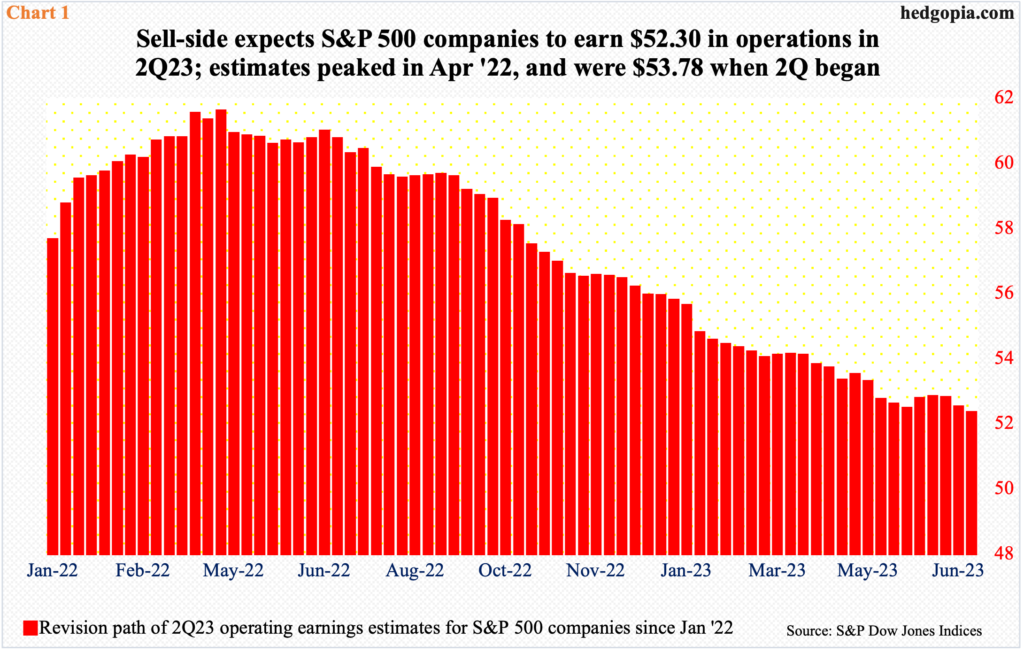
S&P 500 companies are expected to ring up $52.30 in operations in the June quarter. The sell-side was expecting $53.78 when the quarter began. In fact, they have been revising the numbers lower ever since the estimates peaked in April last year at $61.56 (Chart 1).
In the corresponding quarter last year, these companies brought home $46.87. This will be the second quarter in a row earnings would have grown year-over-year. Before this, they declined three quarters in succession.
Leading up to this, equity bulls have spring in their feet.
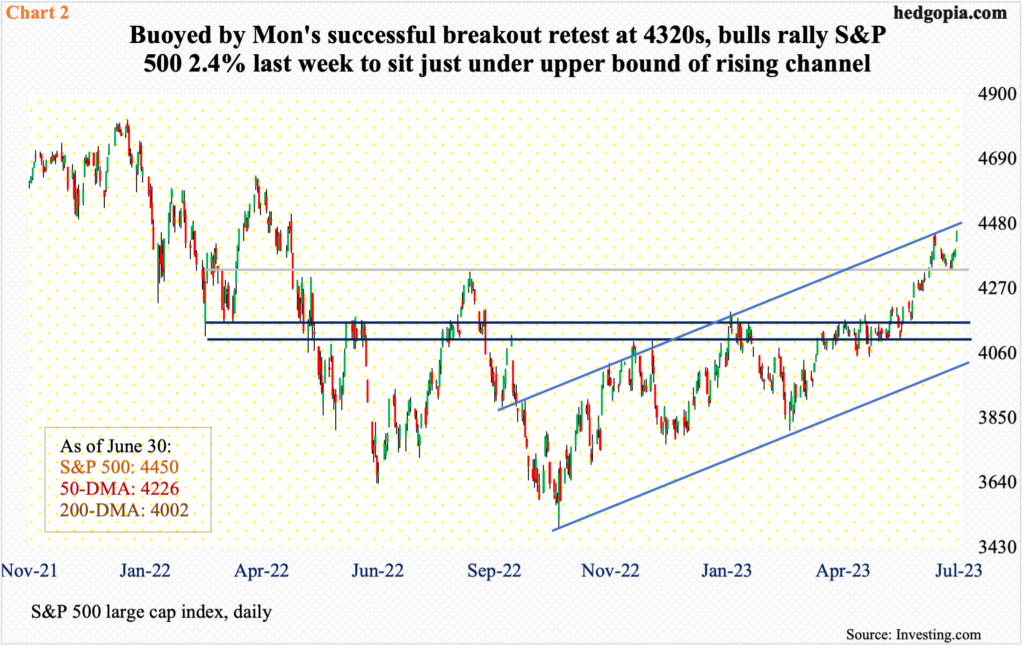
The S&P 500 rallied 2.4 percent last week to 4450; a successful defense of breakout retest at 4320s early in the week emboldened the bulls.
The large cap index retreated after tagging 4448 on June 16. Through last Monday’s low, it was down 2.7 percent from that high, ticking 4328 intraday. This price point has a lot of memory attached to it, as the index reversed sharply lower after touching 4325 last August, dropping all the way to bottom at 3492 by October. It was not until June 12 the August high was reclaimed, which was then followed by a successful retest last week.
The June 16th pullback began as the S&P 500 tested the upper bound of an ascending channel from last October’s low. After last week’s move higher, this resistance is being tested again (Chart 2).
Earnings, therefore, could play a role here.
In the event of a channel breakout, non-commercial futures traders could come under pressure to continue reducing their holdings of net shorts in e-mini S&P 500 futures (more on this here).
Small-caps, however, have a different story than that of large-caps.
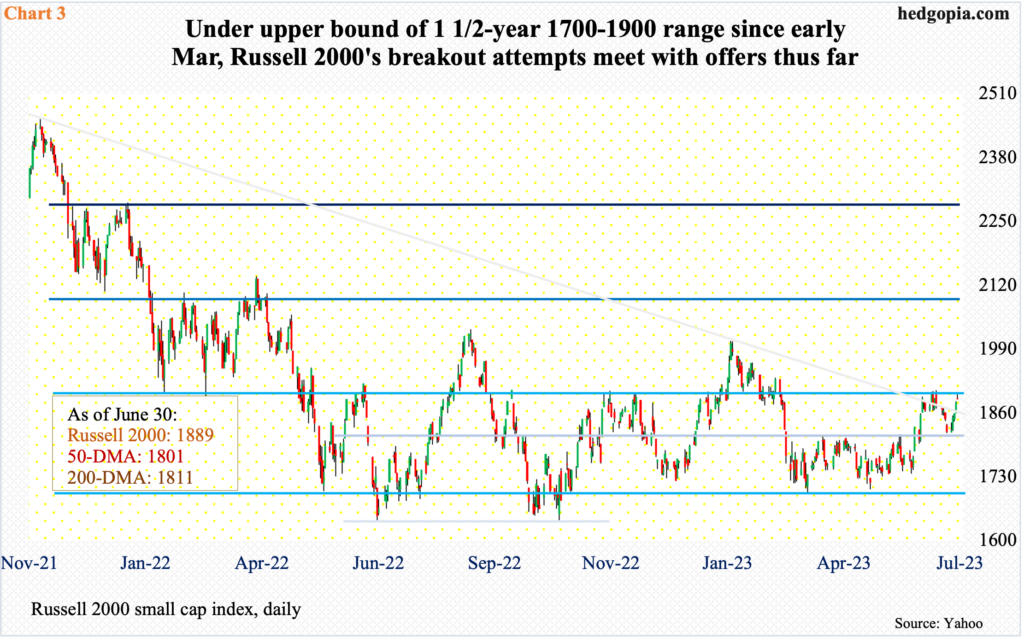
The Russell 2000 continues to remain rangebound between 1700 and 1900. This range has been in place since January last year, with support at 1700 going all the way back to August 2018.
Small-cap bulls lost 1900 in early March this year. Since then, the level had not been tested until the middle of June when between the 13th and 16th, the small cap index crossed 1900 intraday in three sessions but only to close back below by close. A subsequent drop to the middle of the range – 1800 – gave the bulls an opportunity to regroup and launch another attack at that ceiling. Intraday last Friday, 1898 drew offers, but a weekly close of 1889 keeps the index in the neighborhood.
Bulls can take solace in the fact that a falling trendline from November 2021 when the Russell 2000 peaked at 2459 has been reclaimed (Chart 3). They obviously hope this precedes a range breakout. Until that occurs, large-caps’ optimistic message will not have been seconded by small-caps.
For whatever it is worth, as is the case with large-caps, the earnings hurdle is low for small-caps. S&P 600 companies are expected to earn $19.19 in operations in the June quarter; when the quarter began, the sell-side had penciled in $20.44 – and $27.62 in February last year.

Small-caps’ struggle at the multi-month range resistance comes at a time when, despite the Federal Reserve-engineered 500-basis-point increase in the fed funds rate since March last year, the economy continues to chug along. Manufacturing is weak, but this is countered by a strong job market and healthy consumer spending.
In the first quarter, real GDP grew at an annualized rate of two percent. This followed growth of 2.6 percent in 4Q22 and 3.2 percent in the quarter before that, so this suggests deceleration (Chart 4). At the same time, 1Q growth was revised higher from the second print of 1.3 percent. Several housing-related metrics bottomed early this year, and this is having a positive impact on the economy.
Yet, the Russell 2000, which inherently has more domestic exposure than its large-cap brethren, which also has foreign exposure, cannot break out.
It seems the Russell 2000 is focused more on when the interest rate hikes might begin to bite.
In March last year, the fed funds rate lied between zero and 25 basis points. By the May (2023) meeting, this was raised to a range of 500 basis points to 525 basis points. The central bank is not done, as inflation is proving to be sticky.
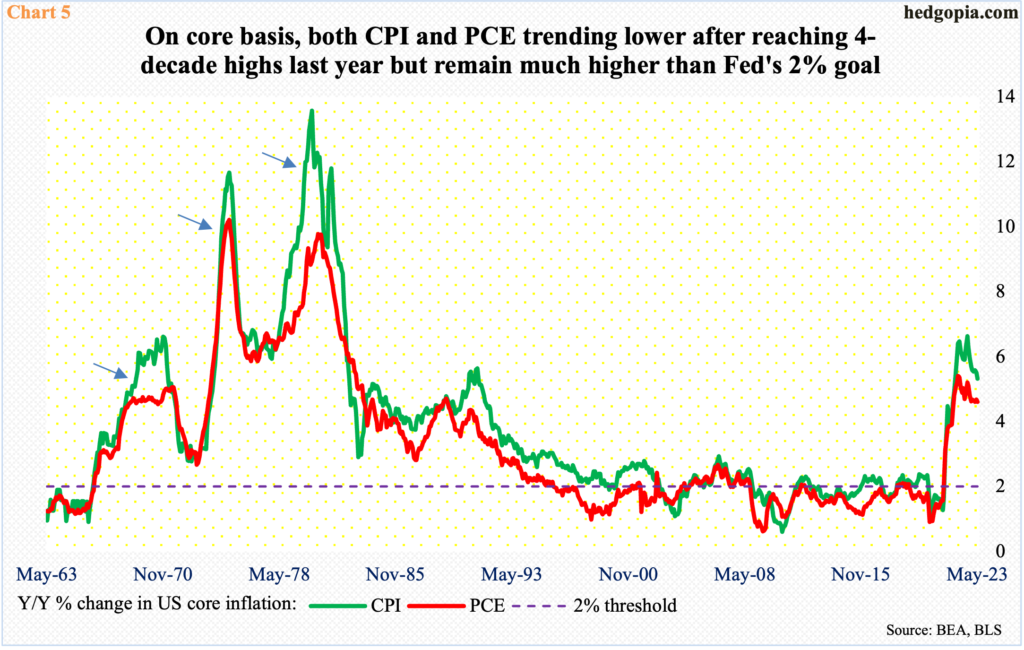
In the 12 months to May, core PCE (personal consumption expenditures) and CPI (consumer price index) respectively grew 4.6 percent and 5.3 percent, down from last year’s four-decade highs of 5.4 percent (February) and 6.6 percent (September) but much higher than the Fed’s goal of two percent (Chart 5).
The dot plot released at the June FOMC meeting had members overwhelmingly favor two additional 25-basis-point hikes by December. Last Thursday, Chair Jerome Powell said a strong majority of policymakers expect two or more rate hikes by year end, adding that consecutive rate hikes are not off the table.
In fact, it is not just the Fed that is sounding resolutely hawkish. The Bank of England’s unexpected 50-basis-point hike on June 22 to five percent highlights central bankers’ increasing frustration with inflation that is increasingly proving sticky; in the same week, Norges Bank, Norway’s central bank, raised its key policy rate by higher-than-expected 50 basis points to 3.75 percent. Before that, on the 6th and 7th last month, the Reserve Bank of Australia and the Bank of Canada both surprised with a 25-basis-point increase in their benchmark rates.
Increasingly, it feels like central bankers see a substantial reduction in output as the only way to bring inflation back down to desired levels.
If this is what the stuck-in-the-rut Russell 2000 is trying to convey, then it is also a matter of time before the leading large caps join the lagging small-caps.
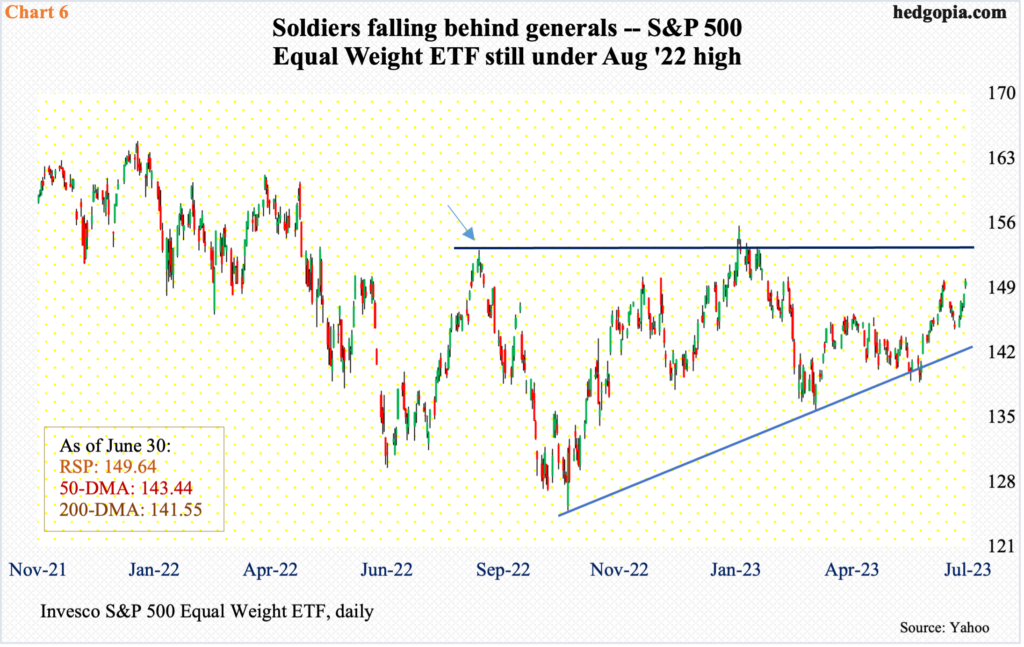
As a matter of fact, within the S&P 500 itself, the large cap index is leading, but the equal-weights are lagging. In other orders, the hundreds of soldiers are not keeping pace with the handful of generals.
As previously mentioned, the large cap index reclaimed last August’s high on June 12, with a successful breakout retest last Monday. RSP (Invesco S&P 500 Equal Weight ETF), however, has not even tested its August high (arrow in Chart 6), with a rejection in February.
Thanks for reading!
