
Major US equity indices took a beating last week, but, thanks to Friday’s reversal, they closed substantially off their lows, defending crucial support and the 50-day. Concurrently, VIX suffered a spike reversal. It is equity bulls’ ball to lose near term.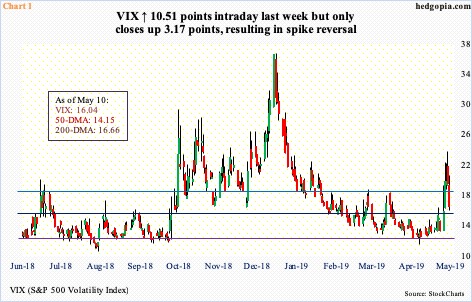
Several times in the past, after a spike reversal, VIX has tended to subside. Last week, volatility began rising as soon as it began. By Thursday, VIX shot up 10.51 points intraday to 23.38, but it was not able to hang on to the gains; the session closed at 19.10. Friday, volatility bulls’ initial attempt to rally again failed as the index dropped another 3.06 points to 16.04. In the end, VIX only rose 3.17 points for the week, producing a candle with a long wick.
The daily is in overbought territory and can continue lower. After remaining above the 200-day for three sessions, VIX was pushed back below the average on Friday. The 50-day, which is attempting to turn up, is at 14.15. In the right circumstances for volatility bears – and equity bulls – a test of the average is possible near term. For weeks prior to last week’s spike, VIX clung on to 12-13 on the low end (Chart 1).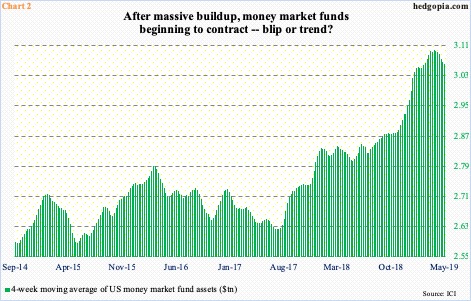
If volatility indeed recedes and equities rally near term, the key question is if US money-market funds lend a helping hand in this.
As of last Wednesday, these funds were sitting on $3.08 trillion. Early October last year, when stocks began to drop, they held $2.87 trillion. As the selloff picked up momentum, money continued to move into these funds, and did not stop even when stocks bottomed late December. By early March, they had grown to be $3.11 trillion. Since that high, assets fell by $70 billion in the next six weeks, igniting equity bulls’ hopes that a trend had begun and that this would provide a sustained tailwind to stocks. Things did not quite turn out that way. Since the mid-April low, these assets have gone up by $41 billion.
Should the upward trend in these assets in the past three weeks not reverse, it is just a matter of time before the recent downward trend seen in Chart 2, which uses a four-week average, swings back up.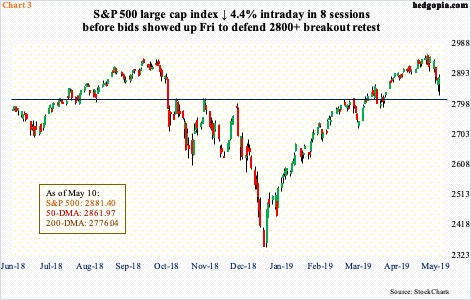
In this scenario, it will be difficult for indices to sustainably build on last Friday’s reversal. On the S&P 500 large cap index, the reversal took place at an important level. Since March last year, 2800-plus has proven to be an important price point where bulls and bears fought several times. The most recent was March this year. Bulls won that duel. Subsequently, the index went on to post a new all-time high of 2954.13 on May 1, before coming under pressure. In the next seven sessions through last Friday, the S&P 500 dropped 4.4 percent. It should be emphasized that this was intraday; by close, the index had reversed from an earlier 1.6-percent decline to a 0.4-percent gain. The reversal took place right above the afore-mentioned support-turned-resistance-turned support (Chart 3).
Since the March breakout, this was a first retest, and it only made sense that it held. Also, right around there lied the 50-day (2861.97). The index (2881.40) has remained above the average since mid-January this year. Bulls were not going to just wilt and give away this dual support without a fight. Immediately ahead, there is resistance at 2915-2920. Medium term, the weekly remains overbought.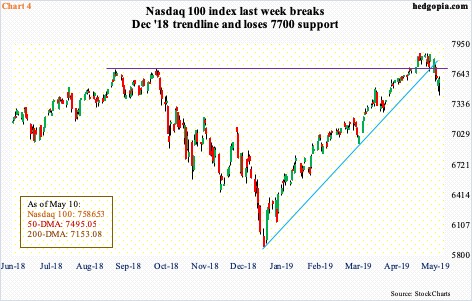
This is also the case with the Nasdaq 100 index. Last week, it shed 3.3 percent. But intraday Friday, it was down as much as 5.3 percent. The good thing, from bulls’ perspective, is that bulls stepped up to defend the 50-day both Thursday and Friday. Bears at the same time will take solace in the fact that they managed to push the index below both a rising trend line from late December and horizontal support at 7700 (Chart 4). The latter is where sellers might show up on the next rally. For now, last Friday’s reversal puts the ball in bulls’ court. Time will tell if they can build on it.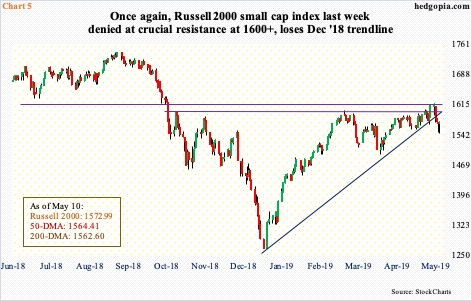
The Russell 2000 small cap index similarly is at an interesting juncture. Small-cap bulls had an excellent opportunity last week, but they could not quite deliver.
Six sessions ago, the index closed right at resistance just north of 1600. This ceiling goes back to January last year, and once again it proved tough to crack. By last Friday, the Russell 2000 fell to 1546.14 intraday but only to reverse hard. Thursday, too, saw a strong intraday reversal. Both those sessions produced inverted hammers (Chart 5). But it is equally possible they turn out to be hanging man. Time will tell. If it is the latter, weekly overbought conditions should continue to unwind. But even under this scenario, the Russell 2000 (1572.99) can once again go and test the afore-mentioned resistance just north of 1600.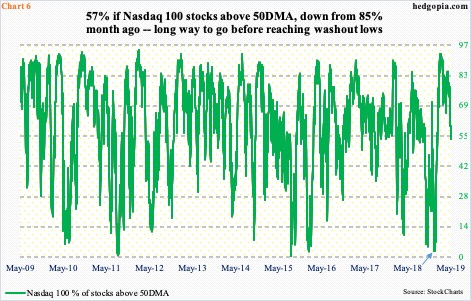
Hence the need to watch how things transpire on the nearest – and afore-mentioned – resistance on all these three indices. Weekly overbought momentum indicators have already begun to unwind, and can continue lower, should bulls not succeed in making the most out of last Friday’s reversal.
The percent of Nasdaq 100 stocks above their 50-day serves a good example in this regard. As of last Friday, this stood at 57 percent. Mid-February, the metric began to retreat from 93 percent, even as the index continued higher, suggesting large-caps were doing all the heavy lifting. Most recently, a month ago, the green line in Chart 6 began to recede from 85 percent; the index began catching up last week.
As the chart shows, the metric goes back and forth between overbought and oversold. The current reading is smack in the middle of the range. Late December last year, when the Nasdaq 100 was bottoming out, only three percent of its constituents were above the 50-day (arrow). Regardless what happens near term, medium-term momentum is to the downside.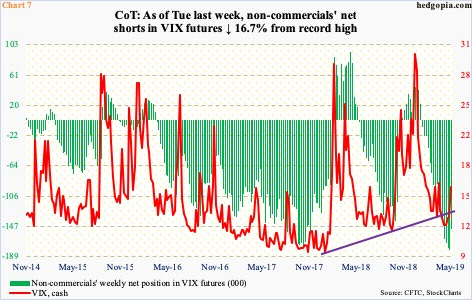
There is a similar medium-term risk brewing for equity bulls in the futures market.
Until a week ago, non-commercials were net short record 180,359 contracts in VIX futures. Last week (as of Tuesday), they cut short their holdings by 16.7 percent. As the green bars in Chart 7 get shorter, the cash gets a tailwind. We had a little glimpse into this last week. As VIX rises, equities take a backseat.
But in the very near term, there is room for volatility to retreat further. Equity bulls put their foot down later last week. If they build on it this week, nearest resistance on the indices above can be tested. This likely creates a possible trading range – at least this week – for a weekly iron condor using QQQ (Invesco QQQ Trust).
QQQ May 17th iron condor:
- Short 188 call at $0.72
- Long 190 call at $0.26
- Short 182 put at $0.94
- Long 180 put at $0.58
The hypothetical trade earns $0.82 in credit; $1.18 is at risk. It is essentially a combination of a bear call spread and a bull put spread. Maximum profit is achieved if the underlying (185) closes between 182 and 188. Breakeven points are 188.82 and 181.18.
Thanks for reading!
