
Kudos to equity bulls for what they have achieved so far in the current run. And what a run it has been!
Off the February 11th intra-day low, the S&P 500 large cap index is up nearly 10 percent, the Nasdaq 100 index north of 11 percent, and the Russell 2000 small cap index 13 percent. Similarly, the Dow Industrials are up nine percent, and the Dow Transports nearly 11 percent, among others.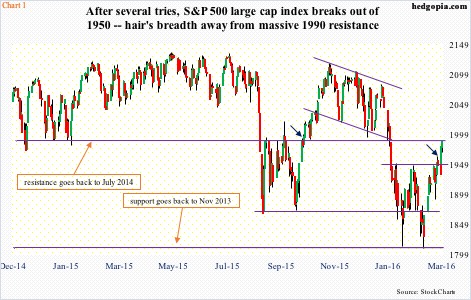
Focusing on the S&P 500, Nasdaq 100, and the Russell 2000, with the latest push higher, they have all convincingly retaken their respective 50-day moving averages, which are still pointing lower, but can begin to at least flatten out in the next several sessions. Shorter-term averages are all pointing up, and providing support.
The action on Tuesday in particular was impressive.
For the past seven weeks, all these three indices – and several others – have been confined by short-term straight-line resistance.
On the S&P 500, resistance lied at 1950 (Chart 1), which was hammered from below some seven or eight times before it gave way on Tuesday.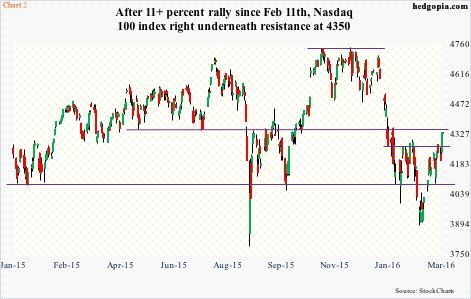
On the Nasdaq 100, 4265 was the ceiling that repelled several rally attempts (Chart 2).
And on the Russell 2000, the number to conquer was 1035 (Chart 3).
With resistance having taken care of, time to pop champagne?
Here is the thing.
Such was the damage during the January rout in stocks that support was lost left and right. What is lost will now resist rally attempts. Incidentally, with the recent rally, indices are right underneath major resistance.
On the S&P 500 (1986.45), this lies around 1990 (Chart 1). Resistance goes back to July 2014.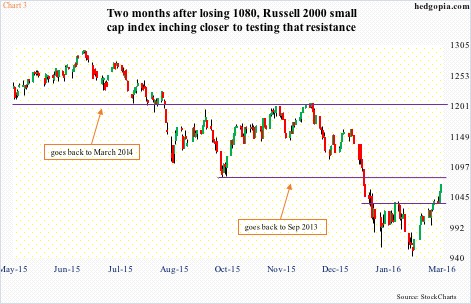
On the Russell 2000 (1065.67), it is 1080, which has proven to be an important price point going back to September 2013 (Chart 3). By the way, if 1080 is won over, there is another layer of resistance – just north of 1200 – before the index can have another crack at all-time highs.
And on the Nasdaq 1000 (4334.39), 4350 is where this ceiling lies (Chart 2).
Would the bulls be able to punch through these as well, as they did this Tuesday?
On a daily basis, these indices are grossly overbought, so digestion of the recent gains is perfectly normal here, but here is some perspective.
Early October last year – in the wake of the August-September rout – the S&P 500 broke out of a similar W formation as happened this Tuesday (arrows in Chart 1).
Back then, on a daily basis, the index was already in overbought territory, but stayed overbought until weekly indicators rallied into overbought territory. Off-late September low, the index rallied 13-plus percent in five weeks pretty much uninterrupted.
Currently, as was the case back then, there is plenty of room for weekly indicators to unwind the oversold conditions they are in. If things proceed as they did in October-November last year, not only could the S&P 500 break out of 1990 but test another resistance at 2040. It is possible.
But here is what could come in the way of this possibility from turning into probability.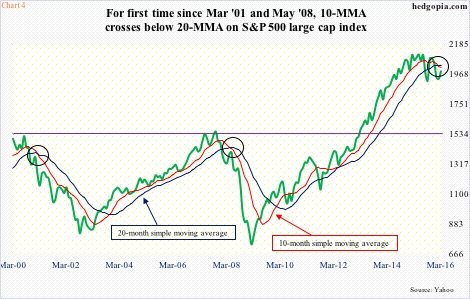
Structurally, there are differences between now and back then. The August-September correction was the first 10-percent decline since April-June 2012. That was more than three years. This time around, we have a second 10-percent correction three months after the first one. This has inflicted damage to investor psychology as well as to indices… technically, that is.
Indices are gradually rolling over, and this is what has resulted in a bearish crossover in Chart 4. It goes back 16 years, covering two bear markets. As is evident, it is rare for 10-month moving average to cross below 20-month average. We are talking monthly, not weekly or daily, so it takes a long time for this to occur. Hence its importance.
January (this year) was the first time in nearly eight years the S&P 500 witnessed a bearish 10/20 crossover. The last time this occurred was in May 2008, and March 2001 before that. In hindsight, both those crossovers proved prescient, as stocks got mauled.
With this as a background, the only way this signal is negated, and the S&P 500 goes on to break out of 1990 and onto 2040, and maybe beyond, is if Tuesday’s breakout results in attracting new money. A lot of it. Should this transpire, this would mark a trend reversal.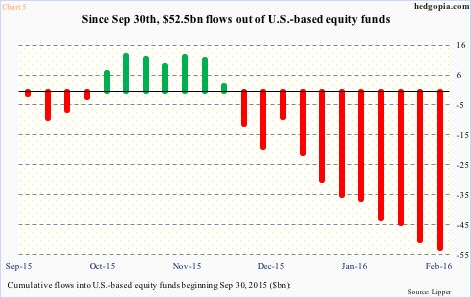
In the week ended Wednesday last week, $2.8 billion came out of U.S.-based equity funds (courtesy of Lipper). Since 2016 began, nearly $44 billion has been withdrawn. Since September 30th last year, which approximates the afore-mentioned low in the S&P – hence a good reference point – north of $52 billion has left equity funds (Chart 5).
Evidently, fund flows have so far not been a source of buying power. Short interest probably has.
Shorts probably contributed big time to the Tuesday breakout. Mid-February short interest on the NYSE composite stood at 18.5 billion, versus record 18.6 billion at the end of July 2008 (Chart 6). On the Nasdaq, it is nowhere near its 2008 record, but the trend is up. In the right circumstances, this is recipe for a squeeze. Once again, we probably saw some of that on Tuesday.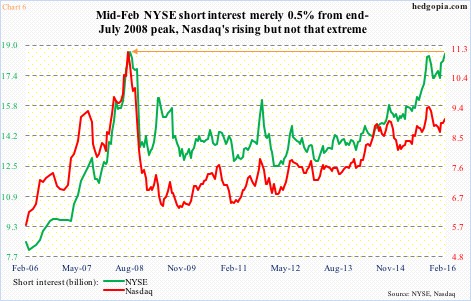
But if the mission is a convincing break out of major resistance, a push solely built on short squeeze is not going to cut it. It will fail, sooner or later. Ultimately, flows need to improve.
In that respect, if the Tuesday breakout was more a result of Chart 6 and not Chart 5, then odds favor resistance holds. On the S&P 500, a failure right around here would more or less confirm that this decline is different.
Thanks for reading!
