
Third time is a charm for small-caps?
Having tried – and failed – twice to break out of a months-long range, the Russell 2000 small cap index went for a third one last week. Odds favor it meets with the same fate.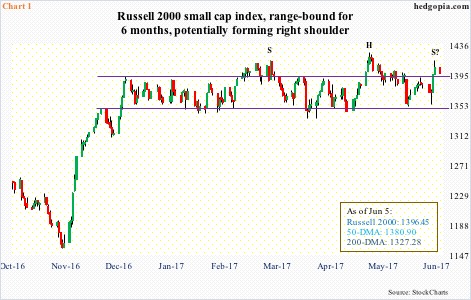
The index witnessed a big reversal last Wednesday. From that intraday low to Friday’s high, it jumped 4.4 percent. The reversal took place from near the bottom of a six-month-plus range (Chart 1).
The index began to play ping pong between 1340s and 1390s just a few weeks after the massive post-election rally last year.
Since then, there have been three breakouts. Two were false – one in February and the other in April. The break last week has the potential of becoming a third one.
Why?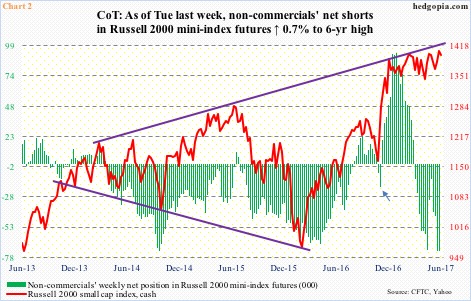
It is possible last week’s reversal is the result of a squeeze.
The reversal was preceded by non-commercials’ massive buildup of net shorts in Russell 2000 mini-index futures.
As of last Tuesday, these traders had amassed 73,030 net shorts. This was a six-year high.
It is worth recalling that they switched from net shorts to net longs in the week after the election last year (arrow in Chart 2), and could not have ridden the rally better. Holdings peaked in the first week this year, before persistently dropping. The Russell 2000 (cash) continued sideways.
Last week, these traders probably got squeezed. (Holdings as of today will be published Friday.)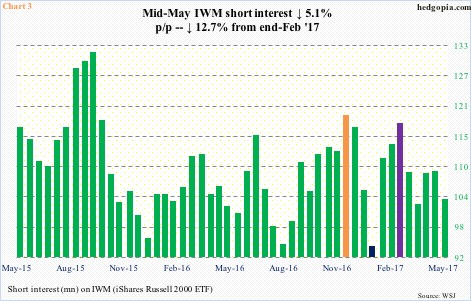
Some help likely also came from another group of shorts.
Mid-May short interest on IWM, the iShares Russell 2000 ETF, stood at 102.7 million, down 5.1 percent period-over-period. From end-February this year (indigo bar in Chart 3), short interest is down 12.7 percent. At the same time, it is up 9.6 percent from mid-January (blue). That low was the result of a post-election squeeze. From end-November (orange) to mid-January, short interest collapsed 21.3 percent, as shorts got squeezed.
If short squeeze indeed played a role last week, a rally built on one is not self-sustaining.
Ultimately, it is the flows game. And in this respect – at least going by IWM flows – momentum is lacking.
Within a month post-election, the ETF attracted $5.2 billion (courtesy of ETF.com). Then began the range-bound action in price. In the past six months, $2 billion has been withdrawn, even as the Russell 2000 marked time.
It is possible a genuine range breakout acts as a self-fulfilling prophecy, drawing in breakout traders. In this scenario, non-commercials likely will be forced to cover as well.
Here is a competing scenario.
Last Friday’s high, should it hold, can potentially mark the right shoulder of a bearish head-and-shoulders formation (Chart 1). The neckline lies at the bottom of the afore-mentioned 1390s-1340s range.
Regardless how it plays out, at least near term, the path of least resistance is down. The daily chart is overbought, and will be vulnerable particularly if the bears push the price back into the range. Monday closed just outside the top of the range.
Thanks for reading, and please share!
