
Of late, volatility has been volatile. Twice in the past 15 sessions, VIX, the S&P 500 Volatility Index, has surpassed 16, only to quickly reverse to the downside, and broken below 12 three times, only to reverse to the upside.
SPY, the SPDR S&P 500 ETF, has had its share of wild swings. It is still range-bound – trapped between 204 and 213 (Chart 1). Where then might it be headed next? Better yet, might options be a better way to play the ETF in the near-term? Let us dive in and find out.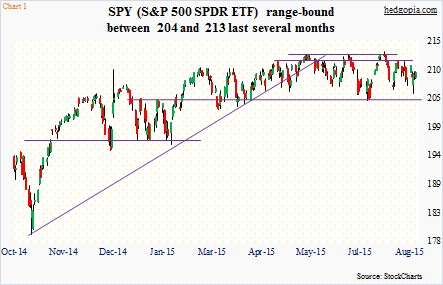
Last week’s action on SPY, combined with the Wednesday reversal, is encouraging if you are a bull. Although the distance between the 50- and 200-day moving averages is a mere three points now – the lowest since January 9, 2013 – and is narrowing. A death cross is possible in the not too distance future. Monthly momentum indicators are beginning to come under pressure.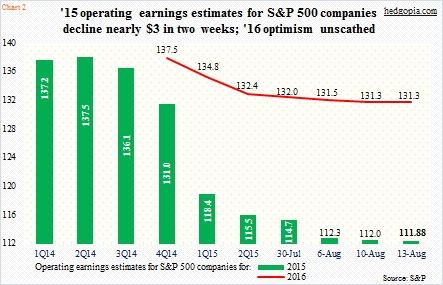
The point is, in the near-term there is fodder for both bulls and bears. The former – now that the earnings season is unwinding – expect buybacks to resume in earnest. The latter point to the rapidly deteriorating earnings picture. Within a couple of weeks, 2015 operating earnings estimates for S&P 500 companies have dropped by nearly $3 – from $114.73 on July 30 to $112.25 on August 6 to $112.03 on August 10 to $111.88 on August 13 (Chart 2). Earnings were $113.02 last year, so we are now looking at a down 2015.
This probably explains why short interest remains high. At the end of July, short interest on SPY stood at 309 million shares, down nearly 11 percent two weeks ago (Chart 3). Interestingly, the ETF was flat during the period, but did rise to $213.18 before reversing. That spike – testing May and June highs – must have caused a mini squeeze.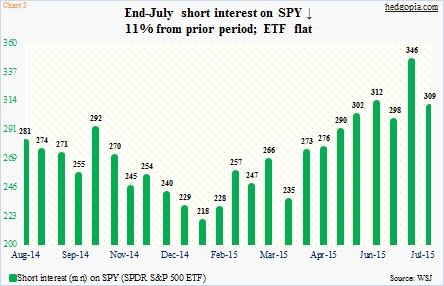
If bulls are able to regroup, and those highs are tested again – or even surpassed – the elevated level of short interest is a potential tailwind for stocks. In this scenario, Chart 4 is highly relevant – the red line in particular.
The chart plots the 21-day moving average of the CBOE put-to-call ratio and the call-to-put ratio of the ISE index, all equity. As of Friday, the ISE reading was the lowest since 118.9 on December 5, 2008. However, the CBOE reading in that session was .856, having peaked at .861 three days prior. Currently, the ISE reading is very low, the CBOE ratio not as low. Friday, the green line only stood at .706, with the most recent peak of .708 on July 27 – the highest reading since .713 on November 23, 2012.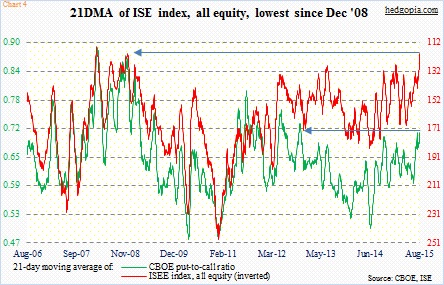
Further, if non-commercials had their way, they would love to see the ETF head south. As of August 11th, net shorts on S&P 500 futures were north of 162,000 contracts – at a five-week high and the second largest in over three years (Chart 5). These traders are bearish.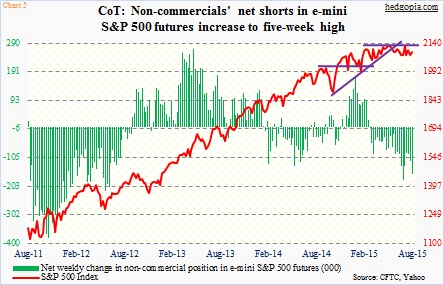
So where to from here? Considering that VIX seems to be itching to go lower near-term, SPY’s path of least resistance is probably up. The ETF has seen some accumulation in recent sessions. With that said, it has been range-bound for three months now, and will require tremendous force to forge a breakout.
Assuming the range-bound action continues – at least this week – here is a hypothetical trade using weekly options.
August 21st SPY 204/207/210/213 long iron condor
Long 213 call for $0.08
Short 210 call for $1.04
Short 207 put for $0.57
Long 204 put for $0.22
The trade nets a credit of $1.31; $1.69 is at risk. Breakeven is $211.31 on the upside and $205.69 on the downside. These are essentially two vertical spreads – a bear call spread combined with a bull put spread.
The thinking behind the trade is that SPY ($209.42) this week stays within the recent range. Maximum profit will be realized if it ends the week between $210 and $207.
Thanks for reading!
