
Since the February 11th low up until this Monday, if we just use small-caps to measure the pulse of investor mood, it has been risk-on.
From that low through the intra-day high this week, the Russell 2000 rallied north of 16 percent. In contrast, the S&P 500 large cap index was up 11 percent, the Nasdaq 100 index north of 11.5 percent, the Dow Industrials north of 10 percent, and the Dow Transports nearly 14 percent, among others.
Small-cap outperformance has been accompanied by positive inflows in recent sessions.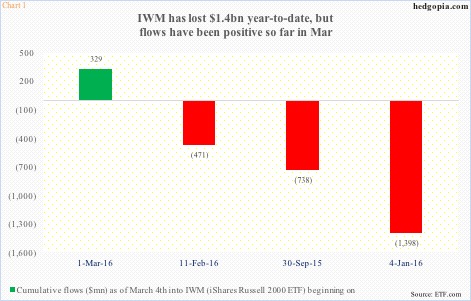
On March 1st, the Russell 2000 small cap index broke out of 1035. On IWM, the iShares Russell 2000 ETF, this corresponded to $103. Since then, IWM flows have improved.
During the first four sessions of March ended last Friday, the ETF attracted $329 million (courtesy of ETF.com). This is in sharp contrast to three other different periods highlighted in Chart 1.
Year-to-date, $1.4 billion left IWM – perhaps understandable given the shellacking it was handed out in January. Going back to September 30th – when stocks bottomed before rallying hard – $738 million came out of the ETF. And since February 11th, when IWM put in that afore-mentioned low, $471 million has been redeemed.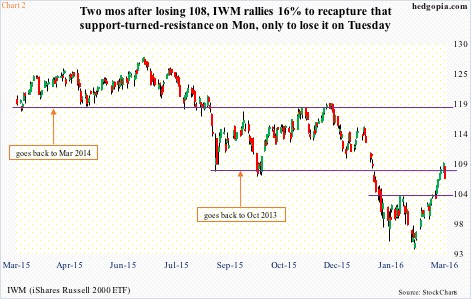
Until flows continue to cooperate, it is too soon to declare the breakout is for real. There have been false breakouts in the past. In February last year, IWM broke out of $118, only to give it back in August, followed by failed backtest of that resistance in November. The subsequent decline was waterfall-like (Chart 2).
That said, if the breakout is genuine, there is plenty of unwinding of oversold conditions left to be done.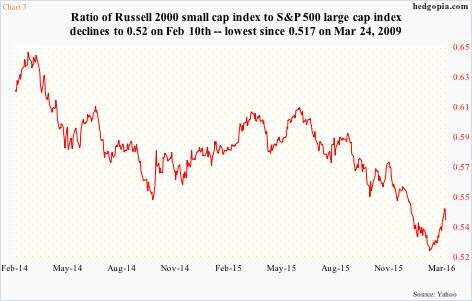
The ratio of Russell 2000 to S&P 500 large cap index, for instance, made a low of .52 on February 10th (Chart 3). This was the lowest since .517 on March 24, 2009. Notice the spike on the bottom right of that chart. Bulls sure hope the trend persists. But odds are growing that at least near term, this pauses at best and reverses at worst.
The afore-mentioned breakout took place last Tuesday. This did not deter non-commercials from nominally adding to already sizable net shorts in Russell 2000 mini-index futures. At 61.2k contracts, holdings, as of last Tuesday, were at a four-week high, but not that far away from 61.9k a month ago, which was the highest since October 2014 (Chart 4).
So far this week, these traders’ instinct is spot-on.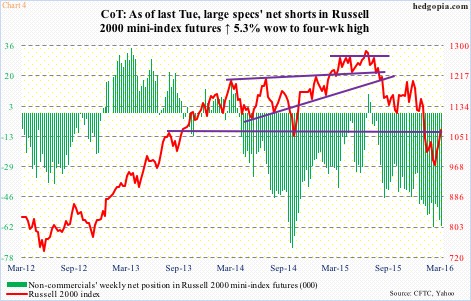
After the March 1st breakout, risk was building that the Russell 2000/IWM would continue to push higher and at least test or even break out of resistance at 1080/$108.
In fact, using IWM ($106.26), the breakout did take place this Monday – but, as it turns out, a false one, as come Tuesday the ETF was pushed right back below it (Chart 2). In a high-volume, large red candle session, it shed 2.4 percent.
The rejection at crucial resistance is taking place even as daily momentum indicators are excessively overbought. At least a breakout retest of $103 looks imminent near-term.
RVX, the Russell 2000 volatility index, seems to be sending a similar message.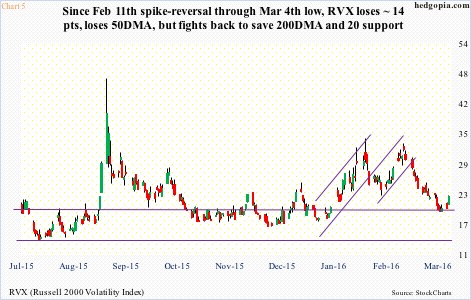
Off the February 11th spike high through the low last Friday, RVX (22.43) lost nearly 14 points, in the process also losing the 50-day moving average. But it has fought back to save the 200-day moving average as well as support at 20 (Chart 5). The 50-DMA lies at 25.06, which is flattish to slightly rising. RVX wants to rally here.
And the opposite is true for IWM. A breakout retest is in the cards. Incidentally, the 50-day moving average converges there as well. So bulls would probably fight tooth and nail to save this. And they better succeed. A breakdown here would greatly increase IWM’s vulnerability to a sharp drop.
Thanks for reading!
