
- IWM breaks out of 11-month range early Feb, but momentum slipping; loses Oct 14 trendline
- Short interest building from low level; large specs adding to net shorts in recent weeks
- Credit call spread to take advantage of probable sideways/down move near-term
When in February IWM, the iShares Russell 2000 ETF, broke out of an 11-month range, it naturally generated a lot of excitement. Especially because just six weeks earlier it had suffered a false breakout (blue arrow in Chart 1). About a month later in early March, that level – as well as the October 2014 trendline – was successfully tested (orange arrow in Chart 1), lending more credence that this time the breakout was real. Hello, risk-on!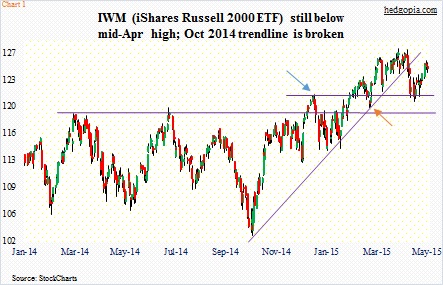
Since then, the ETF went on to rally nearly seven percent by mid-April. And that was about it. It peaked. Small-caps (represented by IWM/Russell 2000 small cap index) had begun to lag large caps (represented by SPY, the SPDR S&P 500 ETF) two weeks prior to that peak. SPY has gone on to score new highs, even as IWM has lost the Oct 14 trendline.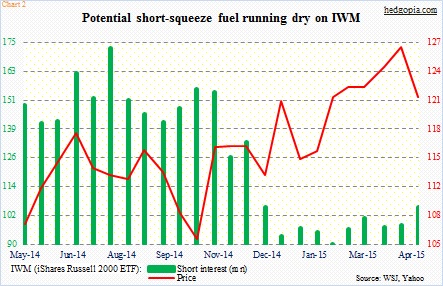
When that breakout took place, short interest on IWM was at a multi-month low (Chart 2). A high level of short interest is potential fuel for short squeeze, and it was acutely lacking. Notably, in the middle of October, short interest stood at 155 million, which in the next four months shrank to 89 million as the ETF rallied vigorously.
In the past five weeks, short interest has risen from that low but remains substantially below one-year highs (mid-May numbers will be out Wednesday). If the recent trend in buildup in short interest continues, this can potentially act as a headwind for the ETF. Of course, it can be a potential tailwind later on, but not when it is building.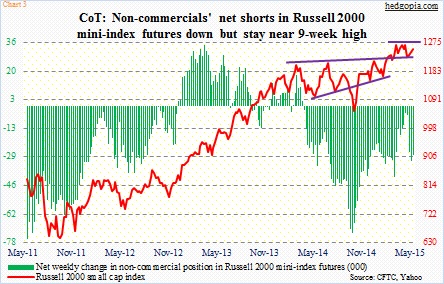
Which is what is going on in the futures market. By April 21st, non-commercials’ net shorts in Russell 2000 mini-index futures had decreased to 4,500 contracts, from as high as 73,000 at the end of last September (Chart 3), and have since continued to build, to 28,000 last week. To refresh, the ETF peaked mid-April.
So what happens with short interest as well as large speculators’ net shorts could very well decide where IWM is headed next.
As things stand now, momentum is on the wane. The ratio of IWM to SPY turned lower three sessions ago. Interestingly, just last Monday IWM rallied one-plus percent to surge past its 50-day moving average, but since then it has produced four straight daily dojis.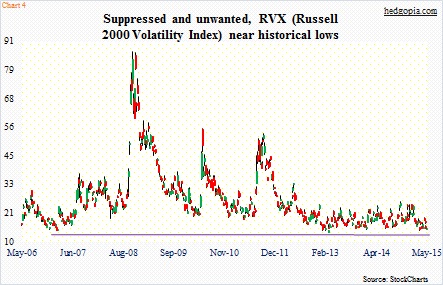
Volatility is suppressed. RVX, the Russell 2000 volatility index, sits near historical lows (Chart 4). Last Friday, it dipped below 15 before closing the session higher. The index only goes back to 2006, so it has a short history. But since inception it has only dropped below 15 eight times. That is it. And Friday was one. This could end up being nothing, or this could amount to something. Time will tell.
You put it all together, and it is beginning to look tempting to go short IWM outright. The ETF (124.43) is grossly overbought on a daily basis. The October 2014 trendline is gone. With that said, it still sits comfortably above that breakout point (Chart 1). And weekly momentum indicators look to be wanting to turn back up from levels they managed to swing higher in the past.
In the end, this could just be setting up as an opportunity to generate income in weekly options.
A June 5th 125/126.50 credit call spread nets $0.56 (short 125 for $0.91, long 126.50 for $0.35). It is a bear call spread, of course, and $0.94 is at risk. The long call helps limit the upside risk. The maximum profit is the premium received. Breakeven is 125.56.
Thanks for reading!
