
In the latest reporting period, there was a big drop in short interest on IWM, the iShares Russell 2000 ETF. It dropped 10.1 percent period-over-period to 118 million shares – the lowest since the middle of August. Shorts had been gradually building positions since particularly mid-July (Chart 1). The September 30th-October 15th drop in short interest went a long way in the 5.8-percent jump in the ETF during the period.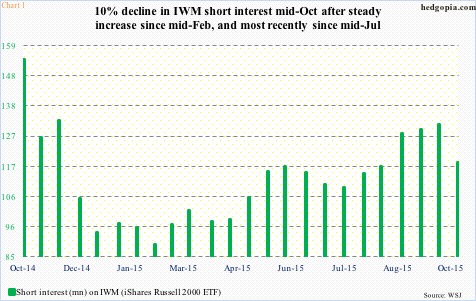
Are shorts in for more squeeze? Possibly, but probably not.
Short interest is nowhere near as high as was during the mid-October bottom in stocks last year, but remains elevated going back several months.
For small-cap bulls, there was a glimmer of hope last Wednesday – the day the FOMC statement came out – when IWM broke out of $116. The long white candle looked very promising. The session probably caused more shorts to give up. But bulls were unable to hang on to the breakout. The ETF was back below it in the very next session (Chart 2).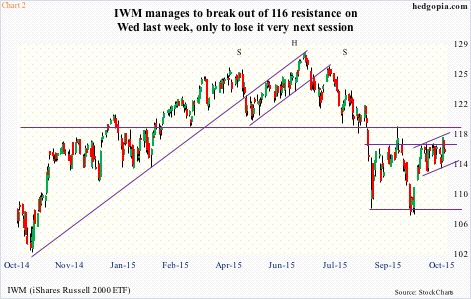
Since stocks in general bottomed on August 24th, small- and mid-caps have severely lagged their larger brethren. As a matter of fact, late September when major U.S. indices were testing the August lows, both the Russell 2000 small cap index/IWM and the S&P 400 mid cap index/MID went on to undercut those lows. And the rally since has been much weaker.
Since September 29th, the Russell 2000 is up 7.7 percent, compared to 11.1 percent for the S&P 500 large cap index and 14.7 percent for the Nasdaq 100.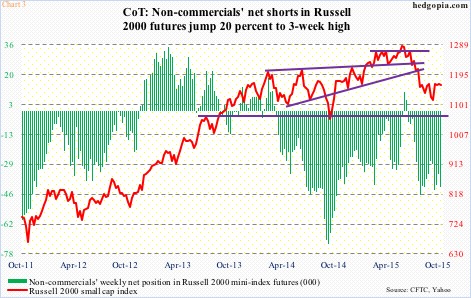
In this regard, non-commercials’ dogged bearish sentiment toward small-caps was telling. To be fair, they have been wrong directionally the past couple of months, but at the same time have shown enough conviction not to yield. As of September 29th, net shorts in Russell 2000 mini-index futures were 28,955 contracts, and rose to 41,447 as of last Tuesday (Chart 3). In contrast, net shorts in e-mini S&P 500 futures declined from 227,575 to 166,039 during the period. In the latest period, net shorts in Russell 2000 futures went up 20 percent, even as they declined 36 percent in the S&P 500.
Similarly, bearish sentiment toward small-caps continues in the options market (Chart 4). At/near-the-money open interest in puts outweighs that of calls. It must be pointed out that the concentration of put open interest is not as heavy as was the case, let us say, three weeks ago. Still, puts are seeing heavier activity.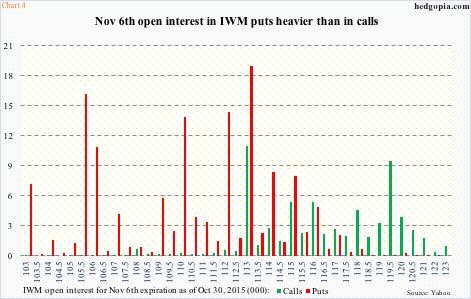
Amidst all this bearish sentiment, if bulls are able to force a genuine breakout in IWM ($115.34), then it has the potential to become a self-fulfilling prophecy. In this respect, the action in the back half of last week could be telling.
The inability to save the breakout speaks volumes about why the ETF is yet to test major resistance at $118-$119 in the past month and a half. This resistance goes back to March last year (Chart 2). Other major U.S. indices are at/near all-time highs.
Once again, it is hard to imagine a scenario in which this resistance gets taken out – at least this week. Under this assumption, calls can be hypothetically written to either go short near that level or generate premium. November 6th 116.50 calls are selling for $0.57. If called away, it is an effective short at $117.07. Else, the premium is kept.
Thanks for reading!
