
Since the August 24th low in U.S. stocks and the subsequent rally, some signs of risk-on are visible, but small-caps are substantially lagging large-caps.
In Chart 1, a product of XLV (healthcare), XLU (utilities) and XLP (consumer staples) is divided into a product of XLY (consumer discretionary), XLB (materials) and XLK (technology). These are all SPDR ETFs, and the sectors they each represent are in parenthesis. The former is used as a proxy for defense and the latter for offense.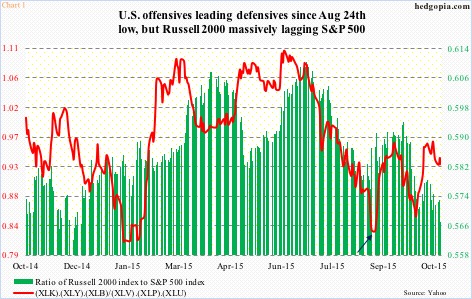
It is worth pointing out that XLV is probably not as defensive as it used to be in the past. Biotechs make up a big chunk of the ETF. In the top 10, Johnson & Johnson (JNJ) of course leads with a 10.4-percent weight, but there are three bio-techs in the mix – Gilead Sciences (GILD), 5.8 percent; Amgen (AMGN), 4.4 percent; and Celgene (CELG), 3.5 percent.
Off the August 24th intra-day low through September 17, IBB, the iShares Biotech Nasdaq ETF, rallied as much as 29 percent, but gave most of it back – as of yesterday, up only seven percent from that low. This has to have an impact on XLV. If not for biotechs’ lackluster performance, it would probably be higher, and the red line in Chart 1 lower.
Nonetheless, since that low (blue arrow in Chart 1), (XLK).(XLY).(XLB) has outperformed (XLV).(XLU).(XLP). Recently, the ratio peaked in the middle of October and is struggling to get going again.
On the other hand, the red line – a ratio of the Russell 2000 small cap index to the S&P 500 large cap index – is way lower than it was during that low. If traders are opting for risk-on, they are not using small-caps as a vehicle – which is what equity bulls would/should like to see happen.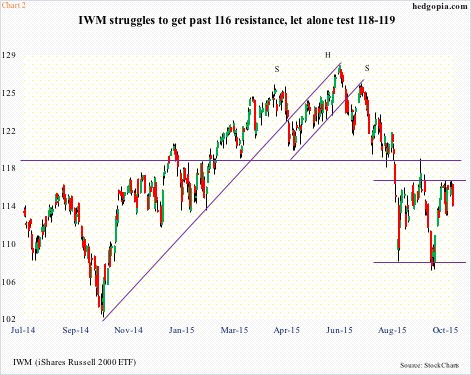
Toward the end of September, of the major U.S. indices, the Russell 2000 was the only one to have undercut the August lows. The subsequent rally stopped at the 1170 range. The corresponding resistance on IWM, the iShares Russell 2000 ETF, lies at $116 (Chart 2), and goes back to March last year. As does resistance at the $118-$119 range. The latter was tested once last month, and was vehemently rejected.
The ETF ($113.74) acts weak, with daily momentum indicators in overbought territory. Yesterday, it sliced through its 50-day moving average.
This is taking place even as RVX, the Russell 2000 Volatility Index, seems to be itching to move higher. Post-August 24th intra-day high of 46.66 through last Friday’s low, it gave back nearly 29 points, and has fallen back into a months-long range. However, for the last several sessions, buyers have shown up to defend another support – in the 18 range. Yesterday, RVX (20.10) rallied past its 200-day moving average, and has room to move higher.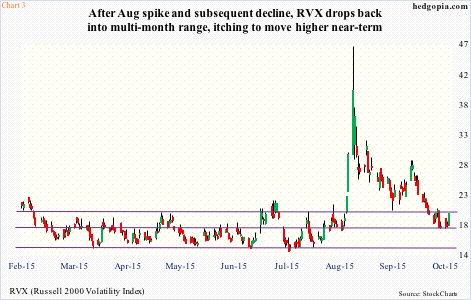
Ideally, the $118-$119 level would be a great spot to initiate shorts on IWM. It does not look like it will get there anytime soon. Now, resistance at $116 is in play.
One way to play this is by – once again – using options. Hypothetically, weekly October 30th 116 calls fetch $0.44. The idea is to generate income – at the same time ready to go short near the afore-mentioned resistance. If it is called away, it is a short at $116.44.
Thanks for reading!
