
As things stand, it is hard to be bullish on small-caps. As a group, they have been lagging for some time, and act weaker technically than large-caps.
IWM, the iShares Russell 2000 ETF, has more or less been going sideways since March 2014, although there have been wide swings along the way. The horizontal support/resistance that began back then has been like a magnet. Price keeps gravitating toward that line (Chart 1).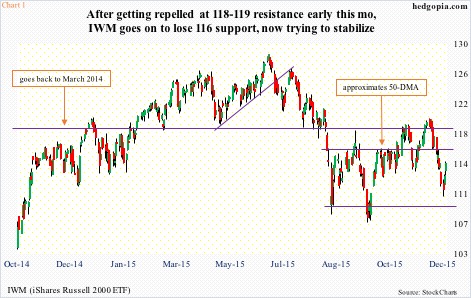
Most recently, the $118-$119 resistance was tested early this month; the 200-day moving average, now dropping, lied at $120 and change. The breakout attempt was rejected big time. The subsequent selling had it also lose minor support at $116, which also approximates the 50-day moving average.
Earlier in September, the Russell 2000 small-cap index, along with the S&P 400 mid-cap index, were the only ones of major U.S. indices to have undercut August lows.
With small-caps underperforming, along with what is going on in the high-yield space as well as the transports sector, it is hard to make a case of aggressively getting long stocks in general. Investor apathy toward small-caps clearly reflect a risk-off attitude.
If the interest-rate hike yesterday is meant to reflect the Fed’s conviction in the U.S. economy, then investors are not convinced. Small-caps by nature are domestically focused, and they are struggling to attract investor attention.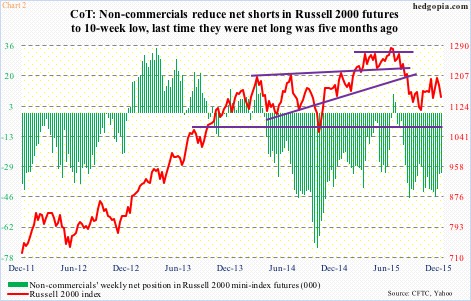
In this regard, non-commercial futures traders have been spot-on. They have stayed net short Russell 2000 mini-index futures since July, raising their bearish bets in the very week after stocks bottomed in late August (Chart 2). As of Tuesday last week, they were still net short 32,522 contracts.
Despite this rather dismal outlook medium- to long-term, near-term is another matter.
On a daily basis, stocks in general are oversold. Small-caps are no exception.
With the Fed finally moving yesterday, the so-called sword of Damocles that was hanging over head is no more. Sure, the debate will now shift from what the dot plot is forecasting versus what markets are priced in for – the former projects four quarter-point hikes next year versus market expectations of two. That said, the ‘will it, or wouldn’t it’ uncertainty is now gone.
In the right circumstances, favorable seasonality can kick in, and maybe some catch-up trade for small-caps. In this scenario, the daily overbought conditions IWM ($114.43) is in will have room for unwinding. The ETF can be expected to at least test $116 – merely 1.4 percent away.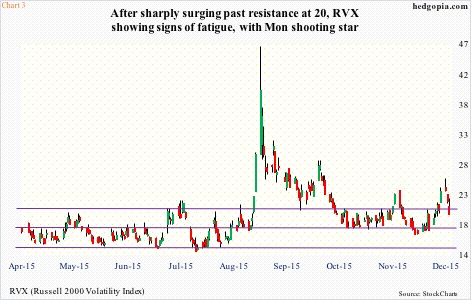
On a related note, how RVX, the Russell 2000 volatility index, is trading can throw light on where small-caps might be headed near-term. By Monday, RVX had spiked eight points in six sessions, in the process taking out resistance at 21 as well as 50- and 200-day moving averages. Monday also saw an intra-day reversal. In the end, the session produced a shooting star.
More often than not, a spike followed by a reversal tends to put volatility under downward pressure especially when it is overbought, which is the case now.
RVX is above both its 50- and 200-day moving averages, which are less than a point lower. At best, a test of these averages looks inevitable. At worst, RVX heads backs toward at least the middle of the range it is in (Chart 3).
IWM likely rallies in either scenario… it is just a matter of magnitude. As stated earlier, the nearest resistance it faces lies at $116. And options are probably once again the safest way to play this – if nothing else just for income generation.
Hypothetically, December 24th weekly 112.50 puts fetch $0.85. If it is put, it is an effective long at $111.65.
Thanks for reading!
