
The major US equity indices have either lost important support or close to doing so. Both large- and small-caps seem to be eyeing the 200-day.
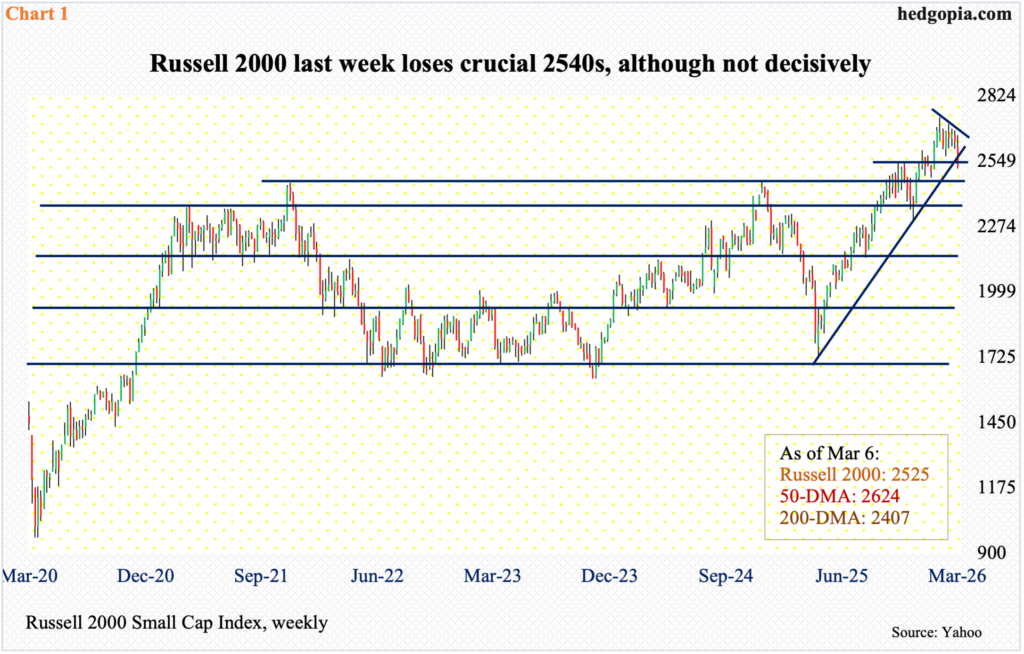
Small-cap bulls were unwilling last Friday to pounce on February’s dismal jobs report, rather sold off on the news. The Russell 2000 declined 4.1 percent for the week, losing 2.3 percent on Friday alone, closing at 2525.
Heading into last week, the small cap index had gone sideways for eight consecutive weeks since breaking out of 2540s, followed by a successful retest five weeks ago. Bulls could no longer hold the fort (Chart 1). That said, the breach is not definitive – not yet anyway.
The Russell 2000 printed a record 2735 on 22 January and has since made lower highs. Last week’s breach of 2540s also follows three weekly spinning tops in a row; then, there are these potentially bearish candles of November and December, which respectively produced a hanging man and a shooting star. A new high was recorded in January, but the month finished with a candle with a long upper wick; February formed a spinning top.
The recent momentum has been down. Further weakness will meaningfully raise the probability that the Russell 2000 is headed for a test of 2460s – a must-hold. In November 2024, the index retreated after ticking 2466. Three years before that, in November 2021, it rose to 2459 and then went the other way. Last September, those highs were surpassed, but not before a stretched bull-bear tug of war followed around those highs.
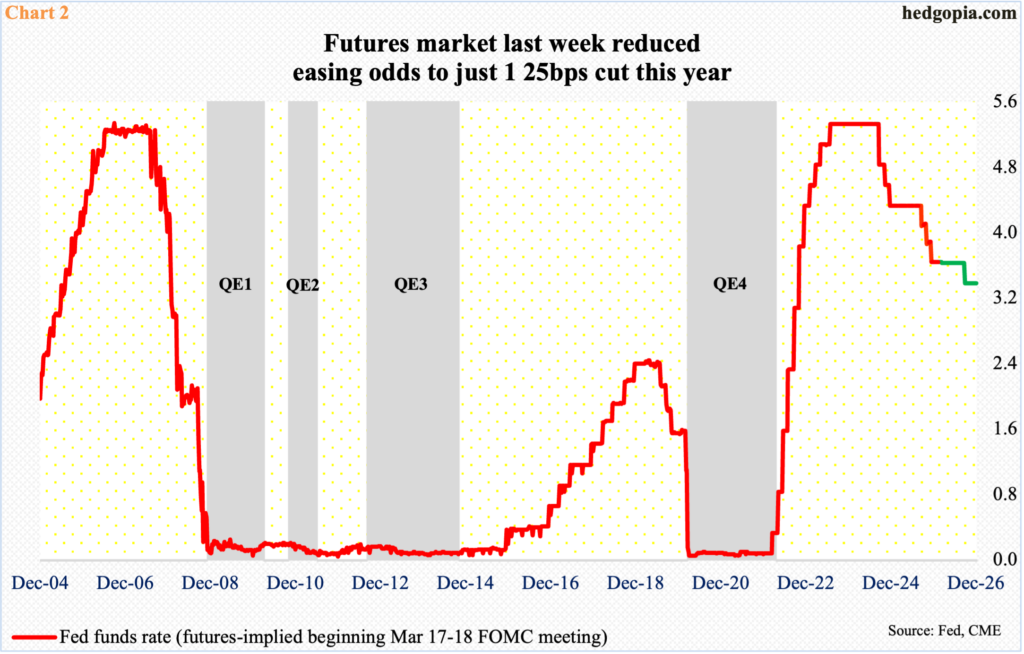
Last Friday’s negative reaction to February’s loss of 92,000 non-farm jobs raised a few eyebrows. Ordinarily, small-caps would have celebrated this news as this could translate to a more accommodative monetary policy than previously anticipated. Things, however, did not turn out that way. In the futures market, traders instead lowered the probability of a rate cut this year to one from two going into the jobs report.
The FOMC meets on 17-18 this month, and the fed funds rate is expected to be left unchanged at a range of 325 basis points to 350 basis points at that meeting. In fact, these traders do not expect a 25-basis-point cut until the September meeting (Chart 2). There are two more meetings after this, and no easing is priced in, with December odds at less that 50 percent.
The futures market is realizing that the Federal Reserve has a tough balancing act ahead.
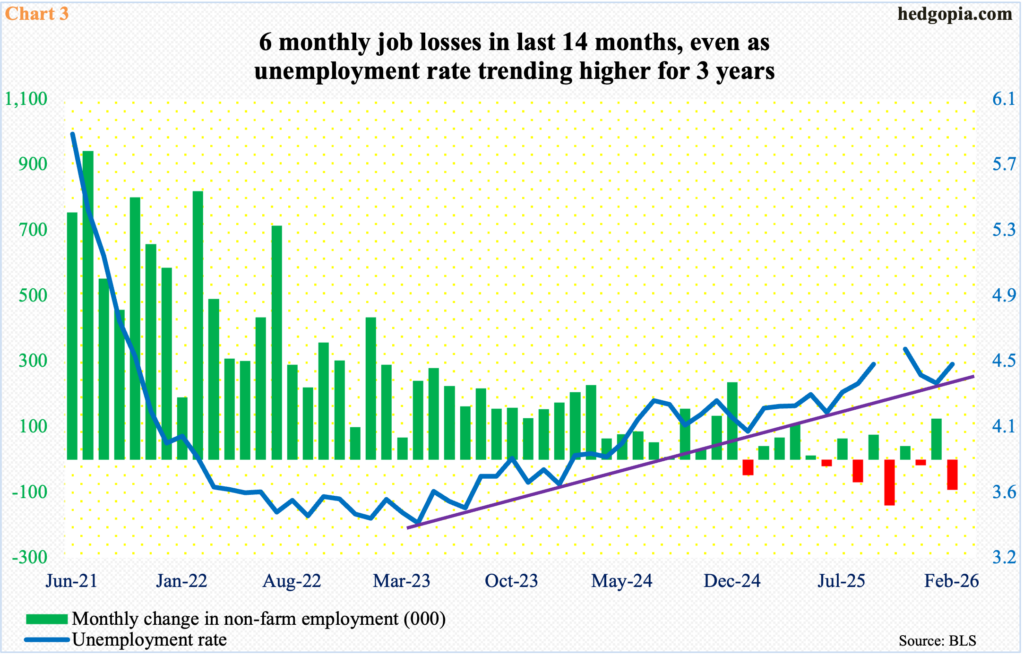
The central bank operates with a dual mandate of maximum employment and price stability. The jobs market is beginning to show cracks.
In February, the economy lost 92,000 jobs, which was a big downside surprise versus expectations of gains of 60,000. That is a negative swing of 152,000! Plus, January and December were revised lower by a combined 69,000.
February cannot be brushed off as a one-off. Over the last 14 months, there have been six negative months (Chart 3). Concurrently, the unemployment rate has trended higher. The monthly low of 3.45 percent in April 2023 was the lowest in 54 years; unemployment since has gradually trended higher, with February coming in at 4.44 percent, up from January’s 4.32 percent. One would think the latest weakness in job creation would force the Fed’s hands into adopting a looser monetary policy, but the Middle East conflict has thrown a monkey wrench into this.
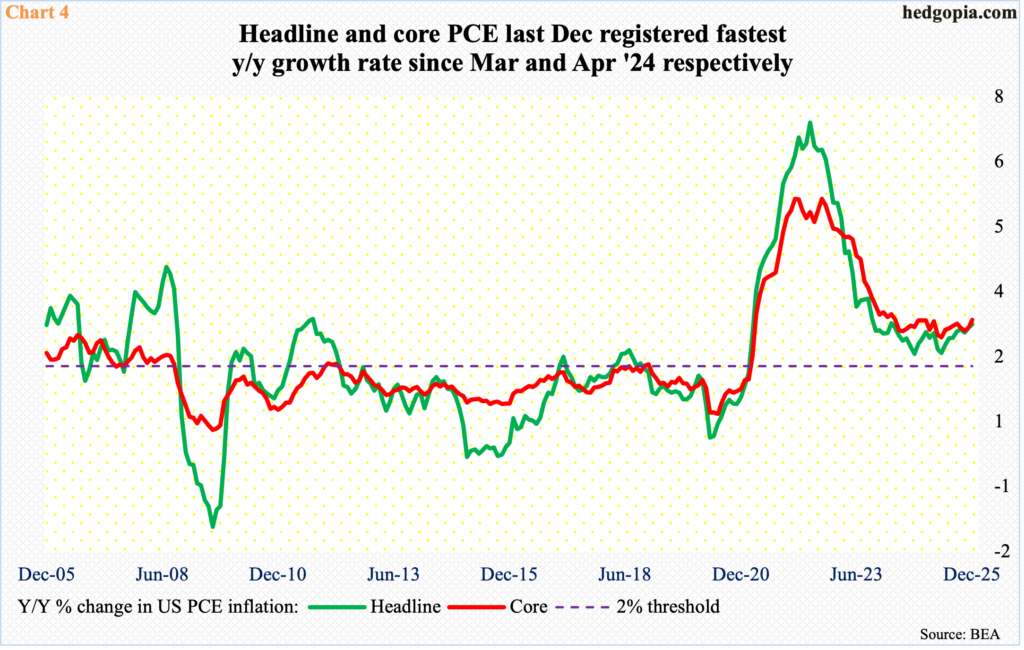
Already, headline and core PCE (personal consumption expenditures) has been on a gradual uptrend for the last several months (Chart 4). In the 12 months to December, they respectively registered growth rates of 2.9 percent and three percent. This was the fastest monthly pace since March and April of 2024, having bottomed last April at 2.3 percent and 2.6 percent, in that order. (January’s reading will be published on Friday.)
Back in June and February of 2022, headline and core PCE, with the latter being the Fed’s favorite, respectively peaked at four-decade highs of 7.2 percent and 5.6 percent. They have declined a lot from those highs, but at the same time the recent momentum has been to the upside. The Fed targets two percent.
The latest spike in oil prices does not help. Within a week, West Texas Intermediate crude went from $67.02/barrel to last Friday’s $91.27. At the time of writing this, crude futures were up another 25 percent before paring gains. If sustained, this will have inflation risks, and the Fed will be forced to take this into account before making a rate decision.
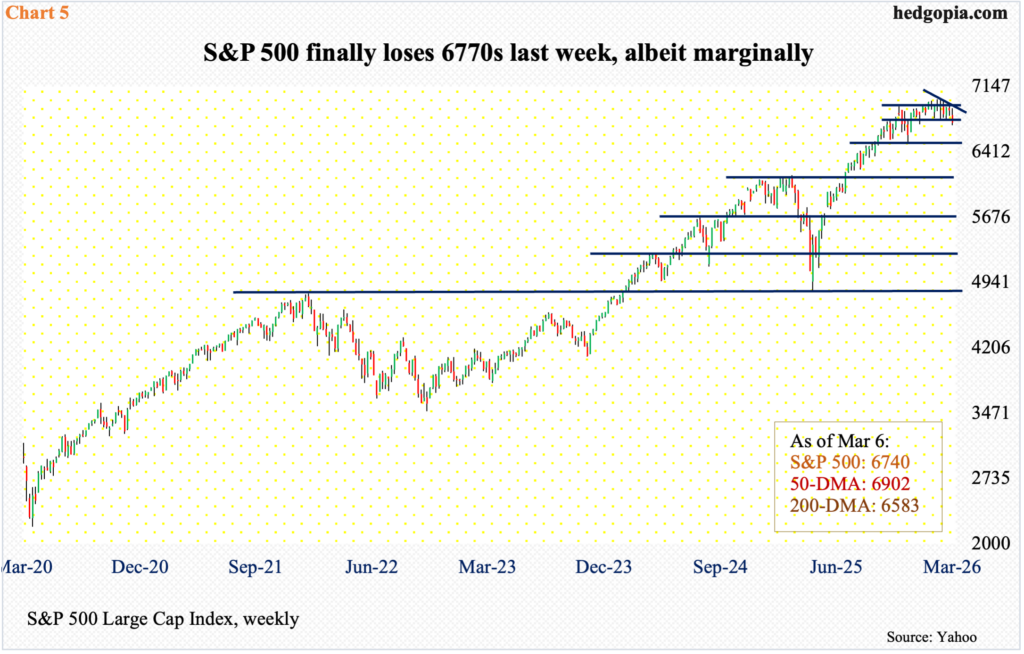
What is transpiring in the oil market is also reverberating through the stock market. Last week, the S&P 500 dropped a couple of percent to 6740, losing the potentially important 6770s (Chart 5).
The large cap index had been showing signs of fatigue for weeks. Last April, the S&P 500 bottomed at 4835. On 28 January, it peaked at 7002. A falling trendline from that peak repelled breakout attempts in the week before with a high of 6953; this was followed by last Monday’s high of 6901, which also tagged the 50-day moving average.
As a matter of fact, after a massive rally post-April ’25 bottom, the S&P 500 went sideways for 18 weeks before losing 6770s last week. This comes on the heels of four weekly spinning tops in seven weeks. On the monthly, February, January and December all produced a spinning top, preceded by November’s hanging man.
The 200-day, which has not been tested since last May, rests at 6583, and a test seems imminent. The average also approximates horizontal support at 6550s, which is a must-save. Failure to do so would open the door to 6100s.
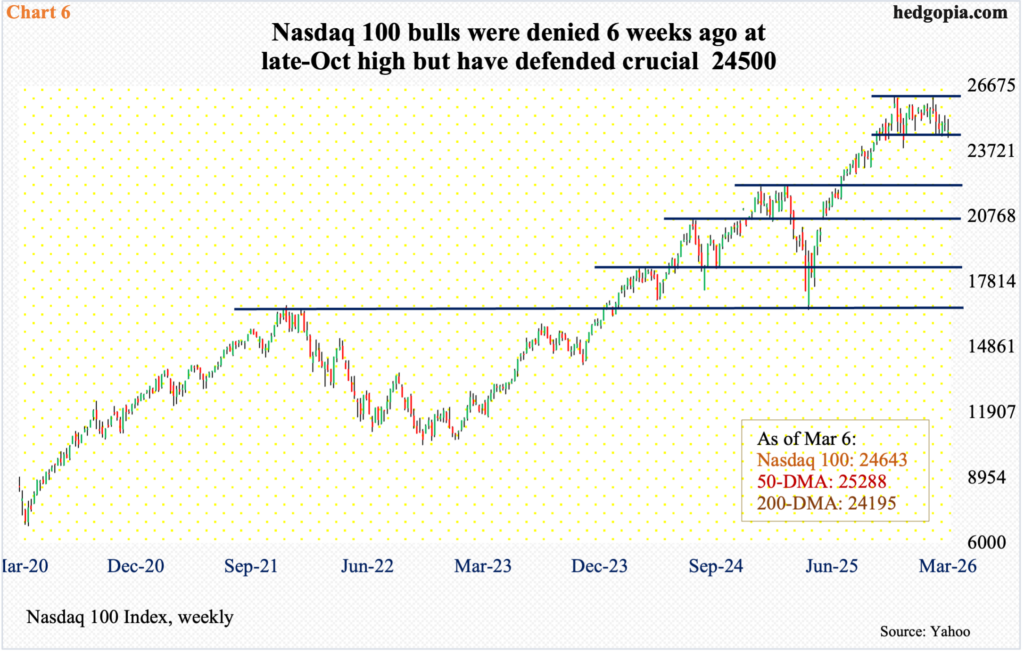
Similar dynamics are at play on the Nasdaq 100, which surged 58 percent between the intraday low of 16542 on 9 April and the 29 October high of 26182. On 28 January, tech bulls came within 17 points of this high and were rejected (Chart 6).
Last week, down 1.3 percent, a weekly spinning top showed up for the second week in a row. Despite all this, bulls have so far defended straight-line support at 24500. The Nasdaq 100 fell as low as 24316 last Tuesday but only to rally enough to finish the week at 24643.
The way the Nasdaq 100 is trading, it is just a matter of time before 24500 is breached. The index has been under the 50-day (25288) since 3 February; the 200-day is at 24195, and the index has not closed under the average for nearly a year now. A test is at hand.
Thanks for reading!
