
Last week, the VIX index and the S&P 500 moved together – a rare occurrence. At least near term, the former seems to be itching to move up and the latter down. Medium- to long-term, how tapering evolves, and its impact on the economy, which is decelerating on its own, is bound to reverberate through elevated earnings optimism for next year.
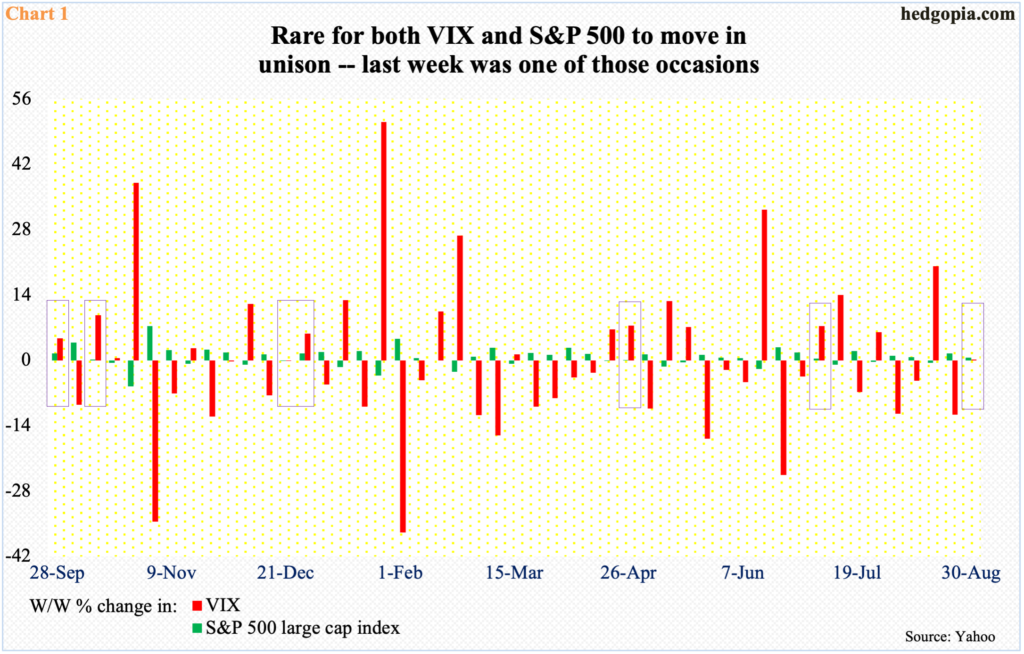
It is not often the VIX and the S&P 500 rally together. Ordinarily, they have a yin and yang relationship. One jigs and the other jags. But last week the large cap index rallied 0.6 percent and the volatility index edged up 0.1 percent.
Going back to late September last year, there have been six other instances when both moved in tandem (Chart 1) – either up or down – and this was followed by subtle pressure for stocks.
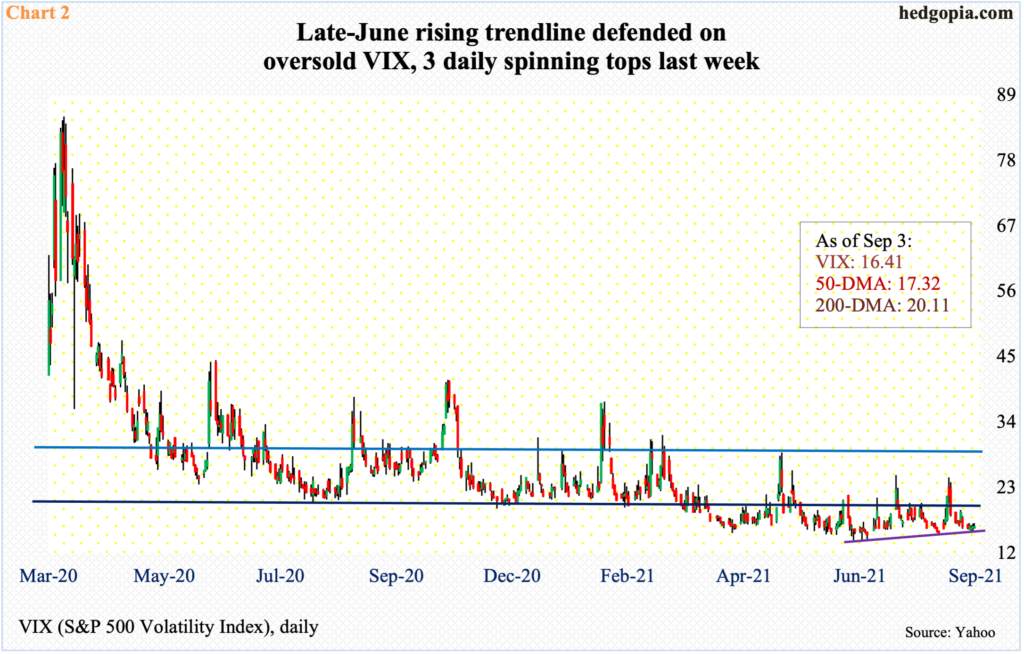
The volatility index (16.41) is itching to rally.
In the first four sessions last week, it fell below 16 intraday but only to rally to reclaim the level by close. On both Wednesday and Thursday, and arguably on Friday as well, a spinning top formed. All these three sessions found support at a rising trend line from June 29 when the VIX ticked 14.10.
The 50-day lies at 17.32, and after that there is not much resistance until the 200-day (20.11), which also approximates straight-line resistance at low-20s (Chart 2).
Longer term, the monthly has plenty of room to rally.
The S&P 500’s monthly chart is way overbought, having rallied in seven consecutive months – and in nine out of the last 10. From March last year, it has more than doubled.
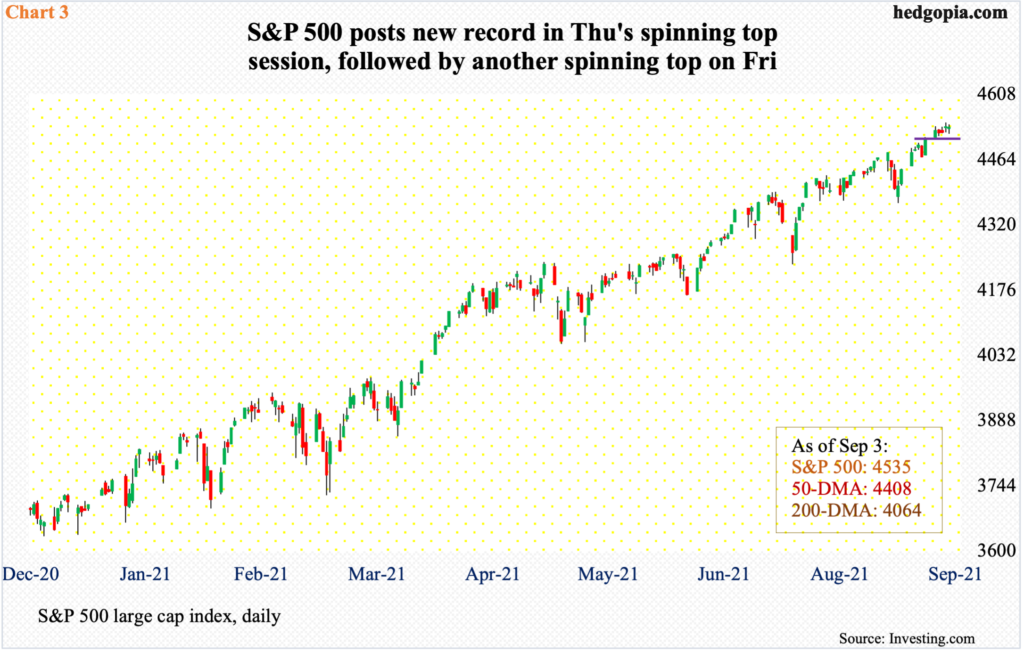
Amidst this, there were subtle signs of fatigue last week. Both Thursday and Friday produced dojis, while Thursday’s record high kissed the daily upper Bollinger band. The lower band is 3.1 percent lower. This approximates the 50-day at 4408.
Since the large cap index (4535) successfully tested its 50-day on August 19 through Thursday’s fresh all-time high of 4546, it already rallied four percent. This was the 10th defense of the average from May last year. Another test looks imminent in the sessions ahead.
Immediately ahead, there is short-term support at 4510s (Chart 3).
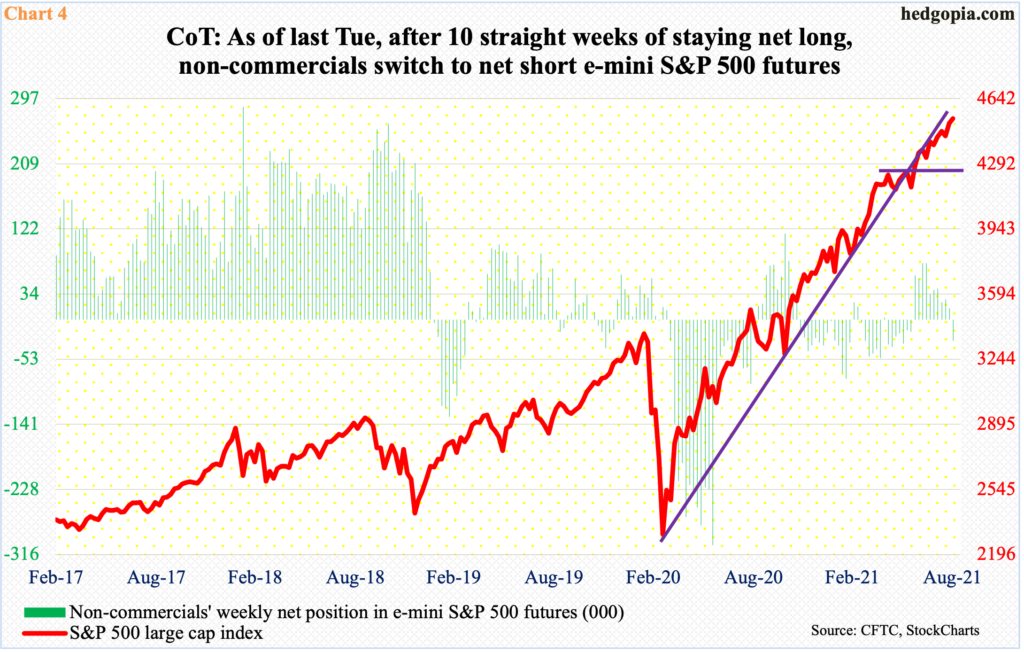
In the futures market, non-commercials seem to be positioning this way. For the first time in 11 weeks, they went net short last week. Holdings are as of Tuesday, and they switched from net long 14,893 contracts to net short 28,724 (Chart 4).
If things do not turn out the way they expect, there is always a risk of short squeeze. There have been plenty in the past when these traders got so overzealous in their bearish view that they ended up covering and aiding the longs in the process.
It is possible non-commercials were swayed by the prevailing talk around tapering.
At the annual Jackson Hole symposium in late August, Federal Reserve Chair Jerome Powell indicated that the central bank is getting ready to taper its bond purchases by the end of the year.
The Fed buys up to $80 billion in treasury notes and bonds and $40 billion in mortgage-backed securities every month. It is sitting on $8.3 trillion in assets, nearly twice what it held in March last year.
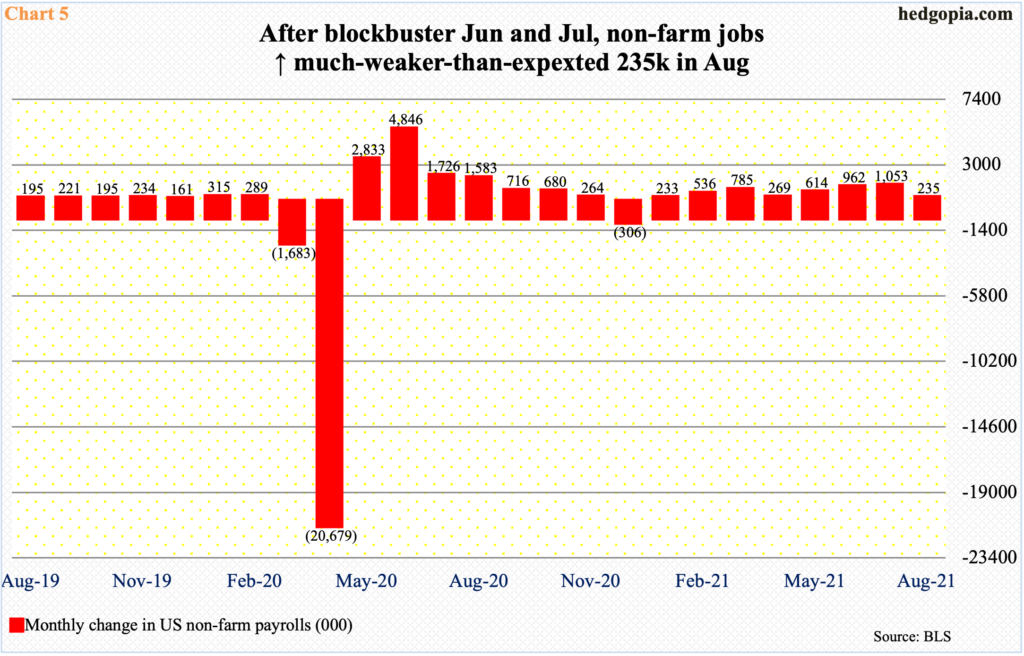
Powell has consistently said that there needs to be sufficient progress on the jobs front before reducing bond purchases, let alone hiking rates.
In February last year, non-farm jobs peaked at 152.5 million, just before collapsing to 130.2 million in the next couple of months. From that April low through August this year, 17 million jobs were created. June and July alone added 962,000 and 1.1 million respectively (Chart 5); it was this momentum that further boosted tapering talk. Then came August, and it disappointed – hugely. Only 235,000 jobs were created last month, versus expectations of 720,000.
The Fed meets in two weeks (September 21-22). One month does not make a trend, but August’s employment report has thrown what at one point looked imminent into limbo. It is very possible the FOMC would like to see September’s jobs report before announcing a timetable for tapering. This scenario suits equity bulls, but here is the problem they now increasingly face.
The collapse in the economy in the early months of last year that resulted in trillions in stimulus – both fiscal and monetary – has pretty much mended itself. As a matter of fact, several data points have now surpassed the pre-pandemic highs. Real GDP dropped to $17.3 trillion in 2Q20; four quarters later, it reached $19.4 trillion – a new record. Similarly, retail sales in April last year tumbled to $409.8 billion; one year later in April this year, sales hit a new high $628.8 billion, surging 53.4 percent year-over-year. It is impossible to maintain this kind of growth rate. By July, growth decelerated to 15.8 percent to $617.7 billion.
Deceleration is only a matter of time. The question is what slope it will take. If the economy is in for decent deceleration, then next year’s earnings expectations are in for serious adjustment.
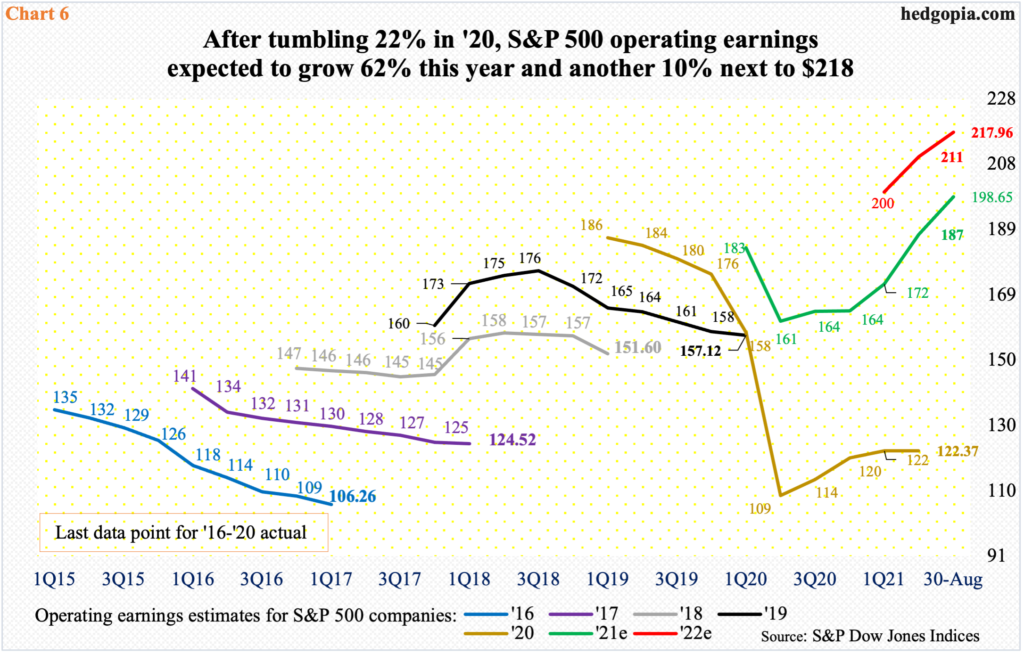
The sell-side expects $217.96 in 2022 S&P 500 operating earnings (Chart 6). This will be up 10 percent from this year’s expected $198.65. In 2020, they took home $122.37. Considering the prevailing persistently upward revision trend, no serious deceleration is currently in the price.
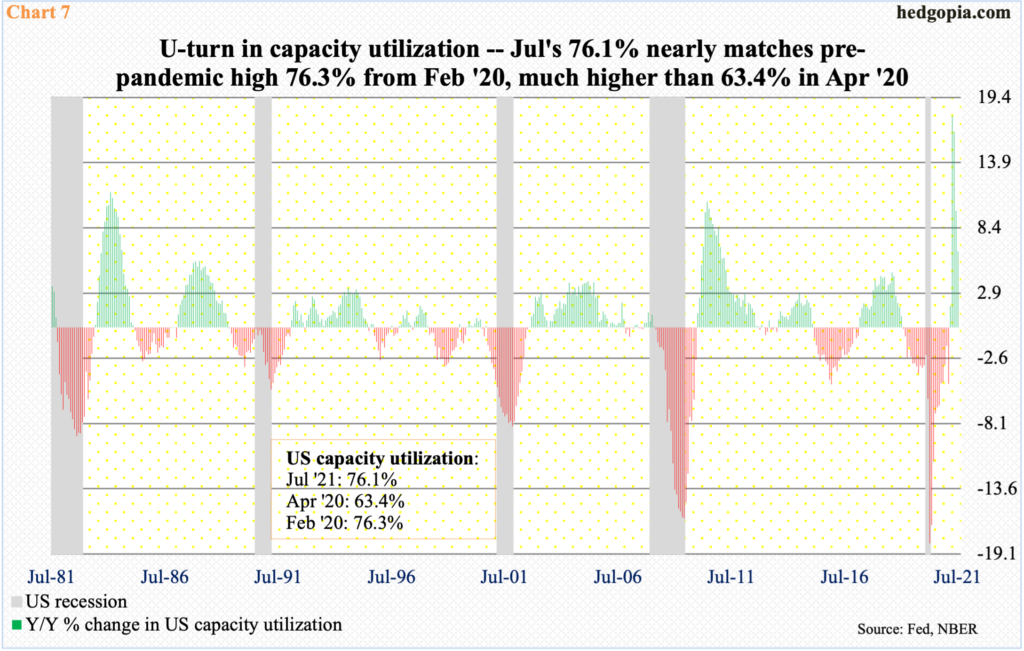
The reality is that the economy’s low hanging fruits have been picked. Capacity utilization tumbled to 63.4 percent in April last year. In July this year, utilization reached 76.1 percent, which just about erased the post-pandemic swoon. In February last year, utilization hit 76.3 percent. July’s y/y growth rate of 6.5 percent represented a substantial deceleration from April’s 17.9 percent (Chart 7).
If the economy continues to perform as expected, tapering is just a matter of time and this could in due course impact housing, etc. Alternatively, the economy decelerates on its own. There are signs it is already happening. In either scenario, the expected optimism around earnings growth next year will be tested. This is coming at a time when equity bulls are sitting on tons of paper profit, and at least a decent percent of them could be looking for a reason to lock in gains.
Thanks for reading!
