
Post-Brexit two-session sell-off in stocks was a clear risk-off. The S&P 500 large cap index dropped 5.3 percent in those two sessions. The subsequent four-session, 5.1-percent surge through last Friday was risk-on. Risk-off quickly followed by risk-on! The average investor has to be struggling to differentiate between signal and noise.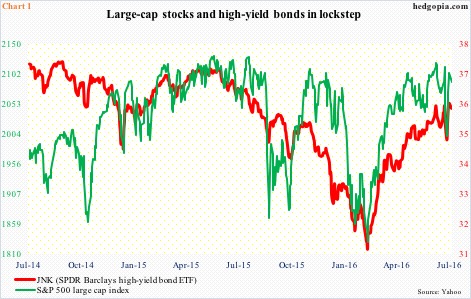
If we just focus on large-caps, it was risk-on in those four sessions, with full cooperation from high-yield bonds. Chart 1 plots the S&P 500 large cap index with JNK, the SPDR Barclays high-yield bond ETF, and both bottomed on Monday last week before pressing higher. (Yesterday was different, with both coming under pressure.)
Such quick shift from risk-off to risk-on is not that unusual. Happens all the time when sentiment shifts from bearish to bullish at/near market bottoms. March 2009 lows come to mind, or July 2010, or October 2011, or even September 2015, or February this year.
The problem this time around is this. Right before Brexit hit, the S&P 500 was merely one percent from its all-time high of May last year. The quick shift from risk-off to risk-on defies logic, especially considering that Brexit uncertainty lingers on.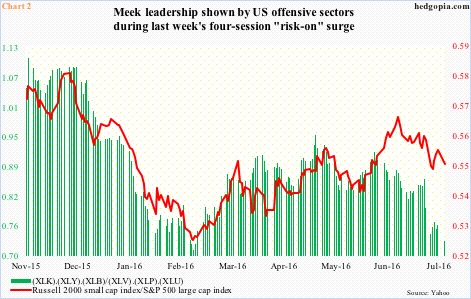
This is a view from 30,000 feet. A deeper look reveals what looked like risk-on might not be that at all, or at least less so.
The enthusiasm for large-caps in those four sessions was not shared by small-caps, for one. Ideally, in a risk-on environment – or at the start of one – the latter should be leading, massively at that.
The ratio of the Russell 2000 small cap index to the S&P 500 large cap index in Chart 2 did rise from 0.545 on June 27th to 0.55 on July 1st, but not much to write home about. Remember these indices rose in the five to six percent range during the period. (Yesterday, it dropped back to 0.546.)
Along the same lines, the green line in Chart 2 calculates a ratio between offensive and defensive sectors (all represented by SPDR ETFs) – the former by XLK (technology), XLY (consumer discretionary) and XLB (materials), and the latter by XLV (health care), XLP (consumer staples) and XLU (utilities). Once again, the ratio rose from 0.745 on January 27th to 0.765 on July 1st, but was already decelerating from June 29th’s 0.77. (Yesterday, it collapsed to 0.73.)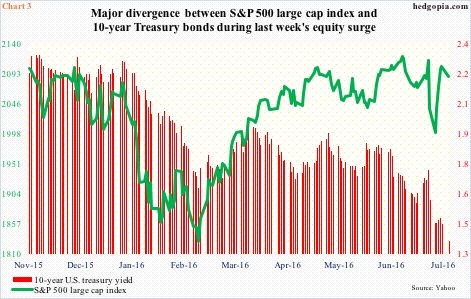
Perhaps the most vivid example of ‘was it risk-on or risk-off’ confusion could be seen when stocks were pitted against bonds. Not surprisingly, between June 23rd and 27th, 10-year yields dropped from 1.74 percent to 1.46 percent. The S&P 500 was pounded for a 5.3-percent decline in those two sessions, then rising 5.1 percent in the next four. The 10-year yield, however, went flat during those four sessions. This was a massive divergence, and shows traders were running for safety. The bond market was not buying the optimism shown by the stock market. (Yesterday, yields dropped to an all-time low of 1.36 percent before closing the session at 1.37 percent, surpassing the prior record of 1.39 percent in July 2012.)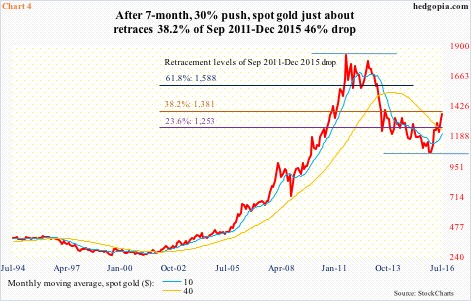
And there is gold. During the two-session risk-off period (June 24th and 27th), spot gold shot up 5.4 percent. No surprise here. This was typical of gold, but was atypical in the next four sessions when stocks were in a risk-on mode but the yellow metal went on to rally another 1.3 percent. A clear risk-off behavior – and in disagreement with what stocks were saying. (Yesterday, gold rallied one percent to $1,358.7/ounce, a stone’s throw away from an important Fibonacci ratio, which is portrayed in Chart 4.)
All this probably does not help strengthen the case for a breakout. The S&P 500 has gone sideways for the last 16 months, and a breakout here has potential to be huge. But with rotation occurring fast and furious during the four-session, “risk-on” rally, it is difficult to put higher odds on (1) a breakout, and (2) in case there is one, a sustained breakout.
Thanks for reading!
