
Here is a brief review of period-over-period change in short interest in the July 17-31 period in the Nasdaq and NYSE Group as well as nine S&P 500 sectors.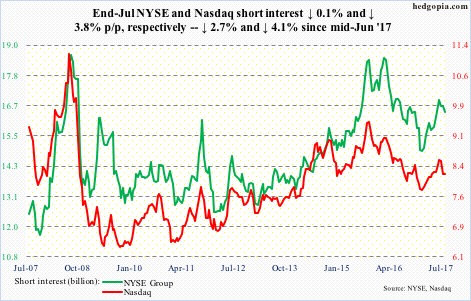
Nasdaq
Back on June 9, the composite (6352.33) developed a big engulfing candle, followed by a slight sell-off. Then on July 27, it rallied to a new high of 6460.84 but only to see it evaporate in another engulfing session.
Near-term notwithstanding, the path of least resistance is probably down medium term. First line of support lies just north of 6300, which was defended in Wednesday’s sell-off. The 50-day moving average rests at 6271.01.
NYSE Group
Tuesday, the composite (11929.46) rallied to a new high of 12019.85, but only to give back the early gains and end up with a reversal candle. This was preceded by a weekly doji last week.
The weekly chart is itching to go lower.
Near-term support lies at 11850, followed by 11600-11700. The 50-day lies at 11821.31.
…
XLB (SPDR materials ETF)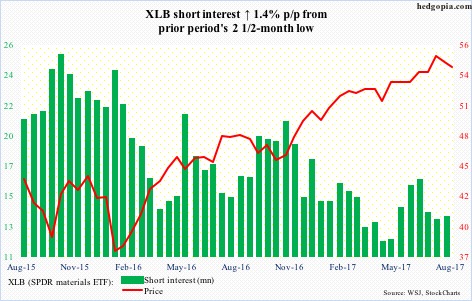
Since XLB (54.23) posted a new high of 55.92 on July 25, it has come under pressure, losing the 50-day on Tuesday, albeit not by much.
There is support at 53.50, followed by 51.
XLE (SPDR energy ETF)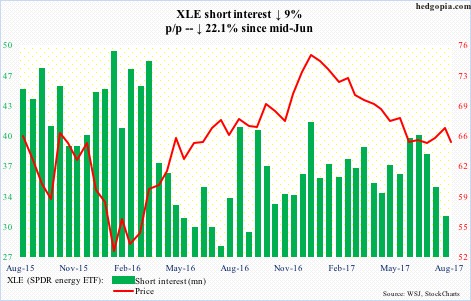
On July 19, XLE (65.05) broke out of a downtrend channel from last December, which the bulls continue to struggle to build on. The 50-day was recaptured and then lost.
The July 7 hammer low of 63.29 takes on added importance.
XLF (SPDR financial ETF)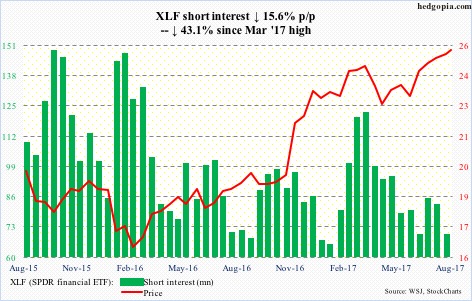
In May 2007, XLF (25.28) retreated after hitting 25.21. It then crashed to 4.12 by March 2009. That level was tested in March and July this year – unsuccessfully. The bulls finally forced a breakout this month, but a feeble one.
Tuesday, it jumped to 25.59 – a new record – before reversing. The session produced a gravestone doji.
Shorts continue to cut back.
XLI (SPDR industrial ETF)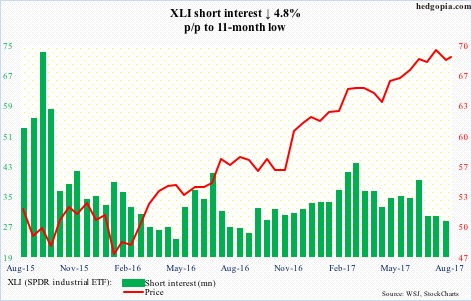
XLI (68.69) came under pressure after peaking at 69.57 on July 14. The subsequent drop found support at the 50-day, which also approximated support at 68. The bears need to take out that level before thinking of getting traction.
Short interest is essentially sideways for the past several months.
XLK (SPDR technology ETF)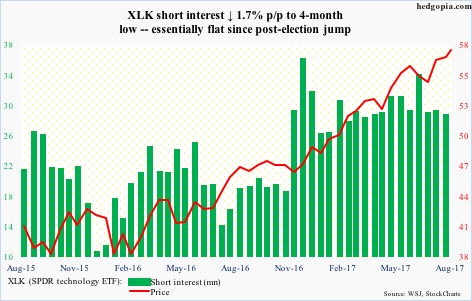
July 27 produced both a new high and a huge engulfing candle on XLK (57.85). Tuesday’s 58.33 surpassed that high but also produced a reversal candle at the upper Bollinger band. This followed a back-to-back doji and a long-legged doji on the weekly chart.
Medium term, risk is to the downside.
XLP (SPDR consumer stables ETF)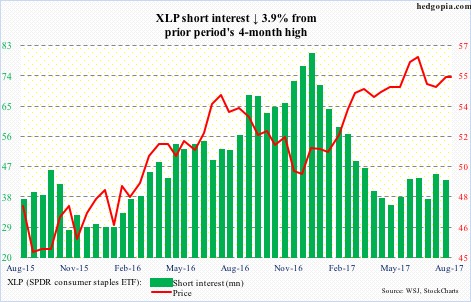
For the past several sessions, XLP’s (55.31) rally attempts have been repelled at the 50-day – now slightly dropping. The ETF peaked at 56.92 on June 5.
First line of support lies at 55, then 54. The latter is important.
XLU (SPDR utilities ETF)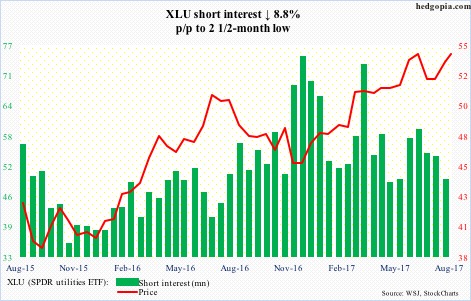
In May this year, XLU (53.89) staged an important break out of 51. A successful retest occurred in July. Now, it is itching for another breakout – out of 54-plus.
That said, Wednesday’s breakout attempt during which it posted a new high 54.40 was rejected hard. Daily conditions are overbought.
XLV (SPDR healthcare ETF)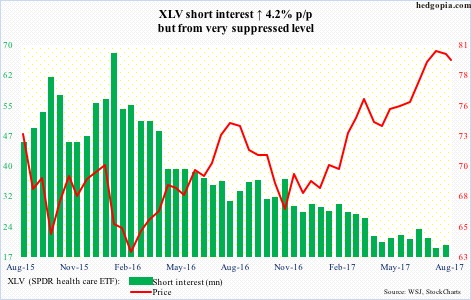
XLV (79.37) did rise to a new high 81.21 on July 25, but one-month resistance just north of 81 held. There is support at 79-plus, which is crucial and was defended on Wednesday. Right there lies the 50-day (79.05).
The ETF had a major break out of nearly two-year resistance at 75 in May.
XLY (SPDR consumer discretionary ETF)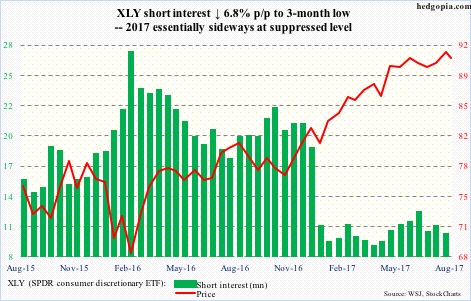
XLY (90.76) has come under slight pressure since reaching a new high 92.55 on July 27.
Near-term, this is where a tug of war likely gets fought between the bulls and bears.
Shorts continue to be in wait-and-see mode.
Thanks for reading! Please share.
