
Here is a brief review of period-over-period change in short interest in the December 16-29 (2017) period in nine S&P 500 sectors.
XLB (SPDR materials ETF)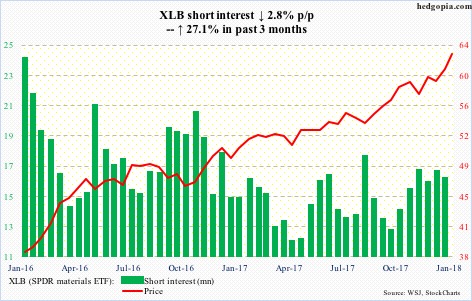
Already up 3.2 percent for the month/year, XLB (62.47) stayed with the daily upper Bollinger band for three weeks before reversing with a shooting star on Tuesday. Monday produced a hanging man. The 10-day moving average lies at 61.82. A test is likely near term.
XLE (SPDR energy ETF)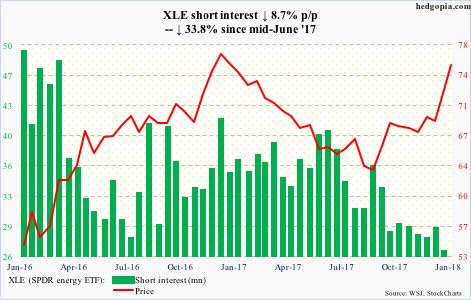
Between December 12, 2016 and August 21, 2017, XLE dropped intraday from 78.45 to 61.80. A 61.8-percent retracement of that decline works out to 72.09. The ETF (75.14) did stall at/near that resistance in late December, but only for a few sessions. Come 2018, it shot right past that.
Short interest, already low, likely fell further in the current period.
The ETF remains way extended. Besides the 10-day at 74.08, nearest short-term support lies at 72.50.
XLF (SPDR financial ETF)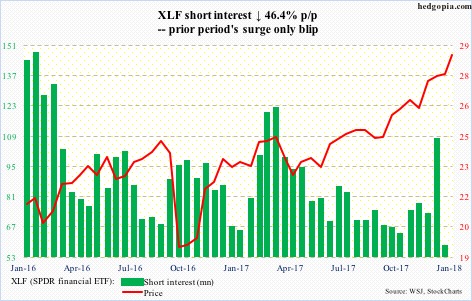
After essentially going sideways for nearly a month, XLF (28.83) broke out of that congestion at the start of 2018. Riding on the coattails of 10-year Treasury yields that rose 15 basis points this year, it has further added to that breakout. Shorts, having cut back big, likely got squeezed even more. This tailwind is no more.
Intraday Wednesday, the 10-year got repelled at 2.6 percent, where resistance is stiff and is not likely to give way that easily.
Friday, JP Morgan (JPM) and Wells Fargo (WFC) report 4Q17 results, followed by Citigroup (C) on the 16th, and Bank of America (BAC) and Goldman Sachs (GS) on the 17th.
They have already rallied decently into the earnings.
Breakout retest on XLF takes place at 28.25.
XLI (SPDR industrial ETF)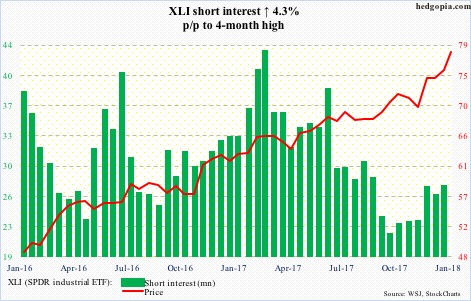
XLI (78.43) bulls defended the 10-day on the very first session of 2018, and have not looked back since. The ETF is already up 3.7 percent this year. That average has now risen to 76.93, and will be the first layer of support when XLI comes under pressure next.
XLK (SPDR technology ETF)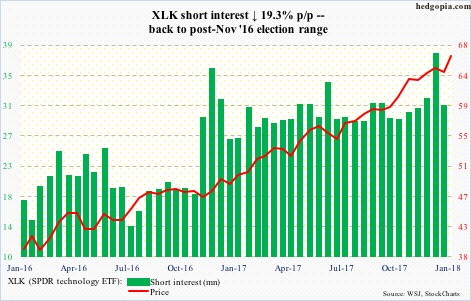
XLK (66.15) rallied to a new all-time high of 66.70 this Tuesday – past the March 2000 peak of 65.44.
Leading into this, shorts already cut back, but short interest remains elevated. It is possible the new high on XLK led shorts to pare back more. The ETF is up 3.4 percent year-to-date.
The daily chart is itching to go lower.
XLP (SPDR consumer stables ETF)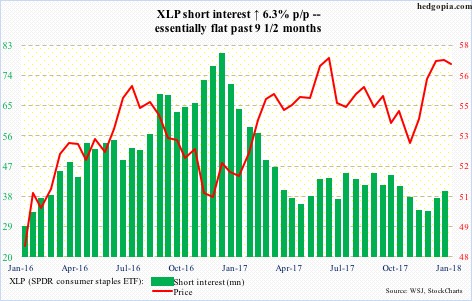
On December 18, XLP (56.71) tested the June 5, 2017 all-time high of 57.36, and was denied. This preceded quite a rally, having bottomed at 52.43 on November 7 last year.
This Tuesday, the bulls rallied the ETF to 57.27 intraday but were once again repelled at that resistance.
A breakout would be massive, but right at this minute it is looking suspect. The 10-day is on the verge of crossing under the 20.
XLU (SPDR utilities ETF)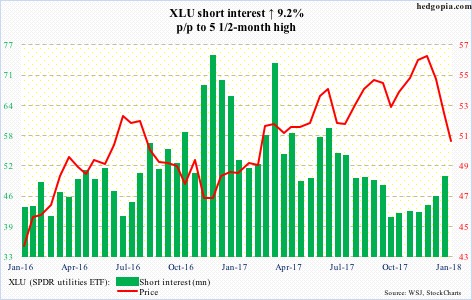
In seven weeks since mid-November last year through last Friday’s low of 51.07, XLU (50.74) was down nearly 11 percent. Support at 51 goes back to June 2016. As long as this held, risk-reward odds favored the bulls.
Come Friday, as 10-year yields continued to rally, 51 was lost. The bulls need to recapture this level – the sooner the better.
XLV (SPDR healthcare ETF)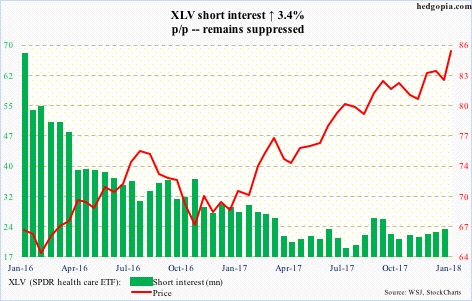
After several unsuccessful attempts particularly last month to break past the October 23rd all-time high of 84.31, the bulls took out that resistance as soon as 2018 was rung in, followed by a successful retest to boot.
That is the level to watch the next time XLV (85.79) comes under pressure.
XLY (SPDR consumer discretionary ETF)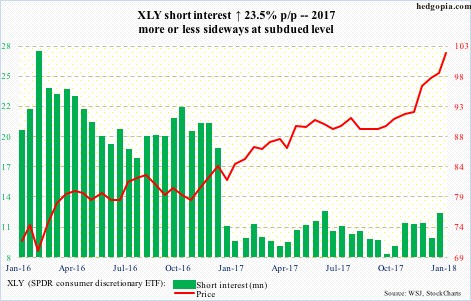
In the second half last month, XLY (102.03) went sideways around 99.40 for several sessions before beginning the new year with a breakout.
In the event the ETF comes under pressure, even before a retest occurs, the bulls will try to defend the 10-day (100.66).
Thanks for reading!
